Search for Correlations between Nearby AGNs and Ultra-high Energy Cosmic Rays
Abstract
The majority of the highest energy cosmic rays are thought to be electrically charged: protons or nuclei. Charged particles experience angular deflections as they pass through galactic and extra-galactic magnetic fields. As a consequence correlation of cosmic ray arrival directions with potential sources has proved to be difficult. This situation is not helped by current data samples where the number of cosmic rays/source are typically . Progress will be made when there are significantly larger data samples and perhaps with better catalogs of candidate sources. This paper reports a search for correlations between the RXTE catalog of nearby active galactic nuclei, AGNs, and the published list of ultra-high energy cosmic rays from the AGASA experiment. Although no statistically significant correlations were found, two correlations were observed between AGASA events and the most inclusive category of RXTE AGNs.
keywords:
highest energy cosmic rays – AGNs as sources – search for correlations1 Introduction
Perhaps the primary goal of all experiments studying the highest energy cosmic rays is to find the source of these particles. While circumstantial evidence may favor one type of source over another, demonstration of a clear correlation between the direction of cosmic rays and their sources is arguably essential. Unfortunately for electrically charged cosmic rays, galactic magnetic fields, and for the highest energy cosmic rays extra-galactic magnetic fields, cause angular deflections that can blur the correlation between cosmic ray arrival direction and source direction. If the sources as viewed from the earth are extended [1, 2] the problem is even more difficult. Unless otherwise noted, for this paper we assume compact (point-like) sources for the highest energy cosmic rays.
If the angular blurring from magnetic fields is small [3] (i.e. not significantly greater than the experimental angular resolution) and/or for neutral primaries, then experiments should observe cosmic rays that cluster in arrival direction [4, 5], and/or that correlate with potential astronomical (e.g. BL Lac) sources [6, 7, 8, 9, 10]. For nearby sources, where experiments should detect multiple cosmic rays/source, event clusters provide bounds on the cosmic ray source density [11, 12, 13] potentially favoring one type of source for the highest energy cosmic rays over another. However at this time the situation is less than clear as some results [14, 15] question the significance of the reported clusters and/or some of the BL Lac correlations [10, 16].
If deflections of charged cosmic rays by extra-galactic magnetic fields are not small [17], then lower energy, , cosmic rays should experience the greatest angular deflections. Unfortunately small experiment data samples and a cosmic ray flux have often caused studies to retain cosmic rays to energies, , well below GZK [18] energies [4]. Furthermore deflections of the highest energy cosmic rays even by our galactic magnetic field can be substantial [19, 20, 21]. As magnetic deflections scale proportional to the charge of the primary cosmic ray, nuclei in the cosmic rays may have significant deflections. Although most searches have looked for clustering and/or source correlations on small angular scales, studies at larger angular scales have also found evidence for clustering and/or source correlations [22, 23, 24]. Certainly the angular scale of cosmic ray clusters and the magnitude, and thus relevance, of the deflections of ultra-high energy cosmic rays by magnetic fields is not universally agreed to at this time.
In the future, significantly larger data samples will allow analyses to increase while retaining the number of observed cosmic rays/source (for nearby sources) . However another possibility is to exploit catalogs of candidate sources. With a catalog of source directions, cosmic rays can be effectively correlated with sources even when if magnetic field deflections are “not small” and/or when the the number of observed cosmic rays per source is allowing searches with existing data samples. That said, catalog based studies are limited by the completeness of the source catalog and the relevance (or not) of that class of astronomical source to the production of the highest energy cosmic rays. Often conjectured astrophysical sources include gamma ray bursts, GRBs, and/or active galactic nuclei, AGNs [25].
This paper reports a search for correlations between a catalog of nearby AGNs [26] and the published list of ultra-high energy cosmic rays from AGASA [4]. The components of our analysis are listed in Section 2. Issues that relate to data and AGN selection are given in Section 3. The cosmic ray–AGN comparison results are given in Section 4. Section 5 summarizes this study.
2 Analysis Components
Our comparison of ultra-high energy cosmic rays and a catalog of AGNs includes three components: the RXTE catalog of AGNs, the AGASA list of cosmic rays, and a Monte Carlo sample of uniformly distributed cosmic rays generated to match the experimental acceptance of AGASA.
The catalog of nearby AGNs [26] results from the Rossi X-ray Timing Explorer, RXTE, all-sky slew survey [27] sensitive to sources of hard X-rays (3-20keV). The survey excluded the galactic plane () but covered % of the remaining sky. X-ray sources were located to better than and then correlated with known astronomical objects. The efficiency for AGN identification was estimated to be with somewhat higher efficiency for northern AGNs () and somewhat lower efficiency for southern AGNs () [26]. The resulting catalog provides source directions and probable source distances and intrinsic X-ray luminosities, . The catalog is best for nearby AGNs as RXTE signal thresholds significantly reduced the efficiency for detecting distant sources; additional details are given below.
The list of ultra-high energy cosmic rays comes from published AGASA data [4].
The Monte Carlo sample of uniformly distributed cosmic rays was generated according to a distribution in local zenith angle, , and uniform in local azimuth. Events were then transformed to celestial right ascension and declination assuming constant detector aperture with time.
Correlations, between the AGASA events and the catalog of AGNs from RXTE, would appear as an excess at small angular separations in comparison to the Monte Carlo sample of simulated cosmic rays. To be clear, define unit vectors in the directions of cosmic rays, ûi, AGNs, v̂j, and Monte Carlo simulated cosmic rays, ŵk. A correlation signal should then appear near 1.0 in the distribution of dot-products: ûv̂j (if magnetic field deflections are modest). The index “” runs over the cosmic rays in the data sample. For each value of “”, only the AGN catalog source (index “”) giving the maximum value of: ûv̂j contributes to the distribution 111Thus each cosmic ray has one entry in the dot-product distribution. This choice is consistent with each cosmic ray having one source. As only the AGN source nearest in angle to the cosmic ray is chosen this can result in possible misidentification in the case of large source density.. The simulated distribution of random background comes from the analogous distribution of: ŵv̂j where index “” now runs over the sample of Monte Carlo simulated cosmic rays. As with the cosmic ray events, only the AGN catalog source (index “”) giving the maximum value of: ŵv̂j contributes to the distribution.
3 Cosmic Ray and AGN Selection
A few choices have been made in the comparison of AGASA data and catalog of AGNs from RXTE. These are described here.

The AGASA data have energies, EeV and populate values of declination: . As noted above, the steep cosmic rays spectrum, , and modest number of events: 57 with EeV and 29 (just over half) with led us to consider three (overlapping) bins in energy: , and EeV. The last was to see if there are any correlations with the AGASA super-GZK events. Except for the EeV selection, most of the cosmic rays are predicted, at least under the assumption of proton primaries [28], to originate at values of redshift, 222This corresponds to a distance Mpc; see Fig. 1.

To match the AGASA acceptance, we selected AGNs with . We have also made selections on the redshift of the AGNs to consider sources only with RXTE source detection efficiency %.
The estimate of the RXTE source detection efficiency involves two issues:
-
1.
the RXTE instrument source detection threshold (i.e. the selection bias) VS redshift from Fig.1 of Ref. [26],
-
2.
the number density of AGNs VS redshift and intrinsic X-ray luminosity from Table 2 of Ref. [30].
Motivated by Ref. [30], we divide the AGNs into the two categories: all-AGNs and broadline-AGNs. For the all-AGN category we require that the X-ray 3-20keV intrinsic luminosity 333For our study we relate the RXTE 3-20keV intrinsic luminosities, in ergs/s, to 2-8keV intrinsic luminosities, in ergs/s using: ; private communication from Sergey Sazonov., ergs/s, to match the RXTE data. With this intrinsic luminosity threshold the estimated all-AGN number density is Mpc-3 consistent with the RXTE source density determination of Mpc-3 [26]. For the broadline-AGN category we require that the X-ray 2-8keV intrinsic luminosity, ergs/s as this selects X-ray sources that are likely to be AGNs based purely on energetic grounds [29]. With this intrinsic luminosity threshold the estimated broadline-AGN number density is Mpc-3.
Combining the RXTE detection threshold with our definition of two categories of AGN (above), we obtain the fraction of each AGN category VS redshift. This is shown in Fig. 2. Based on this result we restrict the redshifts for the all-AGN category to and the redshifts for the broadline-AGN category to .
4 Cosmic Ray–AGN Comparisons
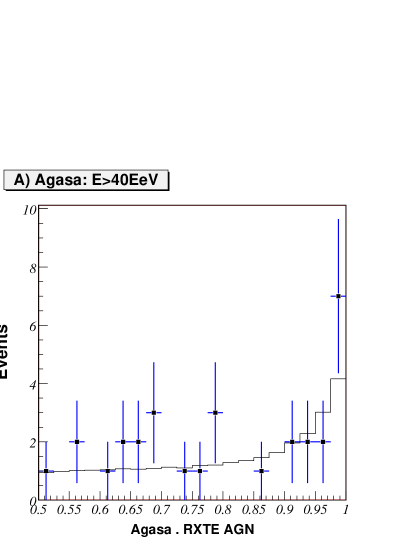
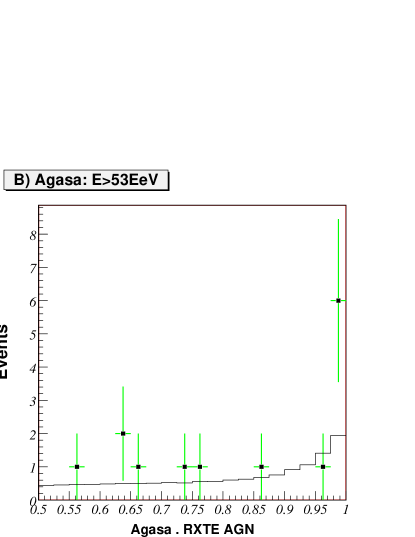
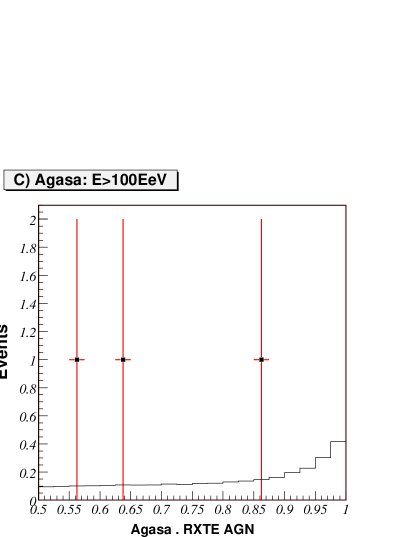
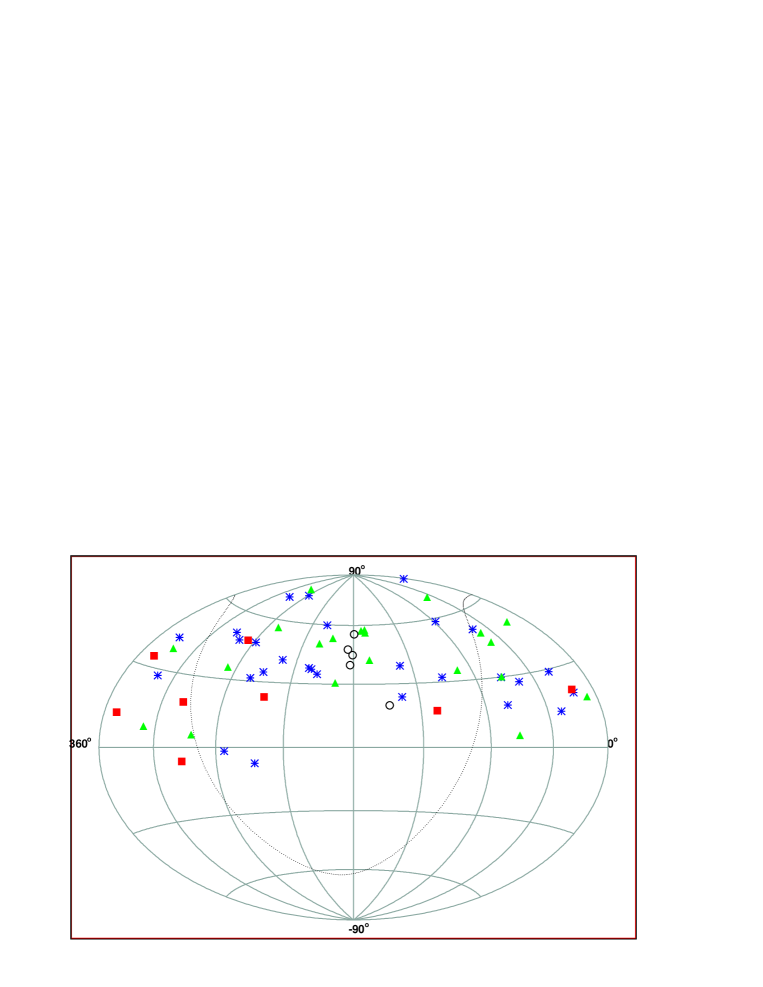
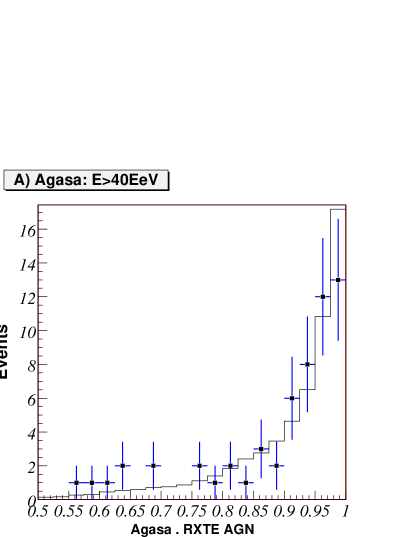
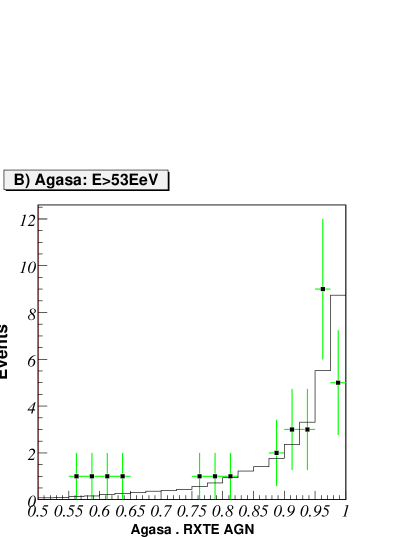
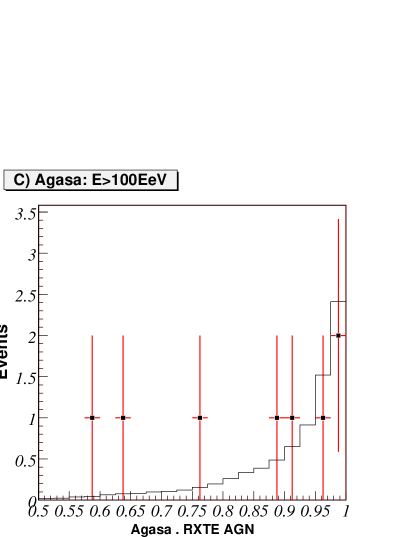
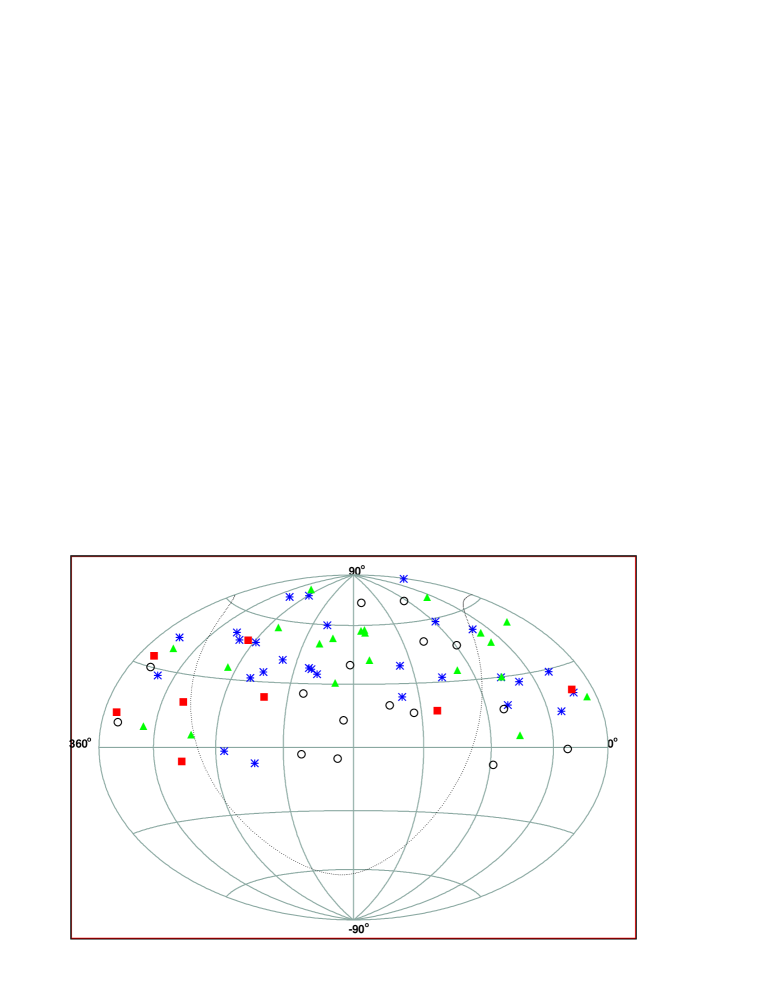
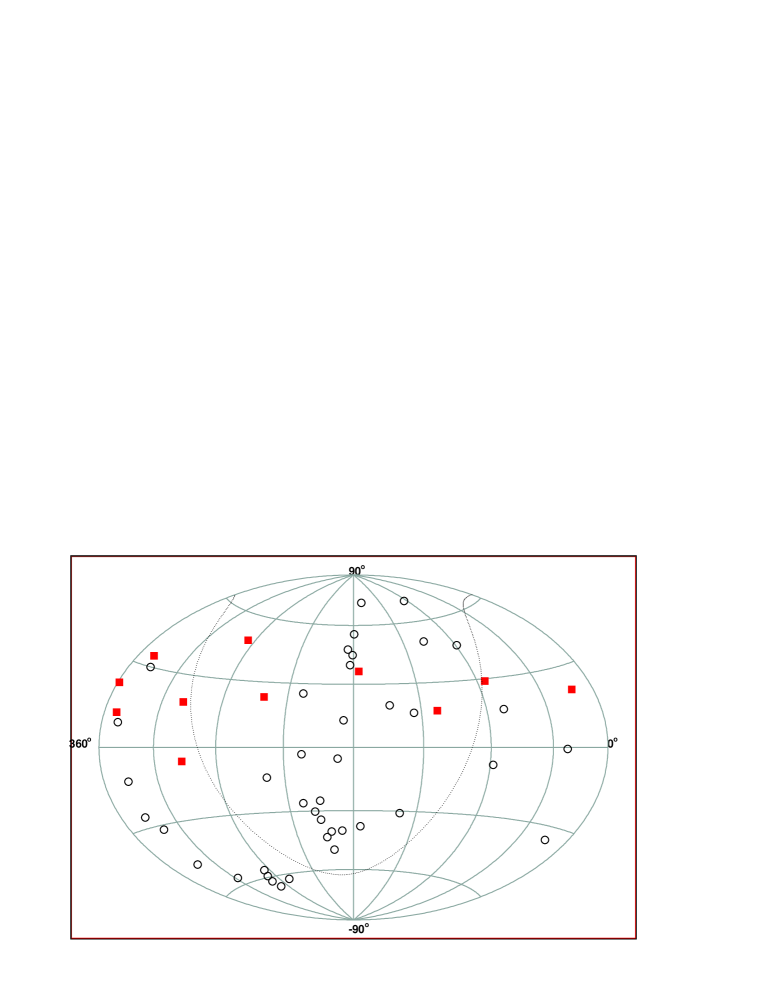
Plots of the distribution of dot-products (see definition in text) for the all-AGN selection are shown in Fig. 3. A plot of the AGASA cosmic ray and RXTE AGN directions are given in Fig. 4. The analogous plots for the broadline-AGN selection are shown in Fig. 5 and 6. A comparison of Figs. 4 and 6, shows two events shared between the two selections. Independently we have verified that all RXTE AGNs with redshift satisfy at least one of our two AGN categories.
 |
 |
 |
 |
 |
 |
The plots of the dot-products for the all-AGN selection, Fig. 3, shows a small excess in the bin nearest to 1 for the AGASA event selections EeV, and EeV. For this bin (i.e. dot-product ) the excesses are and standard deviations for the AGASA event selections EeV, and EeV respectively. If this correlation is valid, then it could provide experimental information to bound the magnetic deflections of extra-galactic cosmic rays.
To see if the all-AGN category excesses are consistent with e.g. typical GZK models, see Fig. 1, we estimate the RXTE AGN catalog efficiency as follows:
-
1.
90% sky coverage of the % of the sky surveyed 444This corresponds to the sky fraction outside a avoidance zone about the galactic plane;
-
2.
87% estimated completeness factor;
-
3.
% estimated average all-AGN source detection efficiency (from Fig. 2).
This yields an lower bound estimate for the all-AGN RXTE efficiency of %. However for the all-AGN category (only 5 sources, see Fig. 4) it is likely that the global (redshift independent) RXTE efficiency factors are not appropriate 555In particular assuming an average AGN source density of Mpc-3 (see above) and the RXTE global efficiency [26] of %, the predicted number of nearby () RXTE AGNs is approximated half those observed. While the small number of AGNs makes this weak statistically, it is nevertheless consistent with: a RXTE global efficiency of % for nearby () AGNs and/or with a local over-density of AGNs. Although these estimates were based on the AGN number density VS X-ray luminosity from Ref. [30] the AGN number density VS X-ray luminosity deduced by the RXTE experiment [26] gave a similar result.. To obtain an upper bound estimate for the all-AGN RXTE efficiency we assume the global RXTE efficiency is %. Then the estimated (upper bound) all-AGN RXTE efficiency is %.
The estimated number of cosmic ray:all-AGN coincidences is: the number of cosmic rays (with sources in a given redshift region) times the average all-AGN source detection efficiency (for the same redshift region). Thus the estimated number of cosmic rays from the region is obtained by dividing the excess counts, Fig. 3, by the all-AGN efficiencies to obtain: 2.8/0.77 2.8/0.50 or events and 4.0/0.77 4.0/0.50 or events respectively. As fractions of all the observed cosmic rays these are: /57 (or %) and /29 (or %) respectively. These fractions are somewhat, to significantly (depending on the all-AGN RXTE efficiency), in excess of typical GZK models assuming proton primaries, see Fig. 1.
Finally we note that the AGASA/HiRes cosmic ray quartet (or possibly quintet [31]) cluster, at RA , Dec [15], is near one of the the RXTE AGNs at: RA , Dec and redshift . In contrast, there is no close correlation in the all-AGN selection with any of the AGASA super-GZK events [4] plotted in Fig. 4 (more below).
The plots of the dot-products for the broadline-AGN selection, Fig. 5, are consistent with random background. If we assume the cosmic rays are primarily protons, then we can use a model such as Fig. 1 to estimate the number of cosmic rays expected from sources with redshifts . Then e.g. for the AGASA selection EeV, we expect % to originate from sources with redshifts or events. However the number that should appear in dot-product bins near 1 depends on the RXTE AGN catalog efficiency. Similar to the evaluation above, we obtain an overall broadline-AGN RXTE efficiency of %. Thus we should observe a signal as an excess of events. Unfortunately in absence of a signal signature (i.e. dot-product bins in excess of random background) or of a bound on magnetic field deflections, any statement on lack of excess depends on the assumed dot-product range. That said, assuming any signal would appear at dot-products then events should result in a standard deviation excess. With the AGASA statistics and our current knowledge of cosmic ray deflections by magnetic fields, no strong conclusion can be drawn.
The final issue is the evidence for, or against, correlations between the RXTE catalog of AGNs and the most energetic AGASA events. To investigate this, we show in Fig. 7 all of the AGNs from the RXTE catalog with and all of the AGASA events above 100EeV as updated on the AGASA web site [32]. Now with 11 super-GZK events: 3 have dot-products , are close to the galactic plane (region unobserved by RXTE) and the remaining 5 do not correlate well (e.g. dot-product ) with the RXTE catalog of AGNs.
While the 3 AGASA super-GZK events that are close to RXTE catalog AGNs are consistent with random background, on inspection these events all have dot-products . In this case the expected random background is . Furthermore one of these events, with energy EeV and RA , Dec , is close to the group of very nearby ( in Fig. 4) AGNs. The closest correlation is with the RXTE AGN at: RA , Dec and redshift .
Of the 5 AGASA super-GZK events that do not correlate well with the RXTE AGNs, 4 lie far from the galactic plane and have energies well above 100EeV. Thus for proton primaries, based on Fig. 1 these should originate at redshifts . For the broadline-AGN category the RXTE average source detection efficiency is then % based on Fig. 2. Thus for these AGASA events we expect correlations with the RXTE catalog of AGNs whereas we observe zero. Furthermore, the Poisson probably of then observing zero is small: 4.4%.
In contrast if the all-AGN category is the more appropriate source of super-GZK events, then the RXTE average source detection efficiency based on Fig. 2 is significantly less than 100%, particularly for source redshifts to . In this case, the all-AGN category the RXTE average source detection efficiency is estimated at %, resulting in an overall RXTE catalog efficiency of %. Thus we expect approximately correlations (with sources to ). The Poisson probability to observe correlation (one correlation was observed with the RXTE AGNs to ) is 11.6%666If we also include the 320EeV event from the Fly’s Eye [33] then we expect correlations (with RXTE AGNs to ) and we observe one. Now the Poisson probability to observe is 8.6%. Anecdotally the Fly’s Eye event is very close, , to one of the RXTE sources at RA Dec and redshift z=0.02. If this is a true correlation, then the proton nature of the cosmic ray and/or the measured energy of the cosmic ray are in question. However if the AGASA energies are overestimated (with respect to the energy scale of Fig. 1) then some of the AGASA events with energies closest to 100EeV could originate at redshifts . If we extend the possible RXTE AGNs to redshifts of then the RXTE average source detection efficiency decreases to % (because most of the lower X-ray luminosity AGNs are unobserved by RXTE) resulting in an overall RXTE catalog efficiency %. Thus we expect correlations and we observe two. The (new) additional correlation is between an AGASA event with EeV and a RXTE AGN at redshift . The Poisson probability to observe two correlations is %.
5 Summary
We have searched for correlations between the published list of the highest energy events from the AGASA experiment [4, 32] and the RXTE catalog of AGNs [26]. Two categories of RXTE AGNs were considered: all-AGNs with RXTE 3-20keV intrinsic luminosities, ergs/s, and broadline-AGNs with 2-8keV intrinsic luminosities, ergs/s motivated by the analysis of AGN evolution in Ref. [30]. To retain RXTE source detection efficiencies %, source redshifts of and were required for the all-AGN and broadline-AGN categories respectively.
No correlations were observed between the AGASA events and the broadline-AGN category of RXTE AGNs even though this category of AGN is most luminous in X-rays and even though the source density for this category of AGN is favored by some analyses [12, 13] of the highest energy cosmic rays.
In contrast, possible correlations were observed between AGASA events and the most inclusive, all-AGN, category of RXTE AGNs. We note that while not statistically conclusive, one of the nearby RXTE AGNs correlates with the AGASA/HiRes quartet event cluster [15] and one correlates with one of the AGASA super-GZK events [32].
Additional data would help confirm, or refute, the interesting possibility of highest energy cosmic ray–AGN correlations.
6 Acknowledgements
We wish to acknowledge useful communications with Francesc Ferrer on possible ultra-high energy cosmic rays : BL Lac correlations.
References
- [1] E. Waxman, K. B. Fisher and T. Piran, Astrophys. J. 483, 1 (1997) [astro-ph/9604005]
- [2] A. Cuoco, R. D’ Abrusco, G. Longo, G. Miele and P. D. Serpico, JCAP 0601 (2006) 009, [astro-ph/0510765]
- [3] K. Dolag, D. Grasso, V. Springel and I. Tkachev, JCAP 0501 (2005) 009, [astro-ph/0410419]
- [4] N. Hayashida et al., Astron. J. 120, 2190 (2000), [astro-ph/0008102]
- [5] P. G. Tinyakov and I. I. Tkachev, JETP Lett. 74, 1 (2001), [astro-ph/0102101]
- [6] P. G. Tinyakov and I. I. Tkachev, JETP Lett., 74, 445 (2001), [astro-ph/0102476]; Astropart. Phys., 18, 165 (2002), [astro-ph/0111305]
- [7] D. S. Gorbunov, P. G. Tinyakov, I. I. Tkachev and S. V. Troitsky, Astrophys. J. 577, L93 (2002)
- [8] D. S. Gorbunov, P. G. Tinyakov, I. I. Tkachev and S. V. Troitsky, JETP Lett., 80, 145 (2004) [astro-ph/0406654]
- [9] D. S. Gorbunov and S. V. Troitsky, Astropart. Phys. 23, 175 (2005) [astro-ph/0410741]
- [10] R. U. Abbasi et al., Astrophys.J. 636 680 (2006), [astro-ph/0507120]
- [11] S. L. Dubovsky, P. G. Tinyakov and I. I. Tkachev, Phys. Rev. Lett. 85 1154 (2000), [astro-ph/0001317]
- [12] P. Blasi and D. De Marco, Astropart. Phys. 20 559 (2004), [astro-ph/0307067]
- [13] M. Kachelriess and D. Semikoz, Astropart. Phys. 23 486 (2005) [astro-ph/0405258]
- [14] C. B. Finley and S. Westerhoff, Astropart. Phys. 21, 359 (2004) [astro-ph/0309159]
- [15] S. Westerhoff et al., Nucl. Phys. B (Proceedings Suppl.) 136C 46 (2004), [astro-ph/0408343]; R. U. Abbasi et al., Astrophys.J. 623 164 (2005), [astro-ph/0412617]; S. Westerhoff et al., Proc. 29th International Cosmic Ray Conference, 7 397 (2005), [astro-ph/0507574]
-
[16]
N. W. Evans, F. Ferrer and S. Sarkar, Phys. Rev. D67
103005 (2003) [astro-ph/0212533];
Phys. Rev. D69 128302 (2004) [astro-ph/0403527]
B. Stern and J. Poutanen, Astrophys.J. 623 L33 (2005) [astro-ph/0501677] - [17] G. Sigl, F. Miniati and T. E. Ensslin, [astro-ph/0409098]
- [18] K. Greisen, Phys. Rev. Lett. 16, 748 (1966); G. T. Zatsepin and V. A. Kuzmin, Pisma Zh. Eksp. Teor. Fiz. 4, 144 (1966)
- [19] P. G. Tinyakov and I. I. Tkachev, Astropart. Phys. 24 32 (2005), [astro-ph/0411669]
- [20] M. Kachelriess, P.D. Serpico and M. Teshima, [astro-ph/0510444]
- [21] G. A. Medina Tanco, E. M. de Gouveia Dal Pino and J. E. Horvath, [astro-ph/9707041]
- [22] M. Kachelriess and D. V. Semikoz, [astro-ph/0512498]
- [23] A. Smialkowski, M. Giller and W. Michalak, J. Phys. G28 1359 (2002), [astro-ph/0203337]
- [24] S. Singh, C-P. Ma, and J. Arons, Phys. Rev. D69 063003 (2004), [astro-ph/0308257]
- [25] V. Berezinsky, A.Z. Gazizov and S.I. Grigorieva, [hep-ph/0107306] and [hep-ph/0204357]
- [26] S. Yu. Sazonov and M. G. Revnivtsev, Astronomy & Astrophysics 423 469 (2004), [astro-ph/0402415]; M. Revnivtsev, S. Sazonov, E. Churazov and S. Trudolyubov, [astro-ph/0511444]
- [27] M. Revnivtsev, S. Sazonov, K. Jahoda and M. Gilfanov, Astronomy & Astrophysics 418, 927 (2004)
- [28] V. Berezinski, A. Gazizov and S. Grigorieva, [astro-ph/0302483]
- [29] A. T. Steffen et al., Astrophys. J. 596, L23 (2003) [astro-ph/0308238]
- [30] A. J. Barger et al., Astron. J. 129 578 (2005), [astro-ph/0410527]
- [31] G. R. Farrar, [astro-ph/0501388]
- [32] www-akeno.icrr.u-tokyo.ac.jp/AGASA/results.html#100EeV
- [33] D.J. Bird, et al, Astrophys. J. 441 144 (1995)