GRB 051028: an intrinsically faint GRB at high redshift?††thanks: Based on observations taken with the 1.34m Tautenburg telescope in Germany, with the 2.0m Himalayan Chandra Telescope in India and with the 4.2m William Herschel telescope at the Spanish Observatorio del Roque de los Muchachos in Canary Islands.
Abstract
Aims. We present multiwavelength observations of the gamma-ray burst GRB 051028 detected by HETE-2 in order to derive its afterglow emission parameters and to determine the reason for its optical faintness when compared to other events.
Methods. Observations were taken in the optical (2.0m Himalayan Chandra Telescope, 1.34m Tautenburg, 4.2m William Herschel Telescope) and in X-rays (Swift/XRT) between 2.7 hours and 10 days after the onset of the event.
Results. The data can be interpreted by collimated emission in a jet with a typical value of = 2.4 which is moving in an homogeneous interstellar medium and with a cooling frequency still above the X-rays at 0.5 days after the burst onset. GRB 051028 can be classified as a “gray” or “potentially dark” GRB. On the basis of the combined optical and Swift/XRT data, we conclude that the reason for the optical dimness is not extra absorption in the host galaxy, but rather the GRB taking place at high-redshift. We also notice the very striking similarity with the optical lightcurve of GRB 050730, a burst with a spectroscopic redshift of 3.967, although GRB 051028 is 3 mag fainter. We suggest that the bumps could be explained by multiple energy injection episodes and that the burst is intrinsically faint when compared to the average afterglows detected since 1997. The non-detection of the host galaxy down to = 25.1 is also consistent with the burst arising at high redshift, compatible with the published pseudo- of 3.7 1.8.
Key Words.:
gamma rays: bursts – techniques: photometric – cosmology: observations1 Introduction
The question whether a significant fraction of gamma ray bursts (GRBs) are intrinsically faint or true dark events remains unsolved (see Filliatre et al. 2005, Castro-Tirado et al. 2006 and references therein). For instance, GRB 000418 was detected in the near-IR (Klose et al. 2000) and it is one of the reddest (R-K = 4) together with GRB 980329 (Reichart et al. 1999), GRB 030115 (Levan et al. 2006) and the recent GRB 050915A (Bloom & Alatalo 2005). In most cases, it has been suggested that the cause of the reddening was dust extinction in the host galaxy. On the other hand, GRB 021211 was found to be very dim at 24 hours, as a scaled-down version of GRB 990123 (Pandey et al. 2003).
With the launch of Swift in Nov 2004, which has the ability to follow-up the events detected by the GRB detector onboard (BAT) or by other satellites like HETE-2 and INTEGRAL, it is possible to zoom in on this population of optically faint events in order to disentangle their nature.
GRB 051028 was one of such event. It was discovered by HETE-2 on 28 Oct 2005, lying (90% confidence) on a 33′ 18′error box centred at coordinates: RA (J2000) = 01h48m386 Dec (J2000) = +47°48′300 (Hurley et al. 2005). The burst started at T0 = 13:36:01.47 UT and a value of T90 = 16 s is derived, putting it in the “long-duration” class of GRBs. It had a fluence of 6 erg cm-2 in the 2-30 keV range and 6 erg cm-2 in the 30-400 keV range (Hurley et al. 2005). This event was also detected by Konus/WIND in the 20 keV - 2 MeV range, with a duration of s, a fluence of (6.78) erg cm-2 in the 20 keV - 2 MeV range and a peak energy Ep = 298 keV (Golenetskii et al. 2005). Swift/XRT started to observe the field 7.1 hours after the event and detected the X-ray afterglow 5.2′ away from the center of the initial error box (Racusin et al. 2005).
We report here results of multi-wavelength observations in optical and X-ray waveband and discuss the reasons for the apparent optical faintness of GRB 051028 in comparison with other bursts.
| Date of 2005 UT | Telescope/ | Filter | Exposure Time | Magnitude |
|---|---|---|---|---|
| (mid exposure) | Instrument | (seconds) | ||
| Oct 28, 16:18 | 2.0 HCT (HFOSC) | 300 | 20.630.04 | |
| Oct 28, 16:32 | 2.0 HCT (HFOSC) | 300 | 20.720.05 | |
| Oct 28, 16:47 | 2.0 HCT (HFOSC) | 300 | 21.140.07 | |
| Oct 28, 17:03 | 2.0 HCT (HFOSC) | 300 | 21.270.07 | |
| Oct 28, 17:43 | 1.34 Taut (CCD) | 1 080 | 21.230.13 | |
| Oct 28, 17:47 | 2.0 HCT (HFOSC) | 300 | 21.170.08 | |
| Oct 28, 21:42 | 4.2 WHT (PFC) | 300 | 21.970.05 | |
| Oct 29, 05:47 | 4.2 WHT (PFC) | 120 | 22.80.3 | |
| Oct 29, 20:15 | 4.2 WHT (PFC) | 720 | 23.7 | |
| Oct 31, 22:14 | 4.2 WHT (PFC) | 2 700 | 25.1 | |
| Oct 28, 16:25 | 2.0 HCT (HFOSC) | 300 | 19.790.11 | |
| Oct 28, 16:39 | 2.0 HCT (HFOSC) | 300 | 19.940.06 | |
| Oct 28, 16:55 | 2.0 HCT (HFOSC) | 300 | 20.290.09 | |
| Oct 28, 17:09 | 1.34 Taut (CCD) | 1 080 | 20.5 0.3 | |
| Oct 28, 17:10 | 2.0 HCT (HFOSC) | 300 | 20.380.08 | |
| Oct 28, 17:55 | 2.0 HCT (HFOSC) | 300 | 20.350.09 | |
| Oct 28, 19:12 | 1.34 Taut (CCD) | 1 800 | 20.670.23 | |
| Oct 28, 20:33 | 1.34 Taut (CCD) | 3 600 | 20.750.13 | |
| Oct 28, 22:50 | 1.34 Taut (CCD) | 5 400 | 21.160.16 | |
| Oct 28, 18:28 | 1.34 Taut (CCD) | 1 080 | 22.080.20 |
2 Observations and data reduction
2.1 X-ray observations
We availed ourselves of the public X-ray observations from Swift/XRT which consists of four observations starting 7.1, 120, 150 and 230 hours after the event respectively. The detection in the first observation is significant (signal-to-noise ratio S/N13.5), but in later observations the X-ray afterglow is weaker and it is detected with a signal-to-noise of 3.3, 2.9 and 2.7.
The XRT data is in photon counting mode and were reduced using the standard pipeline for XRT data using Swift software version 2.2111http://swift.gsfc.nasa.gov /docs/software/lheasoft/download.html and using the most recent calibration files. The data were analysed with the XSPEC version 11.3 (Arnaud 1996). Source and background regions were extracted using a circular aperture. Spectra were selected to have at least 20 counts/bin.
2.2 Optical observations
Target of Opportunity (ToO) observations in the optical were triggered starting 2.7 hours after the event at the 2.0 m Himalayan Chandra Telescope (HCT) at Indian Astronomical Observatory (HCO). 10′ 10′ frames were taken in imaging mode with the Himalaya Faint Object Spectrograph (HFOSC), covering only the central part of the large (33′ 18′) HETE-2 error box. Additional observations were conducted at the 1.34m Schmidt telescope in Tautenburg (providing a 42′ 42′ FOV and thus covering the large error box) and at the 4.2 m William Herschel Telescope (WHT + Prime Focus Camera) at Observatorio del Roque de los Muchachos in La Palma (Spain). A mosaic of 2 images (15′ 15′ FOV) were taken in order to cover the entire HETE-2 error box. Subsequently, follow-up observations were taken on the following days at the 4.2 m WHT. Table LABEL:tabla1 displays the observing log. The optical field was calibrated using the calibration files provided by Henden (2005).
3 Results and discussion
3.1 The X-ray afterglow
The X-ray data confirm the presence of a decaying X-ray source in the fraction (70 %) of the HETE-2 error box covered by the Swift/XRT, as previously reported by Racusin et al. (2005). The X-ray position is RA(J2000) = 01h48m151, Dec(J2000) = +47°45′129 (lII = 132.72, bII = -14.03), with an estimated uncertainty of 38 (90% containment, Page et al 2005).
The X-ray light curve in the energy range 0.3 to 10 keV is shown in Fig. 1. The early X-ray light curve (2 to 5 s) can be fit by a power-law decay with exponent = 1.43 with a /d.o.f = 9.3/10. The data were also fit including the late time data up to 10 days (8.6105 s) and resulted in a exponent = 1.1 with /d.o.f = 10.7/13) compatible with the power-law index obtained considering only the early observations. The value of is dominated by the late time data and a break or flattening of the light curve at intervening times is possible and cannot be excluded by the observations.
A spectrum was extracted for the first observation starting at 7.1 hours consisting of 5 Swift orbits. The X-ray spectrum was fit by an absorbed power-law with photon index =2.3 with a column density NH = 0.40 1022 cm-2 (with /d.o.f = 9.1/9) (Fig. 2). The galactic column density, NH,GAL, was estimated to be 1.2cm-2 using the weighted average of 6 points within 1°of the source location 222http://heasarc.gsfc.nasa.gov/cgi-bin/Tools/w3nh/w3nh.pl (Dickey and Lockman 1990). The values used to estimate NH,GAL range from 1.011021cm-2 to 1.331021cm-2. The fitted spectrum is compatible at 90% confidence level with Galactic absorption of 1.21021cm-2 (Fig. 3). A power-law index of = 1.7 0.2 (/d.o.f = 12.8/10) (i.e. a spectral X-ray index = 0.7 0.2 with ) ) is obtained if only Galactic absorption NH,GAL of 1.2cm-2 is considered in agreement with Page et al. (2005). Alternatively, if we assume that all of the extra absorption originates in the host galaxy and freeze the NH,GAL at 1.2cm-2 then the intrinsic absorption in the host at the pseudo-z (see below) of =3.7 is NH,z=3.7 of 12.2cm-2.

3.2 The optical afterglow
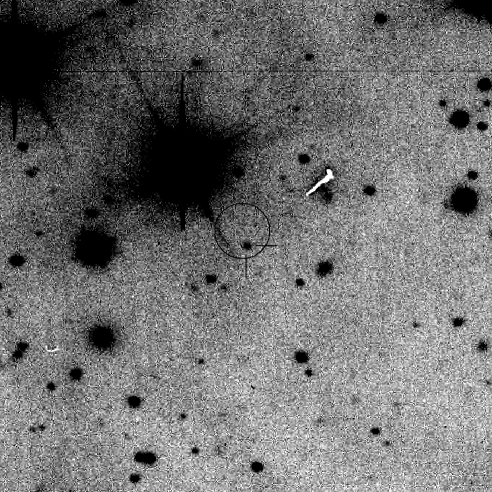
The optical counterpart was discovered on our -band images taken at the 4.2m WHT telescope starting 7.5 hours after the onset of the gamma-ray event. A faint = 21.9 object was detected inside the Swift/XRT error circle (Jelínek et al. 2005, Pandey et al. 2005). Astrometry against USNO-B yielded the coordinates: RA(J2000) = 01h48m1500, Dec(J2000) = +47°45′094, with 02 uncertainty (1, see Fig. 4).
With E(B-V) = 0.21 in the line of sight (Schlegel et al. 1998), AV = 0.71 is derived (which translates into AV = 0.6 if the correction factor proposed by Dutra et al. (2003) is taken into account). A value of AV = 0.7 is obtained using the fit from Predehl and Schmitt (1995) for the Galactic H column. We choose AV 0.7 for the rest of this paper, which implies AR = 0.53 and AI = 0.37.
From the analysis of the full dataset available obtained at Hanle, Tautenburg and La Palma, we have obtained the optical afterglow lightcurve plotted in Fig. 5. The data between T0 + 4 hours and T0 + 15 hours can be fitted by a shallow power-law decline with decay index = 0.9 0.1. The upper limits obtained at 1.5 and 3.5 day (23.7 and 25.1 respectively) may suggest the existence of a break in the lightcurve after 1 day.
The data prior to 4 hours (i.e. in the range T0 + 2.7 hours and T0 + 4 hours) show a bumpy behaviour very similar to the one seen in other events like GRB 021004 (de Ugarte Postigo et al. 2005), GRB 030329 (Guziy et al. 2006 and references therein) and GRB 050730 (Pandey et al. 2006). In fact, the similarity with GRB 050730 is very remarkable, if GRB 051028 is shifted up by 3 magnitudes (Fig. 6). There is evidence for at least two of such bumps taking place, superimposed on the power-law decline. This could be explained in the framework of multiple energy injection episodes (Björnsson, Gudmundsson & Jóhannesson 2004). GRB 050730 is an optically bright afterglow (see Fig. 12 of Nardini et al. 2005) whereas GRB 051028 seems an optically faint event if at redshift 3-4. Unfortunately there is no X-ray data available at this epoch to allow a more complete modelling being carried out.


3.3 A high redshift event
We have extrapolated the optical and X-ray fluxes of the GRB 051028 afterglow to T0 + 11 hours and derived a value of = 0.55 0.05. Thus GRB 051028 is located in the “gray” or “potentially dark” GRB locus on the dark GRB diagram by Jakobsson et al. (2004). How can the optical faintness of GRB 051028 be explained ?
Although the redshift of this event could not be properly measured due to its faintness at the time of the discovery, we are able to constrain it on the basis of the -band data presented in this paper. Using the magnitudes derived here and correcting them for the Galactic extinction in the line of sight, we determine a spectral optical index = 2.1 0.4. In the simplest fireball models (Sari et al. 1998), Fν with = /2 for and = (-1)/2 for . Thus, for a typical range of values in the range 1.5 3 (Zeh, Klose & Kann 2006), should be in the range 1.5 0.25. In fact, the GRB 051028 X-ray data before T0 + 0.5 day are well fitted by a jet model with = 2.4 in the slow cooling case, moving through the ISM (with = constant) prior to the jet break time and with a cooling frequency still above the X-rays. A value of = 1.7 is favoured (as = 2.3 is giving high, unrealistic values of ) and thus we can consider that all the absorption is Galactic in origin (and ruling out dust along the line of sight in the host galaxy). The X-ray data (both values of ) are also eventually fitted for a value of = 2.1 if would have already crossed the X-ray band at that time (0.5 d), as it seems to be derived from a sample of events studied by BeppoSAX (Piro et al. 2005), but this is unlikely in the light of the recent Swift/XRT results for a sample of (presumably higher-) events (Panaitescu et al. 2006). In any of the above mentioned cases, the observed value of can be reproduced and therefore should be 0.7. What is the reason for the discrepancy in the observed and expected values of ?
Fig. 7 shows the derived when using only magnitudes for a sample of bursts in the range 3.3 4.5 . As can be seen the derived values are in the range of the one found for GRB 051028, well above the = 1.5 value mentioned previously. This is naturally explained by the fact that at 3.2 and 4.0, the Lyman- break begins affecting the and passbands respectively. Therefore, one natural explanation for the value found for GRB 051028 is that it also arose at a 34, a value to be compared with that of GRB 050730 ( = 3.967), a burst which has a suprisingly similar optical afterglow lightcurve, as we have shown in Section 3.2. This 34 value is in fact in agreement with the pseudo- = 3.7 1.8 derived for this burst using the recent pseudo- estimator developed by Pélangeon et al. (2006) on the basis of the observed peak energy and the bolometric luminosity in the 15 sec long interval containing the highest fluence. This would be in agreement with the fact that no host galaxy is detected down to = 25.1. This high-redshift is also supported by the late break time, as typical afterglows undergo a jet break episode before T0 + 1 day in the rest frame (Zeh, Klose & Kann 2006). In fact, the Ghirlanda et al. (2004) Ep Eγ relation is satisfied for GRB 051028 when considering the pseudo- = 3.7.
The fact that the afterglow of GRB 051028 is not unusual in the Swift/XRT sample may indicate that the density of the surrounding medium where the progenitor has taken place should be closer to the the typical value of 1 cm-3 derived for several long-duration GRBs. So a low density environment is not the reason for its faintness at optical wavelengths. It could be that GRB 051028 could be an underluminous GRB similar to GRB 980613, GRB 011121 and GRB 021211 (see Nardini et al. and references therein), in contrast to GRB 050730.

4 Conclusions
We have presented multiwavelength observations of the long duration GRB 051028 detected by HETE-2 between 2.7 hours and 10 days after the event. The X-ray afterglow of GRB 051028 can be compared to other GRB afterglows in the sense that its flux at 11 hours is typical, i.e., one can assume that the burst has occurred on a classical n 1 cm-3 environment. The optical afterglow, on the other hand, is dim at a similar epoch (and comparable for instance to GRB 030227, Castro-Tirado et al. 2003). We also noticed the remarkable similarity to the optical afterglow of GRB 050730, a burst lasting 10 times longer with comparable gamma-ray fluence333The scarcity of the available X-ray data for GRB 051028 does not allow to make a straigth comparison with respect to the GRB 050730 X-ray afterglow. at = 3.967 (see Pandey et al. 2006 and references therein). This indicates that the faintness of the optical emission is not due to a low-density environment as in the case of some short GRBs, such as GRB 050509b (Castro-Tirado et al. 2005). Instead, we propose that GRB 051028 occurred in a faint galaxy (with 25.1) at a high redshift consistent with the pseudo- = 3.7 1.8.
Thanks to the extraordinary repointing capabilities of Swift, the accurate localisations for future events and the corresponding multiwavelength follow-up will shed more light on the origin of this faint optical afterglow population.
Acknowledgements.
We thank the anonymous referee for useful suggestions. This research has made use of data obtained through the High Energy Astrophysics Science Archive Research Center On line Service, provided by the NASA/Goddard Space Flight Center. Publically available Swift/XRT data are also acknowledged. P.F., D.A.K. and S.K. thanks financial support by DFG grant Kl 766/13-2. This research has also been partially supported by the Ministerio de Ciencia y Tecnología under the programmes AYA2004-01515 and ESP2002-04124-C03-01 (including FEDER funds).References
- (1) Arnaud K. A., 1996, ASP Conf. Ser., 101, 17
- (2) Bloom, J. S. & Alatalo, K. 2005, GCN Circ. 3984
- (3) Björnsson, G., Gudmundsson, E. H., & Jóhannesson, G. 2004, ApJ 715, L77
- (4) Castro-Tirado, A. J., Gorosabel, J., Guziy, S. et al. 2003, A&A 411, 315
- (5) Castro-Tirado, A. J., de Ugarte Postigo, A., Gorosabel, J. et al. 2005, A&A 439, L15
- (6) Castro-Tirado, A. J., Bremer, M., McBreen, S. et al. 2006, A&A, submitted
- (7) Dickey, J. M., & Lockman, F. J., 1990, ARA&A, 28, 215
- (8) Dutra, C. M., Ahumada, A. V., Clariá, J. J., Bica, E. & Barbuy, B. 2003, A&A 408, 287
- (9) Filliatre, P., D´Avanzo, P., Covino, S. et al 2005, A&A, 438, 793
- (10) Ghirlanda, G., Ghisellini, G. & Lazzati, D. 2004, A&A, 616, 331
- (11) Golenetskii, S., Aptekar, R. Mazets, E. et al. 2005, GCN Circ. 4183
- (12) Guziy, S. et al. 2006, in preparation
- (13) Henden, A. A. 2005, GCN Circ. 4184
- (14) Jakobsson, P., Hjorth, J., Fynbo, J. P. U. et al. 2004, ApJ 617, L21
- (15) Klose, S., Stecklum, B., Masetti, N. et al. 2000, ApJ 545, 271
- (16) Hurley, K., Ricker, G., Atteia, J-L. et al. 2005, GCN Circ. 4172
- (17) Jelinek, M., Pandey, S. B., Guziy, S. S. et al. 2005, GCN Circ. 4175
- (18) Levan, A., Fruchter, A., Rhoads, J. et al. 2006, ApJ, in press
- (19) Nardini, M., Ghisellini, G., Ghirlanda, G., Tavecchio, F., Firmani, C. & Lazzati, D. 2006, A&A 451, 821
- (20) Page, K. L., Goad, M. R., Burrows, D. N. et al. 2005, GCN Circ. 4205
- (21) Panaitescu, A., Mészáros, P., Burrows, D. et al. 2006, MNRAS 369, 2059
- (22) Pandey, S. B., Anupama, C. G., Sagar, R. et al. 2003, A&A 408, L21
- (23) Pandey, S. B., Jelinek, M., Guziy, S. S. et al. 2005, GCN Circ. 4176
- (24) Pandey, S. B., Castro-Tirado, A. J., McBreen, S. et al. 2006, A&A, in press (astro-ph/0607471)
- (25) Pélangeon, A., Atteia, J.-L., Lamb, D. Q. et al. 2006, in: Gamma-ray bursts in the Swift Era, ed. S. S. Holt, N. Gehrels and J. A. Nousek (New York), AIP Conf. Proc. 836, 149
- (26) Piro, L. 2005, Nuovo Cimento 28C, 473
- (27) Predhel, P. & Schmitt, J.H.M.M. 1995, A&A 293, 889
- (28) Racusin, J., Page, K., Kennea, J. et al. 2005, GCN Circ. 4174
- (29) Reichart, D. E., Lamb, D. Q., Metzger, M. E. et al. 1999, ApJ 517, 692
- (30) Sari, R., Piran, T. & Narayam R. 1998, ApJ 497, L17
- (31) Schlegel, D. J., Finkbeiner, D. P., & Davis, M. 1998, ApJ, 500, 525
- (32) de Ugarte Postigo, A., Castro-Tirado, A. J., Gorosabel, J. et al. 2005, A&A 443, 841
- (33) Zeh, A., Klose, S. & Kann, D. A. 2006, ApJ 637, 889