∎
22email: oyk100@psu.edu 33institutetext: G. Pavlov 44institutetext: Pennsylvania State University 525 Davey Lab, University Park, PA 16802
44email: pavlov@astro.psu.edu
UV emission from young and middle-aged pulsars
Abstract
We present the UV spectroscopy and timing of three nearby pulsars (Vela, B0656+14 and Geminga) recently observed with the Space Telescope Imaging Spectrograph. We also review the optical and X-ray properties of these pulsars and establish their connection with the UV properties. We show that the multiwavelengths properties of neutron stars (NSs) vary significantly within the sample of middle-aged pulsars. Even larger differences are found between the thermal components of Ge-minga and B0656+14 as compared to those of radio-quiet isolated NSs. These differences could be attributed to different properties of the NS surface layers.
Keywords:
Neutron Stars Pulsars Geminga PSR B0656+14 Vela pulsar RX J1856.5–3754 RX J0720.4–3125 RX J1308.6+2127pacs:
97.60.Gb 97.60.Jd1 Introduction
Optical through X-rays radiation from a typical isolated neutron star (NS) is expected to exhibit two components: thermal radiation from the NS surface and non-thermal radiation from the NS magnetosphere. The spectrum of non-thermal radiation can be described by a power-law (PL) model with a spectral index (). This radiation is commonly interpreted as synchrotron emission from relativistic electrons/positrons accelerated by the electric fields near the NS surface and from secondary particles produced in the pair cascades. The magnetospheric radiation is intrinsically anisotropic and, therefore, it shows strong pulsations. The non-thermal emission completely dominates the multiwavelength spectrum in very young pulsars (e.g., Crab and B0540–69).
As the magnetospheric emission becomes fainter with increasing pulsar age, thermal emission becomes detect-able at kyrs, being seen as a “thermal hump” on top of the flat non-thermal spectrum. This thermal radiation is emitted from the NS surface which can be non-uniformly heated (e.g., due to anisotropic heat conductivity of the crust and bombardment by relativistic particles). Indeed, in several cases at least two thermal components with different temperatures are need-ed to fit the X-ray spectrum (e.g., Pavlov et al. 2002; Zavlin & Pavlov 2004a; De Luca et al. 2005). The cooler thermal soft (TS) component is commonly interpreted as emission from the bulk of the NS surface. The hotter thermal hard (TH) component is often attributed to the NS polar caps (PCs) which can be additionally heated by the magnetospheric particles. As expected, the TS temperatures generally decrease with pulsar age. However, they do not fall onto a monotonically decreasing cooling curve, which suggests that NSs may have different masses (e.g., Yakovlev & Pethick 2004). In X-rays, the TS component usually shows weaker and broader pulsations than the TH component. The TS pulsations can be caused by non-uniformities of the NS surface temperature and by anisotropy of local emissivity in the strong magnetic field.
Spectra of middle-aged pulsars ( kyr) are particulary interesting because they often exhibit all the three emission components. The nearby middle-aged pulsars, Vela ( kyrs), B0656+14 (hereafter B0656; kyrs) and Geminga ( kyrs), are relatively bright and have been extensively studied in both the optical and X-rays. Given their different ages, the three pulsars provide a representative cut through the population of middle-aged pulsars, allowing one to study the evolution of the pulsar properties.
| Name | Dist. | B | ||||
|---|---|---|---|---|---|---|
| kyr | s | ergs s-1 | TG | m | ||
| Geminga | 340 | 0.24 | 34.52 | 1.6 | 440 | |
| B0656+14 | 110 | 0.38 | 34.58 | 4.7 | 346 | |
| Vela | 11 | 0.09 | 36.84 | 3.8 | 717 | |
| RX J0720 | 1900 | 8.4 | 30.67 | 24 | 7 | |
| RX J1308 | 1500 | 10.3 | 30.60 | 34 | 7 | |
| RX J1856 | 400 | … | … | … | … |
The X-ray spectra of these three pulsars can be described by a three-component, TS+TH+PL, model, with the thermal components modeled as BBs. However, such fits result in substantially different model parameters in each case.
The youngest Vela pulsar shows the highest MK emitted from a region with km. This is substantially smaller than a typical NS radius, which might indicate that a large fraction of the NS surface is too cold to be seen in X-rays111 Alternatively, it may mean that the BB description of the thermal spectrum is inadequate, and a more realistic atmosphere model should be used. For instance, the Vela pulsar spectrum fits equally well by a two-component, NS atmosphere plus PL, model, which gives MK at km (Pavlov et al. 2001; see also Kargaltsev 2004).. A factor of ten older B0656 has a lower temperature, MK, and a much larger emitting area, km, close to that of a typical NS. The oldest of the three pulsars, Geminga, is even colder, MK, and has the largest emitting area ( km).
The PL component, with , is the strongest in the Vela pulsar, erg s-1 (in 0.210 keV), becoming weaker in B0656 (; erg s-1), and much weaker in Geminga (; erg s-1). This PL component is typically interpreted as synchrotron emission produced by relativistic particles in the pulsar margentosphere.
The strength of the TH component also appears to decrease with pulsar age. Being relatively strong in the Vela pulsar ( erg s-1), it becomes weaker in B0656 ( erg s-1) and decreases dramatically in Geminga ( erg s-1). The sizes of the TH emission regions are close to the conventional PC radii [; see Table 1] in Vela and B0656, while in Geminga, m, is surprisingly small when compared to its m. This may suggest that the surface of Geminga is more uniformly heated and the “TH component” simply mimics a phase-dependent PL component222From a phase-resolved analysis of the XMM data, Jackson & Halpern (2005) conclude that the X-ray spectrum of Geminga can be alternatively described by a BB+PL model with a phase-dependent PL slope.. However, regardless of the exact nature of the TH and PL components, the soft X-ray (0.32 keV) spectra of these three pulsars are clearly dominated by the thermal emission.
Observing the TS radiation over a wide range of frequencies is particulary important. X-ray observations can only probe the Wein tail of the TS spectrum emitted from the NS surface. This information is insufficient to reconstruct the overall shape of the spectrum which can deviate from the simple black-body due to the presence of an atmosphere or nonuniformity of surface temperature. Chemical composition of the atmosphere can dramatically affect the X-ray spectrum (Romani 1987; Pavlov et al. 1995; Zavlin, Pavlov & Shibanov 1996; Zavlin & Pavlov 2002), with light element atmospheres leading to a large Wien excess. Any surface temperature inhomogeneities will also complicate the spectrum, with hotter regions being increasingly important at higher frequencies. For these reasons, comparison of thermal X-ray emission with optical-UV emission on the Rayleigh-Jeans (R-J) side of the thermal hump is particularly valuable. The challenge here is that the non-thermal magnetospheric emission becomes increasingly dominant at longer wavelengths.
The observations with ground-based telescopes and the Hubble Space Telescope (HST) have provided multi-band photometry from near-IR (NIR) to near-UV (NUV) and showed that the NIR-optical spectra of the three pulsars are non-thermal, with a hint of a R-J component seen in Geminga and B0656+14 at Å. The observations in UBVRIHJ filters show that the optical spectrum of the Vela pulsar remains very flat from NIR to UV, with (Shibanov et al. 2003). For the other two pulsars, the NIR-optical spectra are steeper, (Koptsevich et al. 2001; Shibanov et al. 2006).
For all the three pulsars optical pulse profile measurements have been carried out. The Vela and B0656, show strong non-sinusoidal pulsations (Gouiffés 1997; Kern et al. 2003). Optical pulsations of Geminga were only marginally detected in the B band (Shearer et al. 1998).
Despite the extensive coverage in the optical and X-rays, very few NUV observations had been carried out until recently, and the FUV parts of the spectra have remained completely unexplored. To fill this gap, we have undertaken an observational campaign with the MAMA-NUV and MAMA-FUV detectors of the Space Telescope Imaging Spectrograph (STIS) aboard the HST.
2 Observations with STIS in far- and near-UV
We have observed all the there pulsars in the NUV (1800–3000 Å) and FUV (11501700 Å) passbands (see Table 2). The data reduction and analysis are described in detail by Kargaltsev et al. (2005), Romani et al. (2005), and Kargaltsev & Pavlov (2006). Here we summarize the main results of these observations.
2.1 Geminga
In the FUV passband we obtained a low-resolution spectrum of Geminga using MAMA-FUV with the grating G140L. The observed flux in the 1155–1702 Å range is ergs s-1 cm-2, corresponding to the luminosity ergs s-1. Fitting the spectrum with the absorbed PL model gives for . The PL slope is close to that of the R-J spectrum, , suggesting that the observed radiation is dominated by thermal emission from the NS surface. To estimate the NS surface temperature, we fit the absorbed BB model to the spectrum. Since the FUV frequencies are in the R-J part of the spectrum, the temperature values are strongly correlated with the radius-to-distance ratio (approximately, ). For a typical NS radius, km, and the assumed distance pc, the inferred temperatures are and MK, for and 0.07, respectively.
The Geminga pulsar was imaged with MAMA-NUV using the broad-band filter F25SRF2. The NUV flux depends on the assumed spectral slope and extinction. For a plausible E(BV)=0.03 and , the unabsorbed NUV flux is ergs cm-2 s-1 in 18003000 Å.
We used the 125 s time resolution of STIS for timing analysis of both NUV and FUV data. We found statistically significant pulsations with frequencies lying within (0.3,+0.7) Hz around the frequency estimated from multi-epoch timing observations in -rays and X-rays (Jackson et al. 2002). The folded (source plus background) NUV light curve, plotted in Figure 2, shows one broad (FWHM of the period), flat-top peak per period, centered at the phase . The most notable feature of the pulse profile is the narrow dip at . The pulsed fraction, defined as the ratio of the number of counts above the minimum level to the total number of counts in the light curve, is about 28%, which corresponds to the intrinsic source pulsed fraction .
The FUV light curve, plotted in the same Figure 2, also shows a sharp, asymmetric dip at with an additional shallower dip at . The pulsed fraction in the observed (source + background) radiation is about 40% (intrinsic pulsed fraction 60%–70%.).
2.2 B0656+14
The FUV spectrum of B0656 has been measured with MAMA-FUV using the G140L grating. Unfortunately, only two of the eight planned orbits of data were collected because of the STIS failure on August 3, 2004. The observed flux in the 1153–1700 Å band is ergs s-1 cm-2, corresponding to ergs s-1. The fit with the absorbed PL model results in a rather steep spectral slope for a plausible . Similar to Geminga, this suggests that the FUV radiation could be dominated by thermal emission from the NS surface. The absorbed BB fit gives the surface temperature of MK for , km, and the distance of pc (Brisken et al. 2003). The corresponding unabsorbed bolometric luminosity is ergs s-1. Thus, the measured brightness temperature is substantially higher than that of Geminga.
The NUV spectrum and light curve of B0656 have been obtained using MAMA-NUV with PRISM (Shibanov et al. 2005). We re-analyzed these data to facilitate the direct comparison with the FUV and other multiwavelength data. The observed flux in the 1790–2950 Å range is erg s-1 cm-2, corresponding to erg s-1. Fitting the spectrum with the absorbed PL model, we find for a plausible . The PL slope is somewhat flatter than that of the FUV spectrum, which can be explained by a larger contribution of the non-thermal component.
Making use of the event time-tags, we created FUV and NUV pulse profiles folded with the radio ephemeris provided by M. Kramer (2005; priv. comm.). The FUV pulse profile (Fig. 2) shows two peaks of approximately equal strengths. The minimum at is shallower than the other minimum at . The observed pulsed fraction, , corresponds to the intrinsic puls-ed fraction of %. We also folded the light curves for each of the NUV visits and co-added them into the combined NUV pulse profile (Fig. 2). The NUV pulse shape resembles the FUV one but shows a higher pulsed fraction (the observed and intrinsic pulsed fractions are 22% and 80%, respectively). The lower pulsed fraction in FUV is evidence of a larger contribution of thermal emission at the FUV wavelengths (thermal emission is intrinsically less pulsed than the non-thermal emission). The NUV and FUV light curves can be interpreted as two non-thermal peaks on top of a single low-amplitude thermal pulse with the maximum at . This interpretation would imply a substantially softer spectrum at the pulse minima than at the peaks.
To verify this assumption, we produced the phase-resolved NUV through FUV spectrum for three phase intervals , , and , corresponding to each of the two peaks and two minima combined. The difference in the slopes of the PL model fitted to the peaks spectra does not exceed the spectral index uncertainties. However, the spectrum at the pulse minima is substantially steeper () than the peak spectra (). This behavior is in line with the expected larger contribution of thermal emission at the minima phases.
2.3 Vela pulsar
The spectroscopic (FUV) and imaging (NUV) data has been acquired using exactly the same instrumental setup as in the Geminga observations (see Table 1) and reduced in a similar way.
For a plausible PL slope, (see §3.3) and color index (estimated from the hydrogen column density found from the X-ray fits; Sanwal et al. 2002), the unabsorbed NUV flux is ergs cm-2 s-1 in 18003000 Å.
The FUV spectrum of the Vela pulsar is significantly flatter than those of Geminga and B0656, which reflects its predominantly non-thermal nature even throughout the FUV passband. The total observed flux in the 1153–1701 Å range is ergs s-1 cm-2, corresponding to ergs s-1 at pc (Dodson et al. 2003). Fitting the spectrum with the absorbed power-law model, we found at .
Figure 2 shows the NUV and FUV light curves folded with appropriate radio ephemeris (courtesy of R. N. Man-chester). At least four narrow peaks can be identified in each of the light curves. The higher signal-to-noise (S/N) NUV light curve shows some substructure in the two main peaks. The observed (source plus background) pulsed fractions are and for the FUV and NUV light curves, respectively. The corresponding intrinsic pulse fractions are 73% and 87%.
3 Multiwavelength spectra and light curves
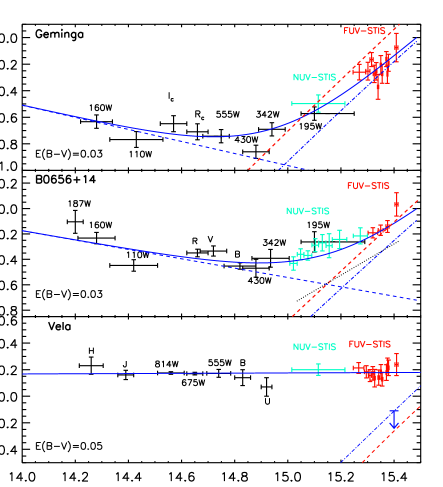
To compare the UV emission with the NIR, optical and X-ray emission, we plotted multiwavelength spectra of the three pulsars in Figure 1 (NIR to FUV) and Figure 3 (NIR to X-rays). The FUV, NUV and X-ray light curves are shown in Figure 2. Below we briefly discuss the multiwavelength properties for each of the pulsars.
3.1 Geminga
The top panel of Figure 1 shows the UV fluxes together with the multi-band NIR-optical photometry adopted from Kargaltsev et al. (2005) and Shibanov et al. (2006).
As the NIR through FUV spectrum cannot be described by a simple PL model, we fit this spectrum with a BB+PL model. For the fixed , we obtain MK, , for , where and are the parameters of the PL component: . Notice that the parameters of the BB component are virtually the same as obtained from the FUV-MAMA spectrum alone. We see that the BB emission dominates at Å, while the magnetospheric PL emission dominates at longer wavelengths.
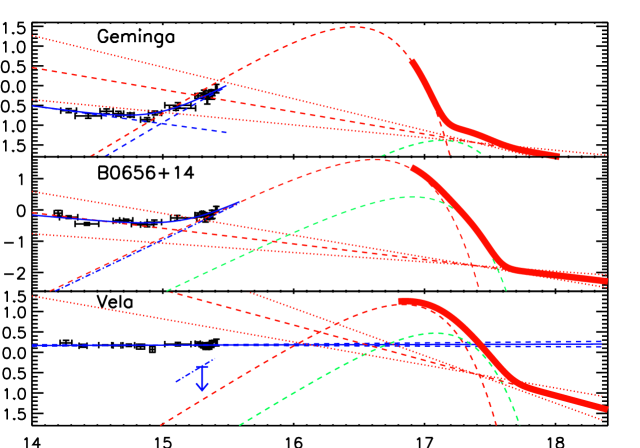
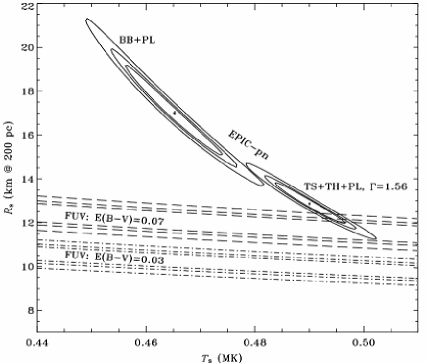
To investigate the connection between the optical/UV and X-ray properties, we use the data obtained with XMM-Newton. The X-ray spectrum can be reasonably well described by a three-component TS+TH+PL model (see §1 and Kargaltsev et al. 2005 for details), shown in the top panel of Figure 3. One can see that the extrapolation of the TS component overpredicts the FUV fluxes by a factor of 1.6 [for ; see also Fig. 1]. This FUV deficit can also be demonstrated by plotting together the temperature-radius confidence contours for the TS component and for the BB fit to the FUV-MAMA spectrum (Fig. 4). We see that at plausible values of interstellar extinction, , the FUV contours lie at smaller radii (or much lower temperatures) than the X-ray contours, in contrast to some other neutron stars (see §4.2). The extrapolation of the X-ray PL component suffers from large uncertainties and is marginally consistent with the optical fluxes.
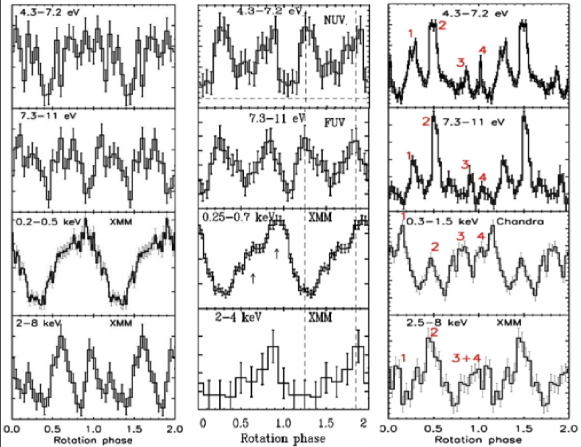
The background-subtracted X-ray light curves are compared with the UV and optical light curves in Figure 2. In the 0.2–0.5 and 2–8 kev bands, the radiation is dominated by the TS and PL components, respectively The PL light curve (pulsed fraction ) shows two pronounced peaks per period, resembling the -ray light curve (Jackson et al. 2002), albeit with a smaller distance between the peaks, and a hint of a third peak, at . On the contrary, the 0.2–0.5 keV light curve () is characterized by one broad peak per period (with small “ripples”, perhaps due to contribution from the PL and TH components). The minimum of the TS light curve is approximately aligned in phase with one of the minima of the PL light curve, being shifted by from the sharp dips of the NUV and FUV light curves.
As the thermal soft emission dominates the spectrum from 4 eV to 1 keV, the non-thermal pulsations can only be observed in the optical or hard X-rays. The double-peaked shape of the hard X-ray (2–8 keV) pulsations does not correlate with the TS pulsations. The optical pulsations, marginally detected in the B band (Shearer et al. 1998), also show a double-peaked structure, with a larger separation between the peaks ( in the optical vs. in the hard X-rays). The phases of the optical peaks differ from those of the hard X-ray peaks. To understand and resolve these apparent inconsistencies, a higher quality optical light curve should be obtained.
3.2 B0656+14
Similar to Geminga, we fit the NIR through FUV spectrum of B0656 (middle panel in Fig. 1; NIR and optical data are from Koptsevich et al. 2001 and Shibanov et al. 2006) with a two-component, BB+PL, model. For the fixed , we found the temperature MK, spectral index , and PL normalization for . One can see that the BB emission dominates at Å. The fit also confirms that, in the NUV, the fraction of thermal photons is smaller than the fraction of nonthermal photons by a factor of 1.5, which is compatible with the deeper minima and higher pulsed fraction in the NUV light curve.
We plot the NIR to X-rays spectra for B0656 in the middle panel of Figure 3. The X-ray spectrum is again fitted with the TS+TH+PL model. We see that the extrapolation of the TS component from X-rays to lower frequencies roughly coincides with the FUV spectral flux and goes slightly above (by a factor of 1.3) the UV thermal component. This excess, however, is not statistically significant (see Fig. 4).

The double-peaked structure seen in the optical (Kern et al. 2003) and NUV/FUV light curves changes over to a single peak in the X-ray light curves (Fig. 2). It is possible that the asymmetric 0.250.7 keV pulse profile consists of two components: a broad one, peaked at about –, and a narrower component centered at –, close to the radio pulse phase, . In this case the maximum of the broader component would approximately coincide with the shallower minimum in the NUV and FUV light curves, which is located at the phase of a presumable maximum in the thermal UV component (see §2.2). The peak of the narrow component is approximately aligned with the single peak of the hard (24 keV) X-ray light curve.
Given the non-thermal interpretation of the peaks in the optical-UV light curves and the close match between the optical and X-ray PL components (Fig. 3), it is surprising that the 24 keV pulse profile of B0656 shows only one peak (at the phase of the second optical/UV peak; ). Since the phase-resolved spectroscopy shows similar PL slopes in both UV peaks, they are likely to be of a similar origin. The absence of the second peak at the X-ray frequencies could be explained assuming that the X-rays are emitted closer to the NS in a more narrow cone while the UV emission is generated higher in the magnetosphere and spread over a broader beam. Alternatively, it could be that the “X-ray PL” is not magnetospheric emission (see §4.3), and the match between the X-ray and optical spectra is just a coincidence.
3.3 Vela pulsar
Figure 1 shows the spectrum of the Vela pulsar from NIR to UV, with the optical/NIR data points adopted from Shibanov et al. (2003). This very flat spectrum nicely fits a PL model. The best-fit spectral index and normalization are and Jy (at Hz), respectively. The spectral index is larger than that obtained by Shibanov et al. (2003), , from fitting only IR and optical data. On the other hand, the optical-UV spectrum is substantially flatter than the non-thermal X-ray spectrum, .
The UV spectrum of the Vela pulsar allows one to obtain a restrictive upper limit on the NS surface temperature (see Romani et al. 2005 for details). The spectrum remains largely nonthermal even at the pulse minima, which constrains the NS temperature to MK, assuming the BB model for the thermal emission and . The limit becomes less restrictive, MK, if the hydrogen NS atmosphere model is used to describe the thermal spectrum. The inferred upper limit is surprisingly low compared to the temperature of the older B0656 (Table 3).
In the UV, the Vela pulse profile is dominated by multicomponent nonthermal emission. In Figure 2 we show the NUV, FUV and X-ray light curves together. The X-ray light curves obtained with Chandra (Sanwal et al. 2002) and RXTE (Harding et al. 2002) are extremely complex, with multiple peaks likely originating from different regions of magnetosphere or corresponding to physically different spectral components. In agreement with Harding et al. (2002), we identify at least five components in the multiwavelength pulse profile. No peaks are seen in the UV at the phases and 0.56 of the two -ray peaks (Kanbach et al. 1994). Instead, in the FUV they are replaced by tighter spaced peaks 1 and 2, which continue to the optical. We also find that the UV peaks 2 and 4 have counterparts in the soft X-ray light curve while peaks 1 and 3 appear to be shifted by with respect to the other two soft X-ray peaks. The UV light curves show strong correlation with the hard X-ray light curves obtained with RXTE above 10 keV (Harding et al. 2002), i.e. peaks 2, 3 and 4 are almost at the same phases in both UV and RXTE bands. At the same time, the correlation between the UV and 2.5–8 keV light curves is less obvious. The spectral indices of the individual UV components are rather uncertain and show no correlation with the RXTE components (Romani et al. 2005). Should a better NUV/FUV data be ever obtained, a joint phase-resolved analysis of the UV and hard X-ray data may be more revealing.
4 Discussion
4.1 Thermal emission from NS surface
The spectra of all the three pulsars show thermal emission, but the strength and position of the thermal hump vary. In the Vela pulsar, thermal emission is seen only in soft (0.3–2 keV) X-rays while in Geminga and B0656 the FUV spectra are also predominantly thermal. The observed FUV and soft X-ray spectra represent the R-J and Wien tails of the TS component. The TS BB temperatures measured in X-rays decrease from MK in the Vela pulsar to MK in B0656 and MK in the oldest Geminga. At the same time, the bolometric TS luminosity of the Vela pulsar is surprisingly low, which can be formally explained by a smaller emitting area of the TS component. The actual reason for this difference could be different properties (particulary, chemical composition and degree of ionization) of the NS atmosphere. In both Geminga and B0656 the brightness temperatures derived from the PL+BB fit to the combined NIR through UV data are lower than the temperatures of the X-ray TS component (see Table 3). The observed thermal UV spectrum of Geminga lies a factor of 1.52 below the continuation of the X-ray TS component (for a plausible extinction), whereas the UV deficit is substantially smaller, if present at all, in B0656. In the case of Vela pulsar, we could only estimate an upper limit on the UV brightness temperature, which lies above the extrapolation of the X-ray TS component.
Turning to the light curves (Fig. 2), one can see that in Geminga and B0656 thermal soft X-ray light curves show broad maxima with some non-thermal “bumps” on top of them. The bump (centered at ) is relatively large in B0656, making the soft X-ray light curve asymmetric. The soft X-ray pulse profile of Vela is much more complex, reflecting the larger non-thermal contribution than in the other two pulsars. However, one still can argue that there is a single broad thermal maximum in the range.
The FUV light curves of B0656 and, especially, Gemin-ga are also expected to be largely thermal. Yet, Geminga shows strong double-peaked FUV pulsations, different from both the NUV and the soft X-ray pulsations (see Fig. 3). Neither FUV nor soft X-ray pulsations of Gemin-ga can be produced by locally isotropic blackbody emission. Although the soft X-ray pulsations can be explained by a magnetized atmosphere model (e.g., Zavlin & Pavlov 2002), the high pulsed fraction and the peculiar shape of the FUV pulsations are not predicted by this model (notice, however, that the current atmosphere models are not applicable at the optical-UV frequencies). A possible explanation of the strong thermal pulsations invokes a “screen” of absorbing plasma suspended in the NS magnetosphere, which may partially eclipse the surface emission at certain rotation phases.
4.2 UV emission of Geminga and B0656 versus RQINSs
Over the last decade seven soft X-ray sources with thermal spectra have been discovered by ROSAT. Very large X-ray-to-optical flux ratios/limits and a lack of radio emission allow one to conclude that these objects are radio-quiet isolated neutron stars (RQINSs). Extensive X-ray observations of RQINSs with Chandra and XMM-Newton have provided high-quality spectra and period measurements for most of them (F. Haberl, these proceedings). Recent period derivative measurements by Kaplan & van Kerkwijk (2005ab) in RX J0720.4-3125 and RX J1308.6+2127 (J0720 and J1308 hereafter) place these RQINSs near the anomalous X-ray pulsars (AXPs) in the – diagram. However, the X-ray properties of RQINSs are quite different from those of AXPs (the BB temperatures of RQINSs are much lower, and no PL tails are seen). On the other hand, the X-ray spectra of RQINSs are also very different from those of ordinary old radio pulsars ( Myr; G; e.g., Zavlin & Pavlov 2004b; Kargaltsev et al. 2006). In terms of their thermal X-ray properties, RQINSs resemble middle-aged pulsars (see Table 3); however, the optical-UV properties of RQINSs show important differences.
Out of the seven RQINSs, five have been detected in the optical, and UV spectra have been obtained for two of the five, RX J1856.5–3754 (J1856) and J0720 (van Kerkwijk & Kulkarni 2001; Kaplan et al. 2003). The UV spectra of these RQINSs look thermal (), and even their optical fluxes seem to follow the same R-J curves, although Kaplan et al. (2003) report a faint non-thermal PL compontent, with , ergs s-1 for J0720 (for the other three RQINSs, the spectral slopes in the optical are uncertain). We note that no detectable optical magnetospheric component is expected at least in J0720 and J1308 (and likely in other RQINSs, whose spin-down powers, , have not been measured yet) if the nonthermal optical efficiency of these objects is similar to those of radio pulsars, – (Zavlin & Pavlov 2004b). For instance, one would expect – ergs s-1 for J0720, i.e. a factor of higher efficiency is needed to explain the result of Kaplan et al. (2003). More importantly, RQINSs exhibit significant excess in thermal UV emission, with the UV fluxes exceeding the continuations of the X-ray thermal spectra by a factor of 5–9. The nature of this UV excess is not firmly established yet. It could occur if the UV and soft X-ray thermal components are emitted from different regions (with different areas) on a non-uniformly heated NS surface (Pavlov et al. 2002). Alternatively, these NSs may have a condensed (solid) surface, possibly covered by a tenuous atmosphere that is optically thin in X-rays but optically thick in the optical-UV (e.g., Motch et al. 2003). Whatever is the nature of the large UV excess in RQINSs, we do not see it in B0656 and see a UV deficit in Geminga.
The apparently smaller UV-emitting area of Geminga, as compared to the X-ray-emitting area, cannot be explained by a nonuniform temperature distribution. We might speculate that the temperature distribution over the bulk of Geminga’s surface is more uniform than in J1856 and J0720, e.g., because of different geometry and strength of the magnetic field that affects the surface temperature distribution. However, to explain why the more uniformly heated Geminga exhibits quite substantial pulsations of its thermal X-ray radiation while no pulsations have been detected from J1856, one has to assume very special orientations of the J1856’s spin and magnetic axes. The lack of UV excess in Geminga can also be attributed to different chemical composition or lower temperature of the Geminga’s surface (Kargaltsev et al. 2005). However, the latter argument does not apply to B0656 whose UV and soft X-ray thermal components show higher temperatures, comparable to those of J1856 and other RQINSs. One could also speculate that the surface of RQINSs is solid while in B0656 and Geminga it is in a gaseous state. Indeed, the magnetic fields of Geminga and B0656 are 5–10 times smaller than those of J0720 and J1308, implying lower condensation temperatures (van Adelsberg et al. 2005). In addition, irradiation of the NS surface by energetic particles and photons generated in the magnetosphere may ablate the NS surface and facilitate formation of thick atmospheres in active pulsars while we see no indications of magnetospheric activity in RQINSs. The presence of thick atmospheres (lack of solid sufrace) in pulsars is supported by the fact that a hydrogen atmosphere model provides a reasonably good description of the TS spectrum in the Vela pulsar while the BB model gives a very small NS radius (Pavlov et al. 2001). (Such fully ionized atmosphere models, however, are not directly applicable to colder Geminga and B0656 because their atmospheres are not fully ionized.) In RQINSs, the solid surface, directly seen in X-rays, would emit the spectrum that resembles a BB but with the emissivity reduced by a factor of (van Adelsberg et al. 2005), which would explain the apparently smaller X-ray radii of RQINSs ( in Table 3). However, even a tenuous atmosphere on top of the solid surface can be opaque in UV, resulting in a larger UV emitting area. Within this interpretation, one still needs to explain the absorbtion features observed in the spectra of several RQINSs. Although it was suggested that these features can be formed in a hydrogen or helium atmosphere (see van Kerkwijk & Kaplan, these proceedings), they could also be due to the resonances at various hybrid frequencies in the dense magnetized condensate (van Adelsberg et al. 2005).
4.3 Nonthermal emission
In Geminga and B0656, the PL components fitted to the hard X-ray and optical spectra show similar slopes . However, in B0656 the extrapolation of the X-ray PL matches the optical points much better that in Geminga (see Fig. 3). For the Vela pulsar, the slope of the PL component is much steeper in X-rays, , than in the UV-optical, . However, one should keep in mind that the slopes of the X-ray PL components are measured in the narrow 2–8 keV band (Fig. 3) and hence are very uncertain because of a large background at these energies and, possibly, because the spectrum deviates from a simple PL. For instance, a comptonized tail of thermal radiation could mimic the nonthermal PL component in the narrow 2–8 keV band. Measuring hard X-ray spectra above keV will help to better understand the nature of the nonthermal emission in Geminga and B0656.
The 2–8 keV light curves show rather sharp and strong peaks for all the three pulsars. If the 2–8 keV emission is indeed due to the comptonization of thermal emission, one needs to explain its high anisotropy. The number of hard X-ray peaks varies from a single peak in B0656’s light curve to a double-peaked structure in Geminga, and even more complex multi-peak light curve in the Vela pulsar.
In the UV-optical, the Vela pulsar shows the strongest pulsations, with at least four narrow peaks. In contrast to the Vela pulsar, the UV light curves of B0656 have a large thermal contribution (% in FUV and % in NUV). Its NUV light curve shows two large peaks with a much wider separation than the main peaks in the NUV pulse profile of the Vela pulsar. Due to a much lower S/N in the B0656 NUV light curve, smaller and narrower non-thermal peaks may remain undetected. Similar to the Vela pulsar, the NUV light curve of B0656 is noticeably different from its 2–4 keV light curve. No obvious non-thermal contribution to the UV light curves is seen in Geminga, which is consistent with a large thermal fraction in the UV. However, non-thermal pulsations should be better seen in the optical ( Å).
5 Conclusions
We have observed three pulsars (Geminga, B0656+14, and Vela) at the far-UV and near-UV wavelengths with the STIS MAMA detectors and measured the pulsar spectra and pulse profiles. We have also analyzed the X-ray data and found that optical through X-ray spectra consist of thermal and non-thermal components in all the three pulsars. In particular, we found the following.
1. Thermal contribution to the FUV passband increases with pulsar age. The thermal component is not seen in the younger Vela pulsar ( kyrs), but it dominates the FUV spectrum in the Geminga pulsar ( kyrs). As the FUV spectrum grows more thermal, the “thermal hump”, whose maximum is located in soft X-rays/EUV, shifts toward lower frequencies.
2. The X-ray spectra of the two older pulsars, Gemin-ga and B0656, resemble those of RQINSs. However, their UV properties are noticeably different. In sharp contrast to RQINSs, whose spectra show large UV/optical excess, Geminga shows UV deficit while the continuation of the X-ray TS component approximately matches the R-J component in B0656. Likely, this reflects the differences in the magnetic field and phase state of the NS surface layers.
3. While no UV pulsations have been detected in RQINSs, Geminga shows strong, non-sinusoidal pulsations in the FUV range, where the spectrum is dominated by the thermal component. To explain the strong FUV pulsations, one may need to invoke magnetospheric absorption at certain rotation phases.
Acknowledgements.
We thank Slava Zavlin for the help with the X-ray data analysis and David Kaplan for providing the most recent parallax measurements for RQINSs. This work was supported by STScI grants GO-9182 and GO-9797 and NASA grant NAG5-10865.References
- (1) Brisken, W. F., Thorsett, S. E., Golden, A., & Goss, W. M. ApJ, 593, 89 (2003)
- DeLuca (2005) De Luca, A., Caraveo, P. A., Mereghetti, S., et al. ApJ, 623, 1051 (2005)
- Dodson (2003) Dodson, R., Legge, D., Reynolds, J. E., & McCulloch, P. M. ApJ, 596, 1137 (2003)
- Gouiffes (1998) Gouiffés, C., in Neutron Stars and Pulsars, eds. N. Shibazaki, N. Kawai, S. Shibata, & T. Kifune (Tokyo: Univ. Acad. Press), 363 (1998)
- Harding (2002) Harding, A. K., Strickman, M. S., & Gwinn, C. ApJ, 576, 376 (2002)
- Jackson (2002) Jackson, M. S., Halpern, J. P., Gotthelf, E. V., & Mattox, J. R. ApJ, 578, 935 (2002)
- Kanbach (1994) Kanbach, G., Arzoumanian, Z., Bertsch D. L., et al. A&A, 289, 855 (1994)
- Kaplan (2002) Kaplan, D. L., van Kerkwijk, M. H. & Anderson, J. ApJ, 571, 447 (2002)
- Kaplan (2003) Kaplan, D. L., van Kerkwijk, M. H., Marshall, H. L., et al. ApJ, 590, 1008 (2003)
- Kaplan (2005a) Kaplan, D. L. & van Kerkwijk, M. H. ApJ, 628, 45 (2005a)
- Kaplan (2005b) Kaplan, D. L. & van Kerkwijk, M. H. ApJ, 635, 65 (2005b)
- Kargaltsev (2004) Kargaltsev, O., Ph.D. Thesis, Pennsylvania State University (2004)
- Kargaltsev (2005) Kargaltsev, O., Pavlov, G. G., Zavlin, V. E., & Romani, R. W. ApJ, 625, 307 (2005)
- Kargaltsev (2006) Kargaltsev, O., Pavlov, G. G., & Garmire, G. P. ApJ, 636, 406 (2006)
- Kargaltsev (2006) Kargaltsev, O., & Pavlov, G. G. ApJ, in preparation (2006)
- Kern (2003) Kern, B., Martin, C., Mazin, B., & Halpern, J. P. ApJ, 597, 1049, (2003)
- Koptsevich (2001) Koptsevich, A. B., Pavlov, G. G., Zharikov, S. V., et al. ApJ, 370, 1004 (2001)
- Motch (2003) Motch, C., Zavlin, V. E., & Haberl, F. A&A, 408, 323 (2003)
- Pavlov (1995) Pavlov, G. G., Shibanov, Yu. A., Zavlin, V. E., & Meyer, R. D., in The Lives of the Neutron Stars, eds. M. A. Alpar, Ü. Kiziloglu, & J. van Paradijs (Dordrecht: Kluwer), 71 (1995)
- Pavlov (2001) Pavlov, G. G., Zavlin, V. E., Sanwal, D., et al. ApJ, 552, 129 (2001)
- Pavlov (2002) Pavlov, G. G., Zavlin, V. E., & Sanwal, D., Proc. 270 WE-Heraeus Seminar on Neutron Stars, Pulsars and Supernova Remnants, eds. W. Becker, H. Lesch, & J. Trümper, MPE-Reports, 278, 273, (2002)
- Romani (2005) Romani, R. W., Kargaltsev, O., & Pavlov, G. G. ApJ, 627, 383 (2005)
- Romani (1987) Romani, R. W. ApJ, 313, 718 (2005)
- Sanwal (2002) Sanwal, D., Pavlov G. G., Kargaltsev, O., et al., in Neutron Stars in Supernova Remnants, ASP Conf., 271, 353, (2002)
- Shearer (1998) Shearer, A., Golden, A., Harfst, S., et al. A&A, 335, 21, (1998)
- Shibanov (2003) Shibanov, Yu. A., Koptsevich, A. B., Sollerman, J., & Lundqvist, P. A&A, 406, 645 (2003)
- Shibanov (2005) Shibanov, Yu. A.; Sollerman, J., Lundqvist, P., et al. A&A, 440, 693 (2005)
- Shibanov (2005) Shibanov, Yu. A., Zharikov, S. V., Komarova, V. N., et al. A&A, 448, 313 (2006)
- vanKerkwijk (2001) van Kerkwijk, M. H. & Kulkarni, S. R. A&A, 378, 986 (2001)
- vanAdelsberg (2005) van Adelsberg, M., Lai, D., Potekhin, A. Y., et al. ApJ, 628, 902 (2005)
- Yakovlev (2004) Yakovlev D. G. & Pethick C. J. Ann. Rev. Astron. Astrophys., 42, 169 (2004)
- Zavlin (1996) Zavlin, V. E., Pavlov, G. G., & Shibanov, Yu. A. A&A, 315, 141 (1996)
- Zavlin (2002) Zavlin, V. E. & Pavlov, G. G. in Proc. 270 Heraeus Seminar on Neutron Stars, Pulsars and Supernova Remnants, eds. W. Becker, H. Lesch, & J. Trümper, MPE Reports, 278, 283 (2002)
- Zavlin (2004) Zavlin, V. E., & Pavlov, G. G. in Proc. XMM-Newton EPIC Consortium, Mem. Soc. Astron. It., 75, 458 (2004a)
- Zavlin (2004) Zavlin, V. E., & Pavlov, G. G. ApJ, 616, 452 (2004b)