Evidence for relativistic features in the X-ray spectrum of Mrk 335.
Abstract
We present an analysis of hard X-ray features in the spectrum of the bright Sy 1 galaxy Mrk 335 observed by the XMM-Newton satellite. Our analysis confirms the presence of a broad, ionised iron K emission line in the spectrum, first found by Gondoin et al. The broad line can be modeled successfully by relativistic accretion disc reflection models. This interpretation is unusually robust in the case of Mrk 335 because of the lack of any ionised (“ warm”) absorber and the absence a clear narrow core to the line. Partial covering by neutral gas cannot, however, be ruled out statistically as the origin of the broad residuals. Regardless of the underlying continuum we report, for the first time in this source, the detection of a narrow absorption feature at the rest frame energy of 5.9 keV. If the feature is identified with a resonance absorption line of iron in a highly ionised medium, the redshift of the line corresponds to an inflow velocity of 0.11-0.15 c. We present a simple model for the inflow, accounting approximately for relativistic and radiation pressure effects, and use Monte Carlo methods to compute synthetic spectra for qualitative comparison with the data. This modeling shows that the absorption feature can plausibly be reproduced by infalling gas providing that the feature is identified with Fe xxvi. We require the inflowing gas to extend over a limited range of radii at a few tens of to match the observed feature. The mass accretion rate in the flow corresponds to 60% of the Eddington limit, in remarkable agreement with the observed rate. The narrowness of the absorption line tends to argue against a purely gravitational origin for the redshift of the line, but given the current data quality we stress that such an interpretation cannot be ruled out.
keywords:
accretion discs – X-rays:quasars – line:profiles .1 Introduction
Since the discovery of Active Galactic Nuclei (AGN), it has been postulated that the powering mechanism is likely to be the release of gravitational energy by matter accreted on a supermassive black hole (e.g. Lynden-Bell 1969). Evidence for material close to the black hole has been found in the redshifted and broad Fe K disc line seen in bright Seyfert galaxies (Tanaka et al. 1995; Nandra et al. 1997). An important concern for the disc line interpretation is that many Seyfert galaxies possess highly ionised gas in the lines of sight (“warm absorbers” e.g. Halpern 1984; George et al. 1998). If there is an absorber component with sufficiently high ionisation state and column density, it can distort the continuum redward of the Fe K line mimicking a broad line profile (e.g. Reeves et al. 2004). Among the best examples of individual objects with broad lines are MCG-6-30-15 (Tanaka et al. 1995, Iwasawa et al. 1996, Wilms et al. 2001; Fabian et al. 2002, Ponti et al. 2004) and NGC 3516 (Nandra et al. 1999, Iwasawa et al. 2004). Both have ionised absorbers, but recent analysis of both objects have shown that despite their effects, a broad line is still required in the data (Young et al. 2005, Turner et al. 2005). If the remaining doubts about the effects of complex absorption can be dispelled, broad iron K lines can be used as a diagnostic of the accretion flow in the strong gravity regime (e.g. Fabian et al. 2000; Reynolds & Nowak 2003). It would therefore be reassuring for the disc line interpretation if an object without a warm absorber could be found to exhibit broad iron emission.
The broad iron lines represent evidence for rotation close to the central black hole in the form of an accretion disc. Observational evidence for inflow of matter in the vicinity of the black hole remains extremely scarce, however. Nandra et al. (1999) reported the presence of a highly reshifted absorption feature identified with iron K in the ASCA spectrum of NGC 3516. This was interpreted as being due to a high velocity inflow at , and thus representing evidence for matter flowing onto the black hole. An alternative interpretation in terms of gravitational redshift was presented by Ruszkowski & Fabian (2000). Subsequent, high signal-to-noise spectra of NGC 3516 have been presented by Turner et al. (2002), and showed narrow, shifted emission features, rather than absorption. However, the apparently transient nature of the narrow absorption and emission features (Nandra et al. 1999; Turner et al. 2002) make it hard to confirm or refute them conclusively. Very recently, a number of additional reports of redshifted absorption features have been made based on BeppoSAX, XMM-Newton and Chandra data (Dadina et al. 2005; Matt et. al. 2005; Reeves et al. 2005; Yaqoob & Serlemitsos 2005). The significance of these features is generally somewhat marginal, but the great increase in the number of reported cases since the initial detection in NGC 3516 increases the likelihood that the redshifted absorption features are real and can be used as a meaningful tool to probe the accretion environment of the black hole.
Mrk 335 is a bright Seyfert 1 galaxy at z=0.026, known also as PG 0003+199 as part of the Palomar Green sample of UV-excess selected objects. It was observed several times by different X-ray observatories. Observations by EXOSAT (Turner & Pounds, 1989) and BBXRT (Turner et al. 1993) reported the presence of a soft X-ray excess, which was confirmed later by Reynolds (1997) in a sample of sources observed by ASCA. ASCA data did not provide any clear evidence for warm absorption (Reynolds, 1997; George et al. 1998), but Turner et al. (1993b) found tentative evidence for soft X-ray spectral complexity in ROSAT data and Nandra & Pounds (1994) found evidence for a hard X-ray edge in Ginga data.
BeppoSAX data highlighted the presence of a reflection component and a very strong Fe K line, interpreted as arising from an ionised accretion disc (Bianchi et al. 2001). Ballantyne et al. (2001) have found that the ASCA spectrum of Mrk 335 is well fitted by an ionised disc model using the code by Ross & Fabian (1993).
The XMM-Newton spectrum has been previously studied by Gondoin et al. (2002) who reported on both EPIC and high resolution data from the RGS spectrometer in the 0.3-2.1 keV band. From such work, the following findings have emerged: the presence of a relativistic Fe K line with an extremely high EW ( 800 eV), interpreted as originating from the inner regions of a disc in accretion around a spinning black hole; the low energy X-ray continuum is characterised by a soft excess and it is interpreted as arising from a combination of an ionised reflection and from intrinsic thermal emission in the disc; no evidence for soft X-ray features other than the 0.54 keV edge from Galactic Oxygen has been found in EPIC and in the RGS data.
Here a re-analysis of Mrk 335 is presented. The paper is organised as follows: section 2 reports on the data reduction; section 3 describes the spectral analysis of the Fe K line and of the X-ray continuum; section 4 reports on the detection of a narrow absorption line including a discussion on its significance; in section 5 a Monte Carlo model of a relativistic inflow is described, for comparison with the observations. Results from the spectral fits and from the inflow model are discussed in section 6.
2 Observations and data reduction
Mrk 335 was observed by XMM-Newton on 25-12-2000 (ID 0101040101) for a duration of 34 ks. The data have been reduced with SAS version (6.5.0) and calibrated event lists were obtained with the tasks epproc and emproc. The absence of soft protons flares in the light curve and an extremely low background level yield an exposure of 30 ks after accounting for the detector deadtime. The observation was performed in full frame mode for the pn camera and in large window mode for the MOS detectors. The high count rate of the source induced photon pile-up in all three EPIC cameras. To reduce the effect of the pile-up in the spectra, the source counts were extracted from annular regions in order to exclude the core of the PSF where the most piled-up pixels are concentrated. The task epatplot was employed to check the level of pile-up in the event files obtained from annular regions with increasing inner radius. The pn spectrum was extracted from an annular region with radii of 8 and 50 arcsec and the MOS spectra were taken from annuli with radii between 4 and 60 arcsec (i.e. a circle of 2 pixels radius has been excluded). Single and double patterns were selected. The background counts were chosen from a circular source-free area close to the target centroid, with extraction radius of 50 and 60 arcsec. The spectra have been grouped in order to have at least 50 counts per bin in the pn and 20 counts per bin in the MOS spectra in order to apply minimization in the spectral fitting.
An inspection of the light curves shows that the source flux varies by per cent over the whole exposure, but no strong spectral variability is detected. The analysis is therefore carried out on the whole integrated spectrum. Throughout the paper, the errors are quoted at 90% for one interesting parameter (i.e. =2.71 criterion) and the energies of spectral features are corrected for the redshift of the source.
3 Spectral analysis of the broad feature and the X-ray continuum
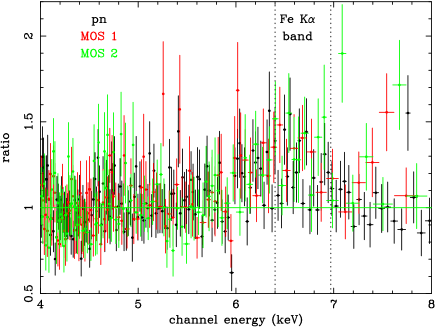
We begin by fitting the pn and the MOS spectra between 2-10 keV with the aim of finding a suitable parametrization of the data. The MOS1 and MOS2 spectra are fitted simultaneously. A simple power law model yields a steep spectrum, with the photon indeces =2.16 in the pn and 2.13 in the MOS. The probability values are marginally acceptable (/d.o.f.=414/413 for the pn and /d.o.f.=560/550 for the MOS, but the residuals from both instruments show systematic deviations from the power law model. The residuals obtained from fitting simultaneously the EPIC data are plotted in Fig. 1 (in the 4 to 8 keV band). The presence of broad excess in flux above the position of the neutral line (6.4 keV) up to 7.2 keV and down to 5.9 keV is quite clear, i.e. both “blue” and “red” flux are present in the residuals. There is no clear narrow core to the emission line, in constrast to several other similar Seyferts (Yaqoob & Padmanhaban 2004). In addition to the excess emission component at the iron line, a deficit of counts in a notch-shape is also present at 5.9 keV.
A phenomenological description of the data is given in the following before embarking on fitting more physical models. The spectral fits are performed on the pn data only since the MOS sensitivity above 5 keV is much lower than the pn. The MOS are nonetheless consistent with what is found in the pn. Firstly, a Gaussian line was added to the power law, with energy, width and flux free to vary. The line is highly significant with =38 for 3 d.o.f. We find a rest-frame energy of E=6.49 keV, =0.40 keV and an equivalent width of EW= 260 eV. Although the residual shape in Fig. 1 suggest the presence of a more complex line than this, any attempt to fit the data with 2 Gaussian emission lines failed to produce a statistically significant improvement.
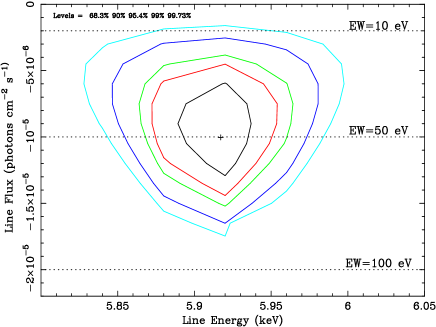
To fit the notch-shaped absorption feature a Gaussian line with negative intensity was added. The width of the absorption line is unresolved with CCD resolution and therefore it is kept fixed to 1 eV. The line parameter in the pn camera are E=5.92 keV with an EW=50 eV (measured in absorption with negative intensity with respect to the continuum), and the broad line parameters change to E=6.22 keV, =0.66 keV and EW=490 eV. The confidence contours for the absorption line are shown in Fig. 2. The improvement in is 16 for 2 degrees of freedom, corresponding to a level of confidence higher than 99.7 percent according to the F-test. The fit yields an acceptable =360/408 d.o.f. but it is clearly only a basic parametrization of the spectrum. We have checked for the presence of the narrow line in the MOS spectra, using the same baseline model as for the pn. The line parameters were found to be in agreement with the pn results: the energy is E=5.91 keV and the EW= 32 eV, yielding therefore an upper limit consistent with the value found in the pn. The narrow line is less significant in the MOS (6) as expected giving that the collecting area of the combined MOS is only 80 percent of the pn. We now go on to consider more physically motivated interpretations of the spectral features.
3.1 A disc line origin for the Fe K line ?
The line profile in Fig. 1 appears complex not only because of the absorption feature, but also because the residuals show a broad and possible double-peaked structure. The profile is in facts asymmetrical and skewed suggesting that it could be modified by relativistic effects. To test this hypothesis we have replaced the broad Gaussian with a DISKLINE component (Fabian et al. 1989) and with a LAOR component (Laor 1991). The former model corresponds to the computation of the line photons emitted close to a non-spinning black hole in the Schwarzschild metric whereas the latter adopts the Kerr metric, for a rapidly rotating black hole. For both models, the line parameters are the rest energy, , q, the line emissivity index, where the line emissivity j is a function of the emission radius r according to j r-q; the inner radius rin and the outer radius rout of the accretion disc which define the area of the disc where the line is emitted; the inclination of the disc i, defined as the angle between the line of sight and the normal to the disc.
The two models were tested fixing the emissivity index q=3. In both cases the spectral fits are consistent with the line being emitted at energy higher than 6.4 keV, indicating an ionised accretion disc, confirming the results by Gondoin et al. 2002. When the line profile is fitted with DISKLINE, we obtain E=6.99 keV and EW=344 eV, i=21∘ and /d.o.f.=375/409. The disc is constrained within 6 and 60 rs. The addition of a narrow absorption line improves the fit (/d.o.f.=360/407) with no appreciable change in the model parameters: although the best fitting value is different the diskline parameters remain in good agreement with the values quoted before.
When the line is fitted with a LAOR line model, the fit is equally good (/d.o.f.=374/409) with very similar parameters: E=6.93 keV, EW=320 eV and the inclination i is constrained to be less than 33∘. Adding the narrow absorption line yields the same improvement (/d.o.f.=360/407). There is a strong indication that an ionised disc line is preferred with respect to a neutral line. However, these fits are not conclusive as the presence of a disc line implies a reflection component in the spectrum. This will be tested extensively in section 3.2.
3.2 Reflection continuum from the accretion disc
We consider here the role played by reflection in the continuum emission formation. Four spectral models are tested in the following (see Table 1 for a summary). In all four models we set the outer radius of the disc to be rout=400 rg. The inner radius is set to be equal to the innermost stable orbit i.e. 1.24 rg in models where a Kerr metric is used (A, B, C) and 6rg in the model adopting the Schwarzschild metric (model D). Where possible, however, we have tried to constrain the inner radius by treating it as a free parameter. All the models comprise an input primary power law and a reflection component for the continuum. Model A and B comprise also a Gaussian emission line to reproduce the broad Fe K, whereas in models C and D the line is included in the computation of the reflection spectrum. In models A, B and C the relativistic effects due to the strong gravity of the black hole are taken into account by applying the relativistic blurring code KDBLUR (Fabian et al. 2002). The code adopts the Kerr metric (Laor1991) and it smears out the spectrum according to the same 4 parameters described in the previous section for the disc lines: q, rin, rout and i. The KDBLUR code is applied to the reflection continuum and the emission line only. To account for the absorption feature at 5.9 keV, an absorption line with the width fixed to 1 eV and Gaussian profile is included in all the models; physical models and a discussion of the nature and origin of this feature are deferred to the following section.
| Model | R | Ebroad | EWbroad | i | rin | q | /dof | ||
|---|---|---|---|---|---|---|---|---|---|
| (ergs cm s-1) | (keV) | (eV) | (degrees) | rg | - | ||||
| (A): PEXRAV+ PLAW+ | 2.27 | 1 | - | 6.4 | 570 | 80 | 1.24 | 2.27 | 355/403 |
| 2 GAU + KDBLUR | |||||||||
| (B): PEXRIV +PLAW+ | 2.300.05 | 1 | 1000 | 6.97 | 300 | 30 | 4 | 2.5 | 360/402 |
| 2 GAU + KDBLUR | |||||||||
| (C): REFLION + | 2.200.02 | - | 760 | - | - | 2510 | 1.24 | 1.8 | 344/402 |
| GAU + KDBLUR | |||||||||
| (D): XION + PLAW+ | 2.170.03 | - | - | - | - | 27 | 6 | - | 355/403 |
| GAU |
(A, B): R=, where is the solid angle of the reflecting slab subtended at the X-ray source
(D) The “lamppost” geometry is assumed for XION (see text)
We start with the PEXRAV model (Magdziarz & Zdziarski 1995) which describes the reflection of an incident power law by a slab of neutral gas (model A in table 1). We initially fixed the emission line energy to be 6.4 keV and the reflection fraction to be ( represents the solid angle of the reflector ). In this fit the power law gets steeper, with a photon index of 2.27, as expected when adding a reflection component to a simple power law model (Nandra & Pounds, 1994). This model provides a good fit (/d.o.f.=355/403) to the data, but it requires viewing the disc at an unusually high inclination (80∘). This seems unlikely for two reasons. Firstly, such a high inclination is not expected for a Seyfert 1 galaxy such as this. Secondly, and perhaps more importantly, at high inclinations very weak reflection features are expected (George & Fabian, 1991), whereas we find a very strong Fe K here ( 500 eV). If we test this fit with an inclination angle fixed to 30∘, the worsens (/d.o.f.=363/404), but it is still acceptable. However, we regard it more probable that the excess “blue” flux is a consequence of the disc being ionised since this interpretation is more consistent with the line energy (see Section 3.1).
As a first attempt we use the PEXRIV model (model B in table 1), which is basically a PEXRAV component with the disc temperature and the ionisation parameter of the gas as additional parameters. The ionisation parameter is the key discriminant when fitting ionised accretion disc spectra. It is defined as = where F is the incident power law flux in ergs s-1 cm-2 and nh is the hydrogen number density of the slab in cm-3. The spectral features in the resulting spectra depend on the ionisation state of the disc (e.g. Matt, Fabian & Ross 1993, 1996). During the fitting procedure the line energy is fixed at 6.97 keV for H-like iron, as indicated by the fits in section 3.1. With the line being emitted at the maximum ionisation state, must be in the range 500 5000 ergs cm s-1 and so it is fixed at 1000 ergs cm s-1 (Matt, Fabian & Ross 1993). The emissivity index appears quite steep (q 2.5) implying that the emission is concentrated in the inner regions. The inclination in this fit seems more plausible, being constrained to be 30∘.
We next employ the ionised disc model described in Ross & Fabian (2005) (REFLION, model C in table 1), based on the models first proposed by Ross & Fabian (1993) and Ross et al. (1999). This model calculates the reflection spectrum from an infinite slab of ionised gas illuminated by an X-ray power-law continuum. All the ionisation states and transitions are included in the calculated spectrum. The ionisation state of the slab, the spectral index and the iron abundance are free parameters. The best fitting parameters for this model are listed in Table 1, model C. The fitted iron abundance is not listed in the table but it is close to the Solar value (Fe/solar0.9).
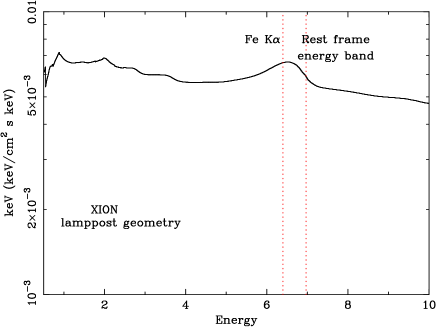
The computation of the reflected spectrum assuming constant density in the reflecting slab is not entirely physical; as studied in Nayakshin, Kazanas & Kallmann (2000), thermal and ionisation instability in the disc will lead to the formation of a top layer of ionised material, superposed on cold neutral gas. In such a case, the density varies along with the ionisation state and radiation field, and it cannot be considered constant. Therefore, we decide to fit our data with the XION model (model D in table 1) developed by Nayakshin & Kallman (2001) and implemented in XSPEC, which calculates the reflected spectrum in hydrostatic balance, taking into account the ionisation instability in the disc. After choosing one of the available geometries, the model parameters are the distance between the disc and the source of X-ray photons, the accretion rate, the luminosity of the X-ray source, the inner and outer disc radii and the spectral index. The reflected spectrum is calculated for 30 different radii and then integrated over the disc surface. Relativistic smearing is included for a non-spinning black hole according to Fabian et al. (1989). XION includes three types of geometry: a compact X-ray source located above the disc (the so-called lamppost), a central sphere with an outer cold disc and a magnetic flares geometry. All of them have been tested without finding any discriminant, so we resolved to assume the simplest configuration (lamppost). The model is shown in Fig.3. Assuming that the reflecting disc extends between 6 and 400 rg, we get the following parameters: =2.17 and the inclination of the disc is consistent with a plausible value of 30∘ (see Table 1). The height of the X-ray source above the disc is constrained to be lower than 10 rg. The model is statistically comparable to the others in Table 1, yielding /d.o.f.=355/403.
Clearly, ionised disc models are able to fit the spectrum of Mrk 335 rather well. Nonetheless, we test an alternative scenario in the next section.
3.3 Alternative to disc reflection: partial covering
The spectral curvature in Mrk 335 could be the result of cold gas partially covering the source of primary photons. This hypothesis is tested by fitting the spectrum with a model expressed by A(E)*M(E) where A(E) is the primary power law and the absorption component M(E) is defined as
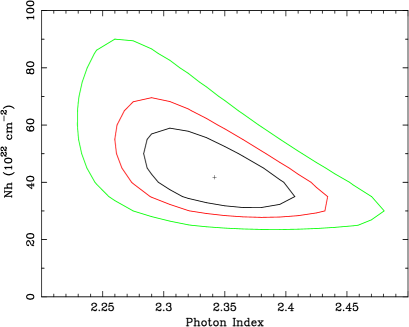
The absorption component depends on the column density of the absorbing material NH, on the photoelectric absorption cross section and on the fraction of the source obscured by the absorber, Cf. Such a model is implemented in XSPEC (PCFABS) and it yields an acceptable fit to the data, with /d.o.f.=373/407. The best fit parameters are consistent with a steep power law, =2.34. The covering fraction is found to be 38 percent. The column density of the medium is found to be 4.1 1023 cm-2. The confidence regions are shown in Fig.4, and indicate that over a large range of photon indeces, the column density is of this order of magnitude. Adding a narrow Gaussian line with negative intensity to the PCFABS component improves the fit by =10 for 2 free parameters. The energy is again very tightly constrained to 5.92 keV. The /d.o.f. (363/405) is comparable with those found in the best fitting reflection models. The presence of a column of cold gas shielding a photoionizing source, implies that a fluorescence line is emitted at 6.4 keV, following the absorption. We have checked the 90% upper limit of the EW for a neutral line with = 0.01 keV and it is found to be 45 eV. For a spherical absorber fully covering the source, the expected EW for a column density of 1023 cm-2 is approximately 100 eV (Leahy & Creighton 1993). With the best-fit covering fraction above, we therefore expect the EW to be eV, just consistent with the upper limit quoted above. The partial covering model cannot therefore be ruled out on the basis of the lack of a line core.
4 The narrow absorption line
Regardless of the model of the broad emission around iron-K in Mrk 335, we find evidence for a narrow notch-like feature at 5.9 keV detected in the EPIC data. The significance of this feature implied by a standard F-test, is higher than 99.73 per cent. As it has recently been shown by Protassov et al. (2002), the F-test may not be a reliable indicator of the significance of narrow feature such as these. It is therefore necessary to test the significance using simulations.
4.1 On the significance of the narrow absorption feature
To test the significance of the absorption feature we have performed Monte Carlo simulations assuming two baseline models (Table 2). The first consists of a power law + broad Gaussian line (as described in section 3) while the second is a power law + DISKLINE (as described in section 3.1). The values of for adding the narrow line are 16 and 13 respectively for the gaussian lines baseline and for the diskline baseline. We test the null hypothesis, namely “what is the probability that a value of this large or larger will be obtained by chance?”. To answer this question, 10000 spectra have been simulated with XSPEC assuming the baseline model without the absorption line, folding it through the same instrumental response and adding noise randomly. These spectra have then been grouped according to the same criterion adopted for the real data set, i.e. 50 counts per spectral bin. In this way, 10000 fake background-subtracted data sets have been obtained with photons statistics corresponding to 30 ks in the pn detector (around 28000 counts between 2 and 10 keV). Each of these spectra is fitted with the baseline model. Then, a narrow absorption line is added to the fit, and the improvement in with respect to the baseline model is determined. The width of the absorption line is fixed to 1 eV during the fitting and the energy of the line is stepped in increments of 70 eV. To avoid any effect of the calibrations at the boundary of the instrumental response, the search is performed in the energy range 2.5–9.5 keV. This process was performed for both baseline models. We obtain a significance of 99.70 per cent for the gaussian baseline model which confirms the goodness of the detection. The value obtained using the DISKLINE model is slightly lower, but still strongly suggests that the null hypothesis can be rejected.
| Baseline | F-test sig. | M.Carlo sig. |
| Model | - | - |
| P. law+ broad Gau | 99.73% | 99.70% |
| E=6.49 keV, =0.4 keV | ||
| P.law+Diskline | 99.73% | 98.44% |
| E=6.99 keV, i=21∘, q=3 |
4.2 The narrow feature: complex absorption


The most obvious identification for the absorption feature is with redshifted iron K resonance absorption. The identification with iron is favoured since the observed energy of the line is too high to be readily explained by K absorption in any of the other astrophysically abundant elements. Furthermore, the absence of any related absorption lines at softer energies (Gondoin et al. 2002) suggests a high ionization state for the absorbing material. Thus we consider there to be two plausible identifications, with iron xxv K or xxvi K. It may be possible to test between these by modeling the absorption line using a photoionisation code. We therefore used XSTAR to generate a grid of photoionisation models with various ionisation parameters and column density. Solar elemental abundances and turbulence velocity of 100 km/s were assumed. This grid has been incorporated into XSPEC as a table model with 3 additional free parameters: i) the column density (named Nw to be distinguished from the cold column in Table 1); ii) the ionisation parameter ; iii) a redshift parameter which includes all possible contributions (i.e. the cosmological redshift (zsource), the velocity of the absorber (zinflow) and the gravitational redshift (zgrav)).
We have tested a model in which the Gaussian absorption line in model D of Table 1 is replaced by this XSTAR model. The results are plotted in the left panel of Fig. 5 and the fit yields /d.o.f.=359/401. Four main absorption features are imprinted on the continuum (see right panel of Fig. 5): the K and K transitions of Fe xxv and xxvi. However, only the K ones are sufficiently strong to be important here. The energies of the transitions of interest are reported in Table 3. The absorption line detected in the data is consistent with identification with the Fe xxvi K line, whereas the other features predicted by the model are too weak to be detected at the CCD resolution. If this identification is correct, the redshift correponds to an inflow velocity of 0.15 c, if gravitational redshit is neglected.
ABSORPTION LINES
Ion
Transition
Eem
Eobs
inflow v
Fe XXV
K
6.70 keV
-
-
K
7.88 keV
-
-
Fe XXVI
K
6.97 keV
5.92 keV
0.15 c
K
8.17 keV
-
-
5 A simple model for inflow
To elucidate the inflow hypothesis, in this section we present a simple physical model and use it to synthesise X-ray spectra for qualitative comparison with the observed absorption feature.
5.1 Flow structure
Given the modest data quality and that only one line is detected, we will consider only the simplest class of inflow models, that of spherically symmetric radially infalling gas. We assume that the gas occupies a region which extends from inner radius to outer radius from the central black-hole. We adopt a velocity-law for the gas which is appropriate for radial infall allowing for the possibility of significant repulsive radiation pressure, namely
| (1) |
where is the gravitational radius of the black-hole, is the radial co-ordinate and is the ratio of the luminosity of the central region to the Eddington luminosity for the central black-hole. The last term in equation 1 accounts for the effect of repulsive radiation pressure on electrons only - it neglects radiation pressure due to spectral lines. This is likely to be a good assumption since it is found in all the models discussed below that the gas is very highly ionised. For the black-hole in Mrk 335, we adopt a mass M⊙ (Peterson et al., 2004).
To specify the density of the flow we use a prescription based on a constant mass infall rate (), namely
| (2) |
In addition, we have fixed the electron temperature of the flow at K, close to the primary black-body temperature temperature fit to the observed spectrum (Gondoin et al. 2002). Solar abundances are adopted.
5.2 Spectral synthesis method
With the flow model described above, spectra were synthesised for the 2 – 10 keV region using a Monte Carlo radiative transfer code based closely on that discussed by Sim (2005) which uses methods developed by Lucy (1999, 2002, 2003). The code includes the effects of spectral lines, bound-free edges and Compton scattering by free electrons (although inverse Compton scattering is not included). The atomic data used for the calculations, and the treatment of excitation and ionisation of the flow are exactly as discussed by Sim (2005).
The radiation field incident on the lower boundary of the flow consists of the same three components as used by Sim (2005): a multi-colour black-body disc (following Mitsuda et al. 1984; the particular implementation is exactly as used by Sim 2005), a soft-excess (modelled as a black-body) and a power-law tail extending to X-ray energies. For the computation presented here, the power-law photon index was fixed at (based on fits to the data, see Section 3) and the normalisation fixed by requiring the total 2 – 10 keV X-ray flux to match the observed luminosity of ergs s-1. The disc luminosity was set to 60 per cent of the Eddington luminosity for the central black-hole, close to the value reported for Mrk 335 by Gierliński & Done (2004) based on the work by Boroson (2002). The soft-excess was modelled as a black-body with temperature K and normalisation fixed to the power-law component.
In contrast to that presented by Sim (2005), the code used here includes the full special relativistic expression for the Doppler shift and approximately accounts for gravitational redshift using
| (3) |
where is the frequency of a photon at radius as measured in the comoving frame, is the usual direction cosine, and is the photon frequency that would be recorded by an infinitely distant observer at rest relative to the black-hole. Other relativistic effects (including aberration of angles) are neglected.
Monte Carlo simulations were performed to determine the ionisation state and provide the necessary estimators for the radiation field before synthesising a spectrum by tracing rays as described by Lucy (1999) and Sim (2005). The method was generalised to account for cases where photon frequencies blue-shift in the co-moving frame along parts of their trajectories (Lucy 1999 and Sim 2005 consider only accelerating outflows in which the co-moving frequency decreases monotonically along all photon paths).
5.3 Results from the model
5.3.1 Inflow extending over a wide range of radii
We begin by showing that the data can rule out the simplest inflow model that can be considered, that of a smooth continuous flow which extends from near ( several ) the central black-hole to much greater distances. Fig.6 shows the 3 – 9 keV spectrum computed for a model of this sort with , , yr-1 and neglecting radiation pressure in the assumed velocity law (i.e. setting in equation 1). In agreement with the observations, this model predicts very few spectral features since the ionisation state of the gas is very high. The dominant feature is a broad inverse P Cygni Fe xxvi K line, but a weaker feature due to the K line of the same ion appears at harder energies.

However, although the model predicts the correct absorption line, it can be strongly ruled out by the data since the line shape and position are quite different: the observed feature lies at 5.9 keV and is sufficiently narrow to be unresolved in the data. In contrast, the computed absorption line is very broad, extending from around 5.5 keV to a point of deepest absorption at keV.
The large line width in the model is a result of the large radial extent, and therefore large velocity range, adopted for the flow. Fig. 7 shows the Fe ionisation state of the flow as a function or radius. At all points, the fully ionised state (Fe xxvii) is dominant with a significant contribution from the H-like ion (Fe xxvi). The He-like stage does not account for more than a few percent anywhere in the model and thus it is the H-like ion that dominates the line formation. There is a gradient of ionisation present such that a higher ionisation state (i.e. less Fe xxvi) occurs at small radii. For the density stratification given by equation 2, this ensures that the Fe xxvi line opacity remains significant out to large radii which gives rise to the low-velocity absorption seen in the spectrum. For the velocity and density laws specified by equations 1 and 2, to obtain a line profile closer to that observed (i.e. in which the opacity is concentrated at high velocities) would require an ionisation gradient in the opposite sense to that obtained here – however, that cannot be readily achieved since the influence of self-shielding in the flow will always favour a decreasing ionisation state with radius. Thus, in order to obtain a model which predicts spectra closer to that observed, one must consider alternative models to the continuous, large-scale spherical inflow.

5.3.2 Inflow extending over a limited range of radii
As discussed above, a large-scale spherical inflow model predicts an Fe xxvi absorption line which is too broad for consistency with the data. However, consistency can be obtained by restricting the range of radii in which the density of infalling gas is significant. Such a model might approximately describe a discrete infalling blob of gas or a larger scale inflow in which the accretion rate is variable leading to sections of the flow which are significantly more dense that others. With the model considered here, this can be readily achieved by limiting the radial range occupied by the flow. In order that the deepest absorption occurs at around keV, corresponding to a redshift of the Fe xxvi line by 0.15c, a strong constraint can be placed on the outer boundary of the inflow: is required. Using equation 1, this leads to if the radiation pressure is neglected. When radiation pressure is accounted for with , the required outer radius is smaller, . Fig. 8 shows the computed spectrum for a flow with , and yr-1. This model provides a good description of the narrow absorption line identified in the data. Note that the model does not include the formation of the Fe K emission line which was discussed in Section 3. This most probably accounts for the excess emission to the blue of the absorption feature.
The constraint on the inner radius adopted for the model is less strong than that on the outer radius since the opacity drops at high velocities due to the combination of higher velocity gradient, higher ionisation state and shorter path length. Thus the adopted value of should only be regarded as an upper limit on .

The mass accretion rate in the flow, yr-1, was chosen in order to obtain an absorption line strength consistent with the observations. This value can be compared with the Eddington accretion rate for the central black-hole, given by
| (4) |
where the is the opacity and is the efficiency of the accretion process in producing radiation. For our adopted M⊙ with (where is the Thomson cross-section) and adopting this gives yr-1. Thus our model inflow has , in remarkable agreement with our observationally motivated assumption that . The value of needed by the model is moderately well constrained. For lower values of (below about 0.15 yr-1) the predicted absorption line is too weak to be detectable; this is a strong effect because reducing both decreases the Fe density and makes the gas more highly ionised. It is unphysical to consider steady-state spherical models with significantly higher values of since is unacceptable for such a model. However, this limit can be avoided if the inflow subtends only a fraction of solid angle since in such a case the true accretion rate onto the black-hole would be only . Although we have not yet extended our modelling to consider non-spherical geometries, the absorption part of the line profile computed from the spherical model is likely to remain approximately valid for a non-spherical inflow which lies directly in the line of sight of an observer. Nevertheless, the data excludes values of significantly greater than that adopted in the model since for higher values of , the line becomes stronger and Compton downscattering in the flow causes the continuum to bend downwards at high energies.
6 Discussion
We have performed a detailed investigation of the hard X-ray spectrum of Mrk 335 as seen by XMM-Newton. The main results can be summarised as follows.
-
•
The presence of a broad Fe K line associated to a reflection component is confirmed, as previously reported in Gondoin et al. (2002). This line is well fitted by disc reflection models, as long as the accretion disc is strongly photoionised. Nonetheless, a partial covering component provides a statistically plausible alternative for the broad residuals.
-
•
For the first time, a narrow absorption line is detected at 5.9 keV. The significance of this line based on Monte Carlo simulations is 99.7 per cent. If real, this feature may be the signature of infalling gas in Mrk 335.
-
•
A model for the inflow has been developed and qualitatively compare to the data. We find that the observed feature can be matched if it is identified as Fe xxvi in highly ionised gas, inflowing as at a few tens of gravitational radii.
6.1 On the interpretation of the broad residuals
Mrk 335 presents clear evidence for broad emission from keV. Such emission has been found to be common in the X-ray spectra of AGN observed by ASCA and interpreted as relativistic emission from an accretion disc (Nandra et al. 1997). As we have shown, there is excellent agreement between such models and the data in the case of Mrk 335. This is particularly important because Mrk 335 is one of only a few bright Seyferts which show no evidence for photoionised gas in the line of sight (Blustin et. al 2004). This fact rules out alternative interpretations for the broad residuals based on complex absorption in high ionisation gas (Reeves et al. 2004). Furthermore, the lack of any 6.4 keV core to the line, otherwise common in AGN (Yaqoob & Padmanhaban 2004), rules out any significant contribution from a distant reflector such as the molecular torus (Ghisellini, Haardt & Matt 1993; Krolik, Madau & Zycki 1993). This removes another potential complication in the interpretation of the broad residuals.
The only alternative to the disc line we have not been able to rule out with the present dataset is that of partial obscuration by a neutral medium. While such a model is statistically as good as accretion disc reflection, and it has been applied in an ad-hoc way to model the spectra of active galaxies, there is little or no physical motivation for such a component. As the source(s) of X-ray emission in AGN are thought to be very small and close to the central black hole, to partially cover the source the absorbing material would also have to be very small and very close to the X-ray source. It could only remain neutral in these circumstances if it were of extremely high density. Such a scenario has been suggested by Guilbert & Rees (1988). In their model, however, the clouds are optically thick and would then be a source of relativistic line emission and Compton reflection similar to the accretion disc, rather than neutral absorption. This cold cloud model has been explored further by Celotti, Fabian & Rees (1992) and Kuncic, Celotti & Rees (1997) who suggested that there may be ultra-dense small clouds of lower column density in the central regions of AGN, which may be magnetically confined (Rees 1987). These would then represent a plausible site for the patchy absorption. Future observations of Mrk 335 at high signal-to-noise ratio should be able to rule out partial covering as an alternative to accretion disc reflection, either on pure statistical grounds, or by tightening the constraints on the expected line emission from such gas. For the purposes of the present discussion, however, we concentrate on the interpretation that the broad residuals arise from a relativistic accretion disc.
6.1.1 Reflection from an ionised accretion disc
The 2-10 keV spectrum has been fitted with a single Gaussian line and with diskline models (see section 3.1). The large width of the Gaussian line corresponds to a velocity of the emitting material of 8.8 104 km s-1. Such fast motion implies that the line emitting material is located at a small distance from the source of X-ray radiation and therefore that the profile is modified by relativistic effects due to the gravitational field.
Significant emission is found both above and below the rest energy of known Fe K emission lines. The observation of redshifted emission is the classic signature of accretion disc lines (e.g. Tanaka et al. 1995) and furthermore it would be against any model in which the broad emission complex consists solely of a blend of narrow lines (e.g. Bianchi et al. 2003). The fact that we also see broad, blueshifted emission is of particular interest, as it tends to imply that the disc is either highly inclined to the line of sight, or highly ionised. The latter seems considerably more likely in the case of Mrk 335. We have demonstrated that neutral reflection models require an extremely high inclination ( 80∘), unlikely for a type I Seyfert such as this and inconsistent, at least in the simplest interpretations, with the large EW of the line.
Several ionised reflection models have been tried and they provide a physical interpretation of the data. They all converge to indicate that the disc is fairly uniformly illuminated over a large range of radii, i.e. 1.24-6 to 400 , and that it is viewed at an angle of 30∘. With the present data we cannot discriminate clearly between a spinning or non-spinning black hole. The inner radii in Table 1 indicate a very small value for the inner edge of the reflecting area of the disc, but there is certainly no strong requirement for emission within the last stable orbit of a Schwarzschild black hole. The Fe K line peak energy is consistent with 6.97 keV, implying that it is emitted by Fe at the highest ionisation stage (Fe xxvi). The line EW measured in section 3.1 is found to be 400 eV. Taking into account the power law slope in Mrk 335, this value is in good agreement with the scenario predicted by Nayakshin et al. (2000), who state that steep X-ray spectra (2) may lead to the production of an intense and highly ionised line.
6.2 Narrow absorption line
The narrow absorption line at 5.9 keV is certainly the most intriguing feature in the present data. It is detected at 99 per cent confidence, and identified as a resonance feature of very highly ionised iron (Fe xxvi), consistent with the lack of soft X-ray absorption features in the RGS spectrum (Gondoin et al. 2002) and of any other absorption in the EPIC data. The physical interpretation of the line does not depend on the continuum interpretation, so it is discussed separately in this section.
If the effect of the gravitational field is neglected and the energy shift is attributed to the velocity of the material, then the observed redshift of the line corresponds to a receding velocity of 50,000 km s-1 in the absorbing gas. Therefore, this number represents an upper limit to the flow speed. If the distance of the absorber was known with sufficient precision, it would be possible to disentangle the contribution of the gravitational shift more precisely. Unfortunately, no information on the allowed range of radii can be extracted from the line width, being it unresolved by the EPIC CCDs.
However, the narrowness of the line indicates that the interpretation of the redshift as due to inflowing gas may be preferable to the scenario proposed by Ruszkowski & Fabian (2000). In their model, an absorption Fe K line is produced in a rotating, rather than inflowing plasma in the vicinity of the black hole. The observed redshift of the line is then primarily due to gravitation, but the line profile is predicted to be significantly broadened, and indeed has a characteristic profile, as do accretion disc emission lines. Higher spectral resolution is required to rule out this hypothesis definitively, but the present data show no evidence for such broadening. In fairness we should point out that the inflow model presented in section 5 also predicts a very broad line for a continuous flow, and is only consistent with the data if we restrict the range of radii to be compatible with the narrowness of the observed line.
In the recent literature, there have been detections of redshifted and blueshifted absorption lines indicating the presence of high velocity gas in the centres of Active Galaxies. The detections of blueshifted absorption features in quasar spectra have been interpreted as relativistic outflows of matter originating closely to the central black hole (PG1211+143 and PG0844+349 Pounds et al. 2003a, 2003b, PDS 456 Reeves et al. 2003, APM 08279+5255 and PG1115+080 Chartas et al. 2002, 2003). We note, however, that some of these claims may be explained with an alternative hypothesis of features due to local gas in the Galaxy rather than intrinsic to the quasars (McKernan et al. 2005).
Most of the redshifted lines instead, are unambiguously interpreted as resonant lines of highly ionised Fe originated in absorbers intrinsic to the nucleus (NGC 3516, Nandra et al. 1999, Mrk 509, Dadina et al. 2005, E 1821+643, Yaqoob & Serlemitsos 2005, Q0056-363, Matt et al. 2005, PG1211+143, Reeves et al. 2005). The nature of the plasma producing these features is currently unclear. Dadina et al. (2005) suggested that they may be due to clumps of matter ejected from the disc, as expected in the “aborted jets” model proposed by Ghisellini et al. (2004). A similar scenario has been suggested by Turner et al. (2002, 2004) to explain shifted narrow emission lines in Seyfert spectra. The detailed geometry of the flow is as yet very obscure, but the transitory behaviour of most of the spectral features seems to be in favour of an unsteady absorber rather than, say, a continuous wind.
Whatever their origin, observations of redshifted Fe K absorption lines clearly have the potential to add greatly to our knowledge of the gas flow in the innermost regions of AGN.
6.3 Conclusions from the models
Our simple inflow models lead us to two primary conclusions. Firstly, a large scale radial inflow which is highly ionised by a central source is not consistent with the data: although a strong inverse P Cygni Fe xxvi K line is predicted by such a model, it is too broad and insufficiently redshifted to explain the Mrk 335 observation.
Secondly, the absorption line can be well described by an inflow which extends over only a limited radial extent, approximately 24 – 48 from the black-hole. In this model, the red-shift of the absorption line is dominated by velocity shift rather than gravitational shift and the flow is highly ionised, explaining why it only produces detectable absorption lines in the X-ray band. It is interesting to note that quasi-spherical flows with significantly higher densities (as would be required to lower the ionisation state and obtain absorption lines at softer energies) would be unphysical since the models considered here are already close to the Eddington limit. Thus inflows which subtend a substantial fraction of the solid angle seen by the central black hole are only ever likely to be readily detectable in the high energy Fe lines.
Clearly, the particular model and velocity-law considered – that of spherical inflow from infinity – is very simplistic. More realistic scenarios which would result in rather similar absorption line profiles would include an infalling blob of gas or accretion column occupying approximately the same radial region as that considered in the successful spherical model (i.e. 24 – 48 ). However, more complete investigations of these scenarios would require more complex modelling and, much more importantly, significantly higher quality data with greater spectral resolution.
Acknowledgments
This paper is based on observations obtained with the XMM-Newton satellite, an ESA science mission with contributions funded by ESA Member States and USA. We thank the anonymous referee for his comments which contributed to improve this paper and we thank the XMM-Newton team for supporting the data analysis. The authors wish to thank Prof. Andy Fabian for providing the relativistic blurring codes. A.L.L. is grateful to Paul O’Neill for many suggestions about the line significance analysis, to Giovanni Miniutti for stimulating discussion on this paper and to Maria Santos-Lleo for her help in the treatment of the data. This work was undertaken while S.A.S. was a UK Particle Physics and Astronomy Research Council supported postdoctoral research assistant at Imperial College London. A.L.L. acknowledges financial support from the Royal Astronomical Society, the Angelo Della Riccia Foundation and the Astrophysics Group at Imperial College London.
References
- Ballantyne, Iwasawa, & Fabian (2001) Ballantyne D. R., Iwasawa K., Fabian A. C., 2001, MNRAS, 323, 506
- Blustin et al. (2005) Blustin A. J., Page M. J., Fuerst S. V., Branduardi-Raymont G., Ashton C. E., 2005, A&A, 431, 111
- Boller et al. (2002) Boller T., et al., 2002, MNRAS, 329, L1
- Boroson & Green (1992) Boroson T. A., Green R. F., 1992, ApJS, 80, 109
- Boroson (2002) Boroson T. A., 2002, ApJ, 565, 78
- Bianchi et al. (2001) Bianchi S., Matt G., Haardt F., Maraschi L., Nicastro F., Perola G. C., Petrucci P. O., Piro L., 2001, A&A, 376, 77
- Bianchi et al. (2003) Bianchi S., Matt G., Balestra I., Perola G. C., 2003, A&A, 407, L21
- Celotti, Fabian, & Rees (1992) Celotti A., Fabian A. C., Rees M. J., 1992, MNRAS, 255, 419
- Chartas et al. (2002) Chartas G., Brandt W. N., Gallagher S. C., Garmire G. P., 2002, ApJ, 579, 169
- Chartas, Brandt, & Gallagher (2003) Chartas G., Brandt W. N., Gallagher S. C., 2003, ApJ, 595, 85
- Dadina et al. (2005) Dadina M., Cappi M., Malaguti G., Ponti G., de Rosa A., 2005, A&A, 442, 461
- Elvis (2000) Elvis M., 2000, ApJ, 545, 63
- Fabian et al. (1989) Fabian A. C., Rees M. J., Stella L., White N. E., 1989, MNRAS, 238, 729
- Fabian et al. (2000) Fabian A. C., Iwasawa K., Reynolds C. S., Young A. J., 2000, PASP, 112, 1145
- Fabian et al. (2002) Fabian A. C., et al., 2002, MNRAS, 335, L1
- Gallo et al. (2004) Gallo L. C., Tanaka Y., Boller T., Fabian A. C., Vaughan S., Brandt W. N., 2004, MNRAS, 353, 1064
- George & Fabian (1991) George I. M., Fabian A. C., 1991, MNRAS, 249, 352
- George et al. (1998) George I. M., Turner T. J., Netzer H., Nandra K., Mushotzky R. F., Yaqoob T., 1998, ApJS, 114, 73
- Ghisellini, Haardt, & Matt (1994) Ghisellini G., Haardt F., Matt G., 1994, MNRAS, 267, 743
- Ghisellini, Haardt, & Matt (2004) Ghisellini G., Haardt F., Matt G., 2004, A&A, 413, 535
- Gierliński & Done (2004) Gierliński M., Done C., 2004, MNRAS, 349, L7
- Gondoin et al. (2002) Gondoin P., Orr A., Lumb D., Santos-Lleo M., 2002, A&A, 388, 74
- Guilbert & Rees (1988) Guilbert P. W., Rees M. J., 1988, MNRAS, 233, 475
- Halpern (1984) Halpern J. P., 1984, ApJ, 281, 90
- Krolik, Madau, & Zycki (1994) Krolik J. H., Madau P., Zycki P. T., 1994, ApJ, 420, L57
- Kuncic, Celotti, & Rees (1997) Kuncic Z., Celotti A., Rees M. J., 1997, MNRAS, 284, 717
- Iwasawa et al. (1996) Iwasawa K., et al., 1996, MNRAS, 282, 1038
- Iwasawa, Miniutti, & Fabian (2004) Iwasawa K., Miniutti G., Fabian A. C., 2004, MNRAS, 355, 1073
- Laor (1991) Laor A., 1991, ApJ, 376, 90
- Leahy & Creighton (1993) Leahy D. A., Creighton J., 1993, MNRAS, 263, 314
- Lucy (2002) Lucy L. B., 2002, A&A, 384, 725
- Lucy (2003) Lucy L. B., 2003, A&A, 403, 261
- Lynden-Bell (1969) Lynden-Bell D., 1969, Natur, 223, 690
- Magdziarz & Zdziarski (1995) Magdziarz P., Zdziarski A. A., 1995, MNRAS, 273, 837
- Matt, Fabian, & Ross (1993) Matt G., Fabian A. C., Ross R. R., 1993, MNRAS, 262, 179
- Matt, Fabian, & Ross (1996) Matt G., Fabian A. C., Ross R. R., 1996, MNRAS, 278, 1111
- Matt et al. (2005) Matt G., Porquet D., Bianchi S., Falocco S., Maiolino R., Reeves J. N., Zappacosta L., 2005, A&A, 435, 857
- Merloni & Fabian (2001) Merloni A., Fabian A. C., 2001, MNRAS, 328, 958
- McKernan, Yaqoob, & Reynolds (2005) McKernan B., Yaqoob T., Reynolds C. S., 2005, MNRAS, 658
- Mitsuda et al. (1984) Mitsuda K., et al., 1984, PASJ, 36, 741
- Nandra & Pounds (1994) Nandra K., Pounds K. A., 1994, MNRAS, 268, 405
- Nandra et al. (1997) Nandra K., George I. M., Mushotzky R. F., Turner T. J., Yaqoob T., 1997, ApJ, 477, 602
- Nandra et al. (1999) Nandra K., George I. M., Mushotzky R. F., Turner T. J., Yaqoob T., 1999, ApJ, 523, L17
- Nayakshin, Kazanas, & Kallman (2000) Nayakshin S., Kazanas D., Kallman T. R., 2000, ApJ, 537, 833
- Nayakshin & Kallman (2001) Nayakshin S., Kallman T. R., 2001, ApJ, 546, 406
- Peterson et al. (2004) Peterson B. M., et al., 2004, ApJ, 613, 682
- Ponti et al. (2004) Ponti G., Cappi M., Dadina M., Malaguti G., 2004, A&A, 417, 451
- Porquet et al. (2004) Porquet D., Reeves J. N., Uttley P., Turner T. J., 2004, A&A, 427, 101
- Pounds et al. (2003) Pounds K. A., King A. R., Page K. L., O’Brien P. T., 2003, MNRAS, 346, 1025
- Pounds et al. (2003) Pounds K. A., Reeves J. N., King A. R., Page K. L., O’Brien P. T., Turner M. J. L., 2003, MNRAS, 345, 705
- Protassov et al. (2002) Protassov R., van Dyk D. A., Connors A., Kashyap V. L., Siemiginowska A., 2002, ApJ, 571, 545
- Rees (1987) Rees M. J., 1987, MNRAS, 228, 47P
- Reeves et al. (2001) Reeves J. N., Turner M. J. L., Pounds K. A., O’Brien P. T., Boller T., Ferrando P., Kendziorra E., Vercellone S., 2001, A&A, 365, L134
- Reeves, O’Brien, & Ward (2003) Reeves J. N., O’Brien P. T., Ward M. J., 2003, ApJ, 593, L65
- Reeves et al. (2004) Reeves J. N., Nandra K., George I. M., Pounds K. A., Turner T. J., Yaqoob T., 2004, ApJ, 602, 648
- Reeves et al. (2005) Reeves J. N., Pounds K., Uttley P., Kraemer S., Mushotzky R., Yaqoob T., George I. M., Turner T. J., 2005, ApJ, 633, L81
- Reynolds (1997) Reynolds C. S., 1997, MNRAS, 286, 513
- Reynolds & Nowak (2003) Reynolds C. S., Nowak M. A., 2003, PhR, 377, 389
- Ross & Fabian (1993) Ross R. R., Fabian A. C., 1993, MNRAS, 261, 74
- Ross, Fabian, & Young (1999) Ross R. R., Fabian A. C., Young A. J., 1999, MNRAS, 306, 461
- Ross & Fabian (2005) Ross R. R., Fabian A. C., 2005, MNRAS, 358, 211
- Ruszkowski & Fabian (2000) Ruszkowski M., Fabian A. C., 2000, MNRAS, 315, 223
- Sim (2005) Sim S. A., 2005, MNRAS, 356, 531
- Tanaka et al. (1995) Tanaka Y., et al., 1995, Nature, 375, 659
- Tanaka et al. (2004) Tanaka Y., Boller T., Gallo L., Keil R., Ueda Y., 2004, PASJ, 56, L9
- Turner & Pounds (1989) Turner T. J., Pounds K. A., 1989, MNRAS, 240, 833
- Turner et al. (1993) Turner T. J., et al., 1993, ApJ, 407, 556
- Turner, George, & Mushotzky (1993) Turner T. J., George I. M., Mushotzky R. F., 1993, AdSpR, 13, 387
- Turner et al. (2002) Turner T. J., et al., 2002, ApJ, 574, L123
- Turner, Kraemer, & Reeves (2004) Turner T. J., Kraemer S. B., Reeves J. N., 2004, ApJ, 603, 62
- Turner et al. (2005) Turner T. J., Kraemer S. B., George I. M., Reeves J. N., Bottorff M. C., 2005, ApJ, 618, 155
- Wilms et al. (2001) Wilms J., Reynolds C. S., Begelman M. C., Reeves J., Molendi S., Staubert R., Kendziorra E., 2001, MNRAS, 328, L27
- Yaqoob & Padmanabhan (2004) Yaqoob T., Padmanabhan U., 2004, ApJ, 604, 63
- Yaqoob & Serlemitsos (2005) Yaqoob T., Serlemitsos P., 2005, ApJ, 623, 112
- Young et al. (2005) Young A. J., Lee J. C., Fabian A. C., Reynolds C. S., Gibson R. R., Canizares C. R., 2005, ApJ, 631, 733