The Diverse Properties of the Most Ultraviolet Luminous Galaxies Discovered by the Galaxy Evolution Explorer
Abstract
We report on the properties of a sample of ultraviolet luminous galaxies (UVLGs) selected by matching the Galaxy Evolution Explorer (GALEX) All-sky Imaging and Medium Imaging Surveys with the Sloan Digital Sky Survey Third Data Release. The overlap between these two surveys is roughly 450 square degrees. Out of 25362 galaxies (with SDSS spectroscopy) between detected by GALEX, there are 215 galaxies with L⊙ at 1530 Å (observed wavelength). The properties of this population are well correlated with ultraviolet surface brightness. We find that the galaxies with low UV surface brightness are primarily large spiral systems with a mixture of old and young stellar populations, while the high surface brightness galaxies consist primarily of compact starburst systems, with an approximate boundary at a surface brightness of L⊙ kpc-2. The large galaxies appear to be the high-luminosity tail of the galaxy star formation function, and owe their large luminosity to their large surface area. In terms of the behavior of surface brightness with luminosity, size with luminosity, the mass-metallicity relation, and other parameters, the compact UVLGs clearly depart from the trends established by the full sample of galaxies. The subset of compact UVLGs with the highest surface brightness ( L⊙ kpc-2; “supercompact UVLGs”) have characteristics that are remarkably similar to Lyman Break Galaxies at higher redshift. They are much more luminous (and thus have much higher star formation rates) than typical local ultraviolet-bright starburst galaxies and blue compact dwarf galaxies. They have metallicities that are systematically lower than normal galaxies of the same stellar mass, indicating that they are less chemically evolved. In all these respects, they are the best local analogs for Lyman Break Galaxies.
1 Introduction
Over the past decade enormous progress has been made toward mapping the cosmological history of star formation in the universe (e.g., Madau et al. 1996; Giavalisco et al. 2004). This has mainly been accomplished using large samples of high-redshift galaxies selected by their rest-frame ultraviolet (UV) colors (e.g., Steidel et al 1996, 2003; Dickinson et al. 2004). These surveys indicate that the global star formation rate of the universe has been in decline since , and was generally constant at higher redshift out to at least (Giavalisco et al., 2004).
This picture still contains some uncertainty resulting from several factors. The star formation rate density at low redshift () has been determined through different techniques ( H luminosity) than those used for higher redshift galaxies ( rest-frame ultraviolet luminosity). These techniques are affected differently by extinction and radiative transfer effects, and they fundamentally probe star formation over different time scales.
One way around this problem is to obtain rest-frame ultraviolet (UV) measurements for a large sample of galaxies at low redshift, enabling the measurement of star formation rates using the same techniques that are used at higher redshift. This requires a UV telescope in space with a large field of view, something that has not been available until the Galaxy Evolution Explorer (GALEX) mission (Martin et al., 2005). GALEX is obtaining UV fluxes for more than galaxies in the redshift range of . Initial results on the UV luminosity density show strong evolution from to , with the strongest evolution occurring in the most UV luminous galaxies (Schiminovich et al., 2005; Arnouts et al., 2005). The fraction of galaxies with L∗,z=3 fell by a factor of 30 from to (using L L⊙; Steidel et al. 1999).
These UV luminous galaxies at high redshift are more commonly called Lyman Break Galaxies (LBGs; Steidel et al. 1999). These high-redshift galaxies are so named because they are identified by the effects of the Lyman break on their broadband colors (Steidel & Hamilton, 1993). LBGs are UV bright galaxies undergoing intense star formation with low to moderate stellar masses (log to M⊙), and are candidates for the precursors of present-day elliptical galaxies (see e.g, Giavalisco 2002). LBGs are common at , and they are clearly important as the sites of a significant fraction of all the star formation in the universe. Since strong evolution has made objects like LBGs extremely rare in the local universe, all of the information on this important galaxy population has come from very distant samples, which are inherently difficult to study. Thus, there has been little detailed information available on the processes driving the evolution of star formation in the population of LBGs.
Using local UV-bright starbursts as local analogs to LBGs has contributed significantly toward understanding these objects (Heckman et al., 1998; Meurer et al., 1999). However, local starbursts differ from LBGs in important ways. Local starbursts are usually dwarf galaxies or small (sub-kpc) regions in the nuclei of larger galaxies, while LBGs have typical sizes of a few kpc (Ferguson et al., 2004). Luminous local starbursts are usually very dusty systems in which only a small fraction of the UV light escapes, while LBGs with similar bolometric luminosities (star formation rates) typically contain modest amounts of dust (e.g. Reddy et al. 2006; Erb et al. 2006b). Given these differences, it is not clear that the conditions in local starbursts or the triggers of star formation are identical to those in LBGs, and so there is a need for better LBG analogs in the local universe.
Since LBGs are found in part by their large UV luminosity, LBG analogs in the local universe should also be UV luminous. The large area UV sky surveys being carried out by GALEX provide an ideal data set for finding rare UV luminous galaxies in the local universe. Heckman et al. (2005; hereafter Paper I) described the properties of the most UV luminous galaxies (UVLGs) in the local universe based on cross-matching the initial GALEX surveys with the Sloan Digital Sky Survey (SDSS) first data release (DR1; Abazajian et al. 2003). The UVLGs were composed of two basic types of galaxies: Large UVLGs, which are characterized by lower UV surface brightness and high mass, and compact UVLGs, which have higher UV surface brightness and lower mass. Many of the compact UVLGs have properties very similar to LBGs.
Although this sample was very illuminating, several questions remain. The extent of the similarity between the compact UVLGs and LBGs is a crucial question. More generally, it is not known whether these galaxies are truly a distinct population of objects in an earlier phase of evolution, i.e., remnants of the epoch of galaxy formation, or whether they are simply the high end of the UV luminosity function. Many of these questions could be better addressed if there were more such galaxies available for study, so we present an analysis of a larger sample of UVLGs, based on more recent GALEX and SDSS data.
2 Data
2.1 Ultraviolet Data
Since its launch in April, 2003, GALEX has been conducting several surveys of the UV sky. In this paper we make use of the GALEX All-sky Imaging Survey (AIS) and Medium-Deep Imaging Survey (MIS). The data were taken from the first public release of GALEX data (GR1) available at the Multimission Archive at Space Telescope (MAST). Details on the GALEX mission and surveys are given in Martin et al. (2005).
The GALEX data include far-ultraviolet (FUV; Å, Å) and near-ultraviolet (NUV; Å, Å) images with a circular field of view with radius ′. The spatial resolution is ′′. Details of the GALEX satellite and data characteristics can be found in Morrisey et al. (2005).
The data were processed through the GALEX reduction pipeline at the California Institute of Technology. The pipeline reduces the data and automatically detects, measures, and produces catalogs of FUV and NUV fluxes for sources in the GALEX images.
2.2 Optical data
The GALEX catalogs were then matched to the SDSS Third Data Release (DR3; Abazajian et al. 2005) spectroscopic sample. The area of the overlap region between GR1 and DR3 is about 450 square degrees (Bianchi et al., 2006). The SDSS catalog provides (among many other available parameters) magnitudes, spectroscopic redshifts, concentration parameters, observed half-light radii and model-fit exponential scale lengths. To be included in our final matched catalog, we required that each source have a spectroscopic redshift in the range , and that the SDSS source be spectroscopically classified as a galaxy, excluding objects classified by the SDSS pipeline as QSOs or Type I (broad line) AGN. The resulting GR1/DR3 sample contains 25362 galaxies. Of these, 18463 have 3 FUV detections. The remaining galaxies were detected in the NUV images only.
With the distances estimated from the SDSS redshift, the FUV (and NUV) luminosity for each galaxy is known. Following Paper I, galaxies with L⊙ qualify as UV luminous galaxies111Throughout this paper we use km s-1, , and ., where is the luminosity at the observed wavelength of 1530 Å. This luminosity is for (Wyder et al., 2005) and for LBGs at (Steidel et al., 1999). There are 235 galaxies in the GR1/DR3 sample that meet this criterion. We then inspected the SDSS spectra of these galaxies to eliminate broad line (Type I) AGN that were missed by the SDSS pipeline, as well as objects with BL Lac-type spectra (UV bright but with weak or non-existent emission lines). Type II AGN in the sample are discussed in section 4.4. The 215 galaxies that remain are hereafter referred to as ultraviolet luminous galaxies (UVLGs). These galaxies span the redshift range from to .
A large number of galaxy parameters derived from the SDSS spectra are available in the value-added catalogs produced by the SDSS collaboration. These catalogs are available at the SDSS website at the Max Planck Institute (http://www.mpa-garching.mpg.de/SDSS). From these catalogs we use the emission line fluxes, widths, and derived metallicities. For more information on the derivation of these parameters, see Kauffmann et al. (2003a, b, c), Brinchmann et al. (2004), and Tremonti et al. (2004). These catalogs do not include metallicities for galaxies with an AGN contribution since this can strongly affect the line strengths, so only a subset of our sample have metallicity determinations. In addition, some galaxies have poor line flux measurements because the emission lines in the fiber aperture are weak or non-existent, e.g., in galaxies with no star formation in the central region of the galaxy. Thus line flux measurements exist for only a subset of our sample.
2.3 Spectral Energy Distribution Modeling
To gain further information about the properties of the galaxies in our sample, we compared the observed optical and UV properties of our sample to a library of model spectral energy distributions (SEDs), following Salim et al. (2005). This was done by first constructing the broadband optical and UV SEDs from the SDSS and GALEX magnitudes. Each observed SED was then compared to an extensive library of SEDs generated by the Bruzual & Charlot (2003) population synthesis code. Each model galaxy is based on a star formation history composed of an exponentially declining star formation rate (SFR) with superimposed bursts of star formation, and includes the effects of attenuation by dust (see Charlot & Fall 2000). The library contains models at each of five evenly spaced redshifts from to , and the grid of models was constructed to span the likely range of star formation histories.
The goodness of fit for a given model to an observed SED is then translated to a probability that the parameters for that model apply to the galaxy. Thus the parameters of the best fitting model will have the highest probability, and a probability distribution can be constructed for the entire library at the appropriate redshift. From this the median and % confidence limits on each parameter can be determined. This was done for a list of parameters including stellar mass and star formation rate over a range of timescales. For more information on the SED fitting process, see Salim et al. (2005). In this paper the stellar masses and star formation rates were determined through SED fitting.
3 Properties of the GR1/DR3 Galaxy Sample
The GALEX-SDSS matched catalog provides a valuable resource for studying the UV-optical properties of star-forming galaxies in the local universe. In a future paper we will report on the analysis of the entire galaxy sample. Here we concentrate on the relationship between UVLGs and the broader galaxy population.
The galaxy sample considered here should be nearly devoid of unobscured (type I) AGN, so the dominant source of the UV light detected by GALEX is massive stars. The UV luminosity of a galaxy therefore traces the total amount of star formation in that galaxy over the past years (Martin et al., 2005). We also have measurements of the sizes of these galaxies. Most of these galaxies are only marginally resolved in the GALEX images, so we used the half-light radii measured on the higher-resolution SDSS images. The SDSS -band was chosen because it is the closest in wavelength to the GALEX bands and therefore the most likely to reflect the true spatial extent of star-formation. In most cases we use the scale length from the seeing-corrected exponential model fit calculated by the SDSS pipeline as the half-light radius. However, for well-resolved galaxies we found that the seeing-corrected radius derived from the exponential model fits is systematically larger than the directly observed half-light radius. We found that this occurs for galaxies with half-light radii larger than about 2.2′′. We thus use the observed -band half-light radius as for galaxies larger than 2.2′′, and the seeing-corrected scale length as for galaxies smaller than 2.2′′. We can then calculate the effective surface brightness by dividing one-half of the luminosity by the area of the galaxy enclosed by the half-light radius ().
Figure 1 shows a normalized contour plot of the FUV surface brightness versus FUV luminosity for the 18463 galaxies in the GR1/DR3 sample that were detected in the FUV images. The luminosity bins were normalized to have the same number of galaxies in each bin, thus clarifying the dependence of surface brightness on luminosity by removing the effects of having a smaller number of galaxies at the low and high luminosity ends of the distribution.
The plot shows a well-defined trend of slightly increasing surface brightness with increasing luminosity over the entire luminosity range. However, at the high luminosities corresponding to the UVLGs there is an anomalous population of galaxies that defy the general trend by having a much higher surface brightness than would be expected given their luminosity. These galaxies have L⊙ kpc-2. Only among the UVLGs are galaxies with the highest surface brightnesses ( L⊙ kpc-2) relatively common.
Figure 2 shows the dependence of half-light radius on luminosity. The surface brightness parameter shown in Figure 1 depends on the half-light radius, so Figure 2 is an alternative representation of Figure 1. Over most of the range in luminosity the radius increases with increasing luminosity. Above L⊙ there is a group of galaxies that do not obey this trend in the sense that they are too small for their luminosity. The dashed lines in Figure 2 are lines of constant , and the galaxies responsible for this deviation from the trend have L⊙ kpc-2.
These two figures show that in general galaxies with higher UV luminosity are larger and have somewhat higher surface brightness than their less luminous counterparts. At high luminosities, however, some galaxies behave differently. They have small radii, but this is more than compensated by their increased surface brightness to put them among the most UV luminous galaxies in the sample. This is a strong indication that these UVLGs are distinct from the general galaxy population. By contrast, UVLGs with lower surface brightness do not distinguish themselves from the full sample of galaxies except by their luminosity. They appear to be the largest and therefore most luminous normal galaxies.
Figure 3 shows how the UV surface brightness changes with stellar mass, as determined from the SED model fitting (Salim et al., 2005). In general the stellar mass determined in this manner agrees to within a factor of 2 with the dynamical mass calculated as , where is the standard deviation of the gas velocity measured from the emission lines. The coefficient 3.4 was taken from Erb et al. (2006) and represents a realistic estimate of the mass distribution for LBGs. The UV surface brightness is relatively constant over a wide range of stellar masses, and then slowly falls above a mass of M⊙. This implies that the more massive galaxies have correspondingly larger sizes over which the young stellar population is distributed. The drop in surface brightness above M⊙ may be related to the relatively abrupt transition in the galaxy population at this mass-scale between young disk-dominated galaxies and old bulge-dominated ones (e.g. Kauffmann et al. 2003b).
The points shown in Figure 3 are the locations of individual UVLGs. Unlike the galaxy population as-a-whole, the UVLGs show a clear inverse correlation between surface brightness and mass. We have already pointed out that this fact indicates that the more massive UVLGs owe their large luminosities to their large mass. The less massive UVLGs have high UV surface brightnesses indicative of intense star-formation. Figure 3 shows how the UVLGs relate to the rest of the sample in terms of mass (but keep in mind that the contours are normalized by the number of galaxies in each mass bin). The UVLGs with L⊙ kpc-2 are among the most massive star-forming galaxies in the GR1/DR3 sample, with log M⊙. While these are the lower surface brightness component of the UVLG sample, they are still somewhat offset toward higher surface brightness than the full sample (they are not low surface brightness galaxies). In the main, their properties appear to be similar to those of large, disk galaxies (they are the extrema of the population).
The UVLGs with L⊙ kpc-2 are generally lower mass systems (log M⊙). They clearly stand out from the full sample by having much higher surface brightness than would be expected for normal galaxies of similar mass. This is even more obvious for galaxies with L⊙ kpc-2, which would qualify as LBGs based on their FUV surface brightness.
Based on the analysis above, the UVLG population can be thought of as two very different types of galaxies. The high-surface brightness systems (“compact UVLGs”) have high star formation rates per unit area and would be called starburst galaxies, while the low surface brightness systems (“large UVLGs”) are large spirals, with high rates of total star formation but low rates of star formation per unit area. There is no clear transition from one population to the other, but a surface brightness value of L⊙ kpc-2 serves as a useful boundary. There are intermediate cases that do not fit cleanly into either category. Figure 3 shows that this surface brightness boundary corresponds to a stellar mass of roughly M⊙ (similar to the mass scale that divides the bimodal galaxy population as-a-whole – e.g. Kauffmann et al. 2003b). Using this criterion there are 110 large UVLGs and 105 compact UVLGs in the GR1/DR3 sample. These two diverse populations were recognized in Paper I, but we can now place them firmly in the context of the overall galaxy population.
Throughout the rest of this paper we will distinguish between large and compact UVLGs. Note, however, that while the compact UVLGs have the properties of intense starbursts, not all of them have FUV surface brightnesses high enough to be considered typical LBGs, which generally have L⊙ kpc-2. We will consider the compact UVLGs that meet this more stringent surface brightness criterion as possible LBG analogs, and will refer to them as “supercompact UVLGs”. The GR1/DR3 sample contains 35 supercompact UVLGs.
4 Properties of Ultraviolet Luminous Galaxies
Since the UVLG sample was chosen based on an ultraviolet luminosity criterion, they are all expected to have high star formation rates. As in Paper I, the majority of UVLGs (83%) have concentration parameters , where is defined as , the ratio of the radius containing 90% of the Petrosian -band luminosity to that containing 50%. These low concentration parameters are indicative of disk systems, as expected for a sample of star-forming galaxies. Yet as was made clear in the previous section, UVLGs span a wide range of properties. In this section we explore the properties of UVLGs. The properties of the 215 UVLGs are listed in Table 1.
4.1 Ultraviolet Surface Brightness
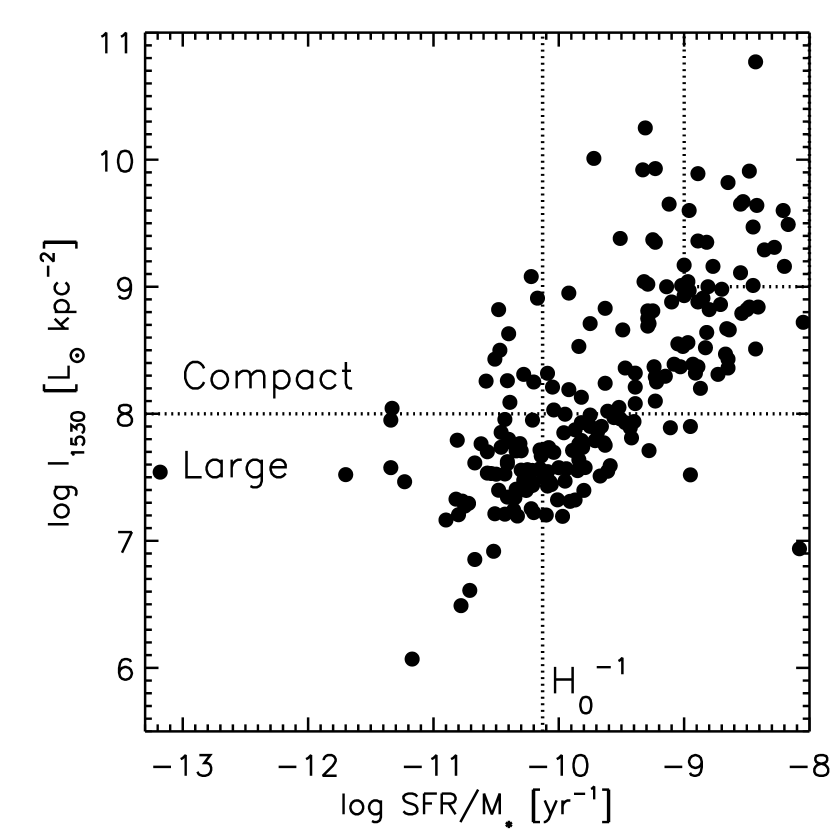
Figure 4 plots the FUV surface brightness of the 215 UVLGs against the FUV luminosity. The galaxies were chosen to be luminous, but they span a wide range in surface brightness, and there is no correlation between luminosity and surface brightness. This implies that the UVLGs span a similarly large range of size. This is confirmed in Figure 5, which plots the luminosity against the half-light radius. UVLGs range in half-light radius from less than a kpc to kpc. The dotted lines in Figure 5 show a constant surface brightness of L⊙ kpc-2 and L⊙ kpc-2, the latter being the lower limit seen in LBGs at (Giavalisco, 2002). Only a fraction of the UVLGs have surface brightnesses that rival those of LBGs, even though they all have LBG-like luminosities.
The FUV surface brightness is related to the star formation intensity, the star formation rate per unit area. Figures 4 and 5 show then that only a subset of the UVLGs are luminous because they have high star formation intensities. The rest owe their high luminosities to their large size, i.e., they have modest levels of star formation intensity spread over a large area.
This is also apparent in Figure 3, which shows more clearly the correlation between surface brightness and stellar mass noted above. The UVLGs with low surface brightness are the most massive, while the high surface brightness UVLGs are low-mass systems. The typical mass and surface brightness range of LBGs is shown in the figure (Shapley et al., 2001; Papovich et al., 2001; Giavalisco, 2002). Figures illustrate the fact that UVLGs span a continuous range of properties, i.e., there is no clear demarcation between the large and compact samples. The division of the samples at a surface brightness of L⊙ kpc-2 is an arbitrary boundary.
4.2 Star Formation and Attenuation by Dust
Figure 6 shows the FUV- color and NUV- color for the 215 UVLGs as a function of surface brightness. Both colors are well-correlated with surface brightness, with the brightest galaxies having the bluest color. This agrees with the idea that the UV-optical colors are sensitive to the ratio of current to past star formation. Salim et al. (2005) showed the NUV- in particular is a good tracer of the star formation rate parameter , which is the current SFR divided by the past-average SFR. The blue color of the high surface brightness UVLGs can be understood if they are undergoing intense starbursts which are much more significant than the past average rate of star formation. The FUV surface brightness appears to be a good indicator of star formation intensity for UV-selected galaxies. The typical colors of LBGs are also indicated in the plot (Shapley et al., 2001; Papovich et al., 2001; Giavalisco, 2002).
Figure 7 shows the FUV surface brightness versus the specific star formation rate (star formation rate normalized by stellar mass). The extinction-corrected star formation rates were determined by SED model fitting. We have also calculated star formation rates using the H luminosity in the SDSS spectra using the recipe given in Kennicutt (1998), these values generally agree within a factor of 2, which is quite good considering that the H-alpha measurements were taken through 3′′ fibers. The specific star formation rate relates the current to past star formation, and the inverse of this quantity is the “galaxy building time,” the time it would take to build up the current stellar mass at the current SFR. The specific star formation rate is clearly correlated with the FUV surface brightness, with the high surface brightness systems generally have the highest specific SFRs and short building times, indicating that these are starburst systems. The large UVLGs have galaxy building times of roughly a Hubble time, as expected for a galaxy that has been built up over the age of the universe at a constant or slowly varying rate of star formation. Galaxy building times of less than 1 Gyr are typical for LBGs (Shapley et al., 2001; Papovich et al., 2001; Giavalisco, 2002), and the high surface brightness UVLGs overlap this range. However some of the high surface brightness systems have lower specific SFRs and longer building times than typical LBGs, which suggests that they have had significant star formation prior to the current burst. imaging of LBGs indicates that they do not have significant populations of older stars (Barmby et al., 2004), suggesting that LBGs are undergoing their first major burst of star formation. If this is the case, then these systems with longer building times may not be true analogs for LBGs. However, there is a significant fraction of the high-surface brightness systems that fall in the boundaries set by the LBGs, and these may be excellent analogs.
Figure 8 shows the FUV attenuation as a function of surface brightness. The FUV attenuation was determined using the Balmer decrement and the Calzetti (2001) starburst attenuation law. The compact UVLGs are in the range , indicating that a relatively large fraction () of the UV light escapes. The large UVLGs are mostly in the range from 0 to magnitudes of attenuation. Figure 8 shows that compact UVLGs have a lower amount of attenuation on average than do large UVLGs, and the higher surface brightness compact UVLGs have still lower average extinction values. We note that this method of determining attenuation values uses the SDSS fiber spectra and may be sensitive to aperture effects. The fibers capture most of the light from the compact UVLGs, so this should only be an issue for the large UVLGs, where we are measuring the attenuation in the central core of the galaxy. Figure 8 also shows the typical range of FUV attenuation seen in LBGs (Shapley et al., 2001; Papovich et al., 2001).
4.3 Metallicity
Figure 9 shows two determinations of the mass vs. metallicity relation for the entire GR1/DR3 sample. The left panel shows the relation determined via the method of Tremonti et al. (2004). This method makes use of a grid of models, which combine the Bruzual & Charlot (2003) population synthesis code with photo-ionization models of H II regions. The methodology is described in detail in Charlot & Longhetti (2001). Metallicities are constrained by fitting all the strong emission lines in the SDSS spectra. Only 129 of the UVLGs have metallicity determinations from the SDSS spectra, because galaxies with an AGN contribution to their spectra were excluded. The well-known mass-metallicity relation (Tremonti et al., 2004) is apparent in Figure 9, and the best fit to the Tremonti et al. sample is shown as a dotted line. The UVLGs also show a relation between mass and metallicity, but it is offset from the general sample. At high masses ( M⊙) most of the UVLGs have metallicities similar to those of normal galaxies. Most of these objects are the large UVLGs, which we have argued are just the UV-bright tail of the population of normal high-mass star forming galaxies. Their relatively normal metallicities support this idea. At lower masses (where the sample is primarily the compact UVLGs), the slope of the mass-metallicity relation for the UVLGs is significantly steeper than that of the overall galaxy population. In the mass range to M⊙, the compact UVLGs have metallicities a factor of two to three lower than normal galaxies of the same mass.
Selection on the basis of high UV luminosity could clearly bias the sample against dusty objects, and the dust/gas ratio will be larger for higher metallicity. Thus, selection effects could make a UV-bright sample have systematically lower metallicity. While such an effect may be present, it does not explain the mass-dependence of the offset between the mass-metallicity relation for the sample as-a-whole, and that of the UVLGs.
It is very interesting to compare the mass-metallicity relation for the UVLGs to what is found for UV-bright galaxies at higher redshifts. The form of the mass-metallicity relation for the UVLGs is similar to that found by Savaglio et al. (2005), who investigated a sample of star-forming galaxies at . Their relation is shown in the left panel of Figure 9. They interpreted the change in the form of the mass-metallicity relation from to in terms of the “down-sizing” of the galaxy population. Massive galaxies have essentially the same metallicity at 0.1 and 0.7 because this population has already come near the end-point of its evolution by . The strong chemical evolution at late times seen in the low mass galaxies is because they are still converting significant mass from gas into stars at the present time. Applied to the compact UVLGs, this would suggest that they are relatively unevolved compared to typical galaxies of the same mass. Alternatively, perhaps the compact UVLGs are UV-bright because they are experiencing a burst of star formation triggered by the infall of metal-poor gas.
Erb et al. (2006) have measured the mass-metallicity relation for LBGs at . They find that this relation has evolved considerably compared to the local universe, with LBGs having systematically lower metallicities than present-day galaxies by a factor of about two for all masses. Erb et al. estimate metallicity using the method, which uses the [N II]/H ratio, as calibrated by Pettini & Pagel (2004). The resulting metallicities are known to be systematically lower than those obtained using the Tremonti et al. (2004) method. To fairly compare the UVLGs and LBGs, we also plot our mass-metallicity relation based on the Pettini & Pagel (2004) method (right panel of Figure 9). While the shape of the relation changes, the offset of the compact UVLGs from the rest of the galaxy population at low mass remains. The dashed line shows the relation for LBGs from Erb et al. (2006). At low masses ( M⊙) the compact UVLGs and LBGs have similar metallicity. At higher masses the UVLGs are more metal-rich (including the compact UVLGs). Erb et al. interpret the relation for the LBGs in terms of the loss of metals by supernova-driven winds that is occurring at all masses. Results by Shapley et al. (2005) suggest this may also be true at redshifts as low as 1 to 1.5 (Shapley et al., 2005). This contrasts with the mass-dependent loss of metals inferred for the local galaxy population (Tremonti et al., 2004). The form of the mass-metallicity relation for the UVLGs suggests mass-dependent metal loss. We will consider this idea in detail in a future paper.
Figure 10 shows the metallicity of the ionized gas, determined from the SDSS spectra (Tremonti et al., 2004), in UVLGs as a function of FUV surface brightness. There is a clear trend of increasing metallicity with decreasing surface brightness. Given the connection between surface brightness and mass previously discussed (see Figure 3), this is likely a reflection of the mass-metallicity correlation. The high surface brightness galaxies have the lowest metallicity, and this metallicity is typical of that found in LBGs (Shapley et al., 2004; Erb et al., 2006).
4.4 Active Galactic Nuclei
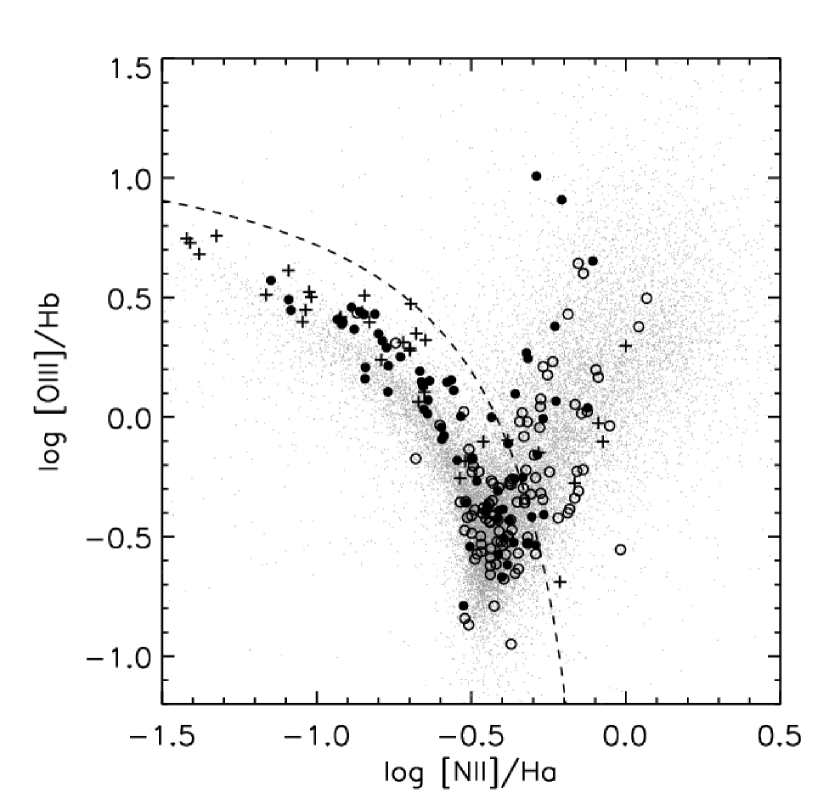
Figure 11 is a diagnostic diagram that uses line ratios to differentiate between active galactic nuclei (AGN) and star-formation-dominated systems (Baldwin et al., 1981). The dashed line in the figure shows the line of demarcation determined by Kauffmann et al. (2003a) for SDSS galaxies, where galaxies below the line are dominated by star formation. The UVLGs are shown in the figure as large circles, with filled circles denoting UVLGs with L⊙ kpc-2 and crosses denoting UVLGs with L⊙ kpc-2. Of the 104 compact (and supercompact) UVLGs in this plot, 22 are classified as AGN or transition objects, roughly 21%, compared to 33% of the entire sample in the compact UVLG mass range ( M log M⊙). About 34% of the large UVLGs in this diagram ( L⊙ kpc-2) are classified as AGN (36 out of 106), while for the entire sample in this mass range ( M log M⊙) the fraction is 54%. This difference may reflect the fact that it can be more difficult to recognize a type II AGN in a starburst due to the strong emission lines produced by star formation. The majority of UVLGs have the line ratios of normal star-forming galaxies. Note that type I AGN have been removed from the GR1/DR3 sample because the AGN would contribute significantly to the UV luminosity.
5 Discussion
5.1 Large and Compact UVLGs
The most luminous galaxies in the ultraviolet ( L⊙) are a diverse population spanning a wide range of properties. Most of these properties are correlated at some level with the FUV surface brightness, which reflects the star formation rate per unit area. It is informative to use the surface brightness distribution to divide the UVLGs into two groups, “large” and “compact”.
The large UVLGs at the low surface brightness end are very massive spirals. They have stellar masses of M⊙, comparable to massive spirals in the local universe. They have half-light radii of 5 to 30 kpc. They are at the extreme end of the UV luminosity distribution, an indication that they have high global star formation rates. However, this high luminosity is a result of relatively modest star formation intensity spread out over a large area. They seem to share many of the characteristics of normal spirals but extend this population to high UV luminosity. By selecting the most luminous galaxies we have found the tail of the distribution of massive spirals.
The compact UVLGs at the high-surface brightness end are systems with intense star formation in a relatively compact region. They are lower mass systems ( M⊙) with half-light radii of 1 to 5 kpc. They have high specific star formation rates, suggesting they may be experiencing their first major burst of star formation. They are generally metal-poor compared to the large UVLGs.
Figures 1 and 2 illustrate the basic differences between large and compact UVLGs. These figures show that the large UVLGs can be understood as the high-luminosity end of the distribution of normal galaxies. They are extremely luminous, but this is mostly a reflection of their large size. On the other hand, the compact UVLGs deviate from the trends established by the full sample, in that they are very luminous but not very large. Their high luminosity reflects an extremely high surface brightness in a relatively small region. This behavior sets them apart from the rest of the galaxies, and suggests that compact UVLGs are a distinct population of galaxies.
5.2 Local Analogs of Lyman Break Galaxies
One of the initial goals of this investigation was to find nearby galaxies with properties most similar to LBGs. To do this, we have defined a surface brightness cutoff at L⊙ kpc-2, which is the lower limit of UV surface brightness seen in typical LBGs (Giavalisco, 2002). Table 2 shows that the galaxies in this sample (“supercompact UVLGs”) share all of the characteristics of LBGs that are considered in this paper, including UV luminosity, mass, star formation rate, specific star formation rate, UV attenuation, and metallicity. Like LBGs, they are compact systems undergoing intense star formation.
The question of whether this is the first major episode of star formation that these galaxies have undergone is crucial to determining how similar they are to LBGs. observations of LBGs in the rest-frame near-IR have shown that they do not contain a previously hidden population of older, low-mass stars (Barmby et al., 2004). The UV-optical colors of many of the compact UVLGs suggest that this may be the first major episode of star formation these galaxies have experienced (see Figure 7). Near-infrared observations are necessary to fully trace the population of old stars. Such observations have been carried out with , and will be reported in a forthcoming paper. The current UV-optical data, however, suggest that the compact UVLGs are indeed excellent local analogs to LBGs. Further study of these remarkable objects can provide crucial information about star formation in the early universe. Toward this end we are currently analyzing Hubble Space Telescope data (in addition to our data) in order to study the morphologies, dust content, and stellar populations of compact UVLGs. The results from these studies will be presented in future papers.
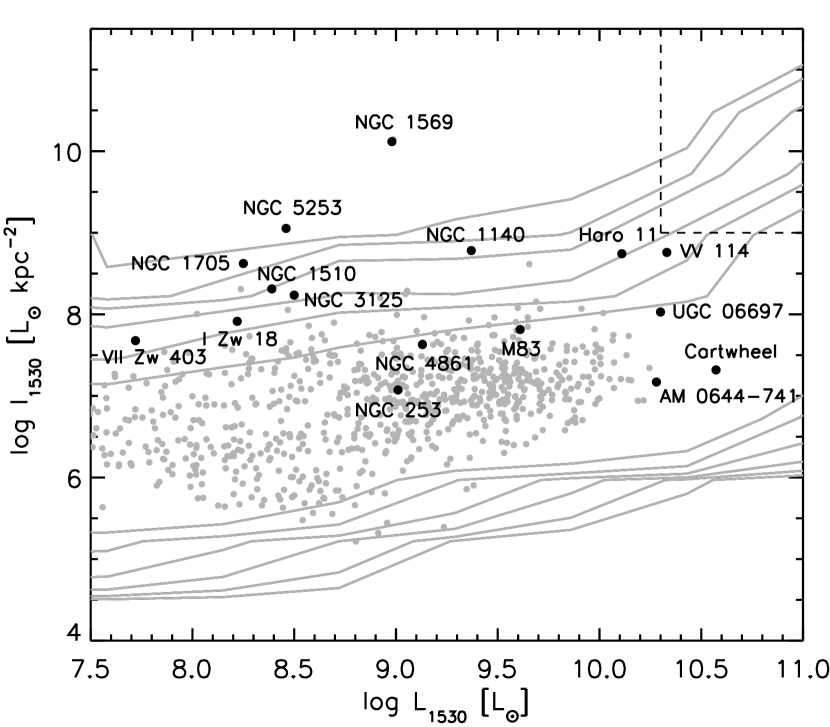
Whether or not the highest surface brightness UVLGs are indeed analogs of LBGs, they are distinct from any previously studied population of galaxies in the local universe. They are much more luminous in the UV (and thus have much higher star formation rates) than blue compact dwarf galaxies (BCDGs), and have higher UV surface brightnesses (and thus star formation rates per unit area) than local starburst galaxies. For example, while I Zw 18, the prototypical BCDG, has an FUV surface brightness of L⊙ kpc-2, which is close to the boundary for compact UVLGs, its FUV luminosity L⊙, more than 2 orders of magnitude below the lower limit for UVLGs (Gil de Paz et al., 2006).
Figure 12 compares the luminosity and surface brightness of galaxies in the GALEX Ultraviolet Atlas of Nearby Galaxies (Gil de Paz et al. 2006), including some nearby well-known starbursts and BCDGs, with the normalized distribution of the entire sample. The range in log for 14 starbursts from the atlas (not all shown in the figure) is from 8.2 to 10.5 , and for 10 BCDGs in the atlas the range is 7.3 to 10.3. The boundary for UVLGs is log =10.3. In surface brightness the starbursts range from log I6.2 to 9.1, while the BCDGs range from 6.6 to 8.7. The Cartwheel galaxy, AM 0644-741, and UGC 06697 are three starburst galaxies that are also local examples of large UVLGs. Figure 12 shows that while some local galaxies have high FUV surface brightness, and others have high FUV luminosity, almost none have the combination of high luminosity and high surface brightness that would qualify as a compact UVLG. The exception is VV 114, which is the nearest known Lyman Break Galaxy analog (Grimes et al., 2006). Compact UVLGs, and especially supercompact UVLGs, clearly have extreme properties when compared to local galaxy populations.
6 Conclusions
We have used GALEX and the SDSS to identify and study the most UV luminous galaxies in the local universe. Our main results are as follows:
-
1.
The most UV luminous galaxies in the local universe comprise a diverse group, with properties that are well correlated with UV surface brightness. Although there is not a sharp transition, we can use a surface brightness boundary of L⊙ kpc-2 to divide the UVLG sample into two groups: large and compact UVLGs.
-
2.
The large UVLGs are massive, metal-rich disk galaxies with UV surface brightnesses only slightly larger than typical star forming galaxies. They are similar to normal galaxies in most respects, but are very luminous primarily because of their large size.
-
3.
The compact UVLGs are low-mass, relatively metal-poor systems which often have a disturbed or interacting morphology. The high UV surface brightness and high specific star formation rate in these compact UVLGs indicates that intense star formation is ongoing.
-
4.
It is possible to isolate a sample of local LBG-analogs with UV surface brightness criterion of L⊙ kpc-2. The galaxies in the resulting sample have many properties in common with LBGs, including luminosity, mass, star formation rate, specific star formation rate, extinction, and metallicity.
-
5.
Compact UVLGs stand out from the trends established by the full DR3/GR1 sample in that they have much smaller sizes and higher surface brightness than would be predicted for galaxies of their mass or luminosity. They have metallicities that are generally lower by a factor of two to three compared to normal galaxies of the same mass. These properties suggest that they are a distinct population of objects, perhaps at a different phase of evolution than the bulk of the galaxies in the local universe.
-
6.
The high UV luminosity and implied high star formation rate of compact UVLGs distinguishes them from any previously studied local galaxy population, including local UV-bright starbursts and blue compact dwarf galaxies.
References
- Abazajian et al. (2003) Abazajian, K., et al. 2003, AJ, 126, 2081
- Abazajian et al. (2005) Abazajian, K., et al. 2005, AJ, 129, 1755
- Arnouts et al. (2005) Arnouts, S., et al. 2005, ApJ, 619, L43
- Baldwin et al. (1981) Baldwin, J. A., Phillips, M. M., & Terlevich, R. 1981, PASP, 93, 5
- Barmby et al. (2004) Barmby, P., et al. 2004, ApJS, 154, 97
- Bianchi et al. (2006) Bianchi, L., et al. 2006, ApJS, this volume
- Brinchmann et al. (2004) Brinchmann, J., Charlot, S., White, S. D. M., Tremonti, C., Kauffmann, G., Heckman, T., & Brinkmann, J. 2004, MNRAS, 351, 1151
- Bruzual & Charlot (2003) Bruzual, G., & Charlot, S. 2003, MNRAS, 344, 1000
- Calzetti (2001) Calzetti, D. 2001, PASP, 113, 1449
- Charlot & Fall (2000) Charlot, S., & Fall, S. M. 2000, ApJ, 539, 718
- Charlot & Longhetti (2001) Charlot, S., & Longhetti, M. 2001, MNRAS, 323, 887
- Dickinson et al. (2004) Dickinson, M., et al. 2004, ApJ, 600, L99
- Erb et al. (2006) Erb, D. K., Steidel, C. C., Shapley, A. E., Pettini, M., Reddy, N. A., & Adelberger, K. L. 2006, ApJ, 646, 107
- Erb et al. (2006) Erb, D. K., Shapley, A. E., Pettini, M., Steidel, C. C., Reddy, N. A., & Adelberger, K. L. 2006, ApJ, 644, 813
- Ferguson et al. (2004) Ferguson, H., et al. 2004, ApJ, 600, L107
- Giavalisco (2002) Giavalisco, M. 2002, ARA&A, 40, 579
- Giavalisco et al. (2004) Giavalisco, M., et al. 2004, ApJ, 600, L103
- Gil de Paz et al. (2006) Gil de Paz, A., et al. 2006, ApJS, this volume
- Grimes et al. (2006) Grimes, J. P., Heckman, T. M., Hoopes, C. G., Strickland, D. K., Aloisi, A., Meurer, G., Ptak, A. 2006, ApJ, 648, 310
- Heckman et al. (1998) Heckman, T. M., Robert, C., Leitherer, C., Garnett, D. R., & van der Rydt, F. 1998, ApJ, 503, 646
- Heckman et al. (2005) Heckman, T.M., et al. 2005, ApJ, 619, L35; Paper I
- Kauffmann et al. (2003a) Kauffmann, G., et al. 2003a, MNRAS, 341, 33
- Kauffmann et al. (2003b) Kauffmann, G., et al. 2003b, MNRAS, 341, 54
- Kauffmann et al. (2003c) Kauffmann, G., et al. 2003c, MNRAS, 346, 1055
- Kennicutt (1998) Kennicutt, R. C., Jr. 1998, ARA&A, 36, 189
- Madau et al. (1996) Madau, P., Ferguson, H. C., Dickinson, M. E., Giavalisco, M., Steidel, C. C., & Fruchter, A. 1996, MNRAS, 283, 1388
- Martin et al. (2005) Martin, D. C., et al. 2005, ApJ, 619, L1
- Morrisey et al. (2005) Morrisey, P. F., et al. 2004, ApJ, 619 L7
- Meurer et al. (1999) Meurer, G. R., Heckman, T. M., & Calzetti, D. 1999, ApJ, 521, 64
- Papovich et al. (2001) Papovich, C., Dickinson, M., & Ferguson, H. 2001, ApJ, 559, 620
- Pettini & Pagel (2004) Pettini, M. & Pagel, B. E. 2004, MNRAS, 348, L59
- Reddy et al. (2006) Reddy, N. A.., et al. 2006, ApJ, in press [astro-ph/0602596]
- Salim et al. (2005) Salim, S., et al. 2005, ApJ, 619, L39
- Savaglio et al. (2005) Savaglio, S., et al. 2005, ApJ, 635, 260
- Schiminovich et al. (2005) Schiminovich, D., et al. 2005, ApJ, 619, L47
- Shapley et al. (2005) Shapley, A. E., Coil, A. L., Ma, C.-P., & Bundy, K. 2005, ApJ, 635, 1006
- Shapley et al. (2004) Shapley, A. E., Erb, D. K., Pettini, M., Steidel, C. C., & Adelberger, K. L. 2004, ApJ, 612, 108
- Shapley et al. (2001) Shapley, A., Steidel, C., Adelberger, K., Dickinson, M., Giavalisco, M., & Pettini, M. 2001, ApJ, 562, 95
- Steidel et al. (1999) Steidel, C. C., Adelberger, K. L., Giavalisco, M., Dickinson, M., & Pettini, M. 1999, ApJ, 519, 1
- Steidel et al. (2003) Steidel, C. C., Adelberger, K. L., Shapley, A. E., Pettini, M., Dickinson, M., & Giavalisco, M. 2003, ApJ, 592, 728
- Steidel et al. (1996) Steidel, C. C., Giavalisco, M., Pettini, M., Dickinson, M., & Adelberger, K. L. 1996, ApJ, 462, L17
- Steidel & Hamilton (1993) Steidel, C. C., & Hamilton, D. 1993, AJ, 105, 2017
- Tremonti et al. (2004) Tremonti, C. A., et al. 2004, ApJ, 613, 898
- Wyder et al. (2005) Wyder, T. K., et al. 2005, ApJ, 619, L15
| SDSS ObjID | RA | Dec | Redshift | log L1530 | r50,u | log I1530 | FUV | NUV | A1530 | log M∗ | log SFR | 12+log(O/H) |
|---|---|---|---|---|---|---|---|---|---|---|---|---|
| (deg) | (deg) | (L⊙) | (kpc) | (L⊙ kpc-2) | (mag) | (mag) | (mag) | (M⊙) | (M⊙ yr-1) | |||
| (1) | (2) | (3) | (4) | (5) | (6) | (7) | (8) | (9) | (10) | (11) | (12) | (13) |
| 587731187814629504 | 0.20128 | 1.15675 | 0.250 | 10.34 | 3.13 | 8.55 | 20.510.25 | 20.160.15 | 0.80 | 10.08 | 1.03 | 8.89 |
| 588015508196294786 | 1.46632 | -0.73521 | 0.134 | 10.34 | 9.62 | 7.58 | 19.020.28 | 20.090.26 | 3.25 | 10.76 | 0.76 | |
| 588015507659554916 | 1.77391 | -1.07124 | 0.288 | 10.51 | 5.14 | 8.29 | 20.440.25 | 20.340.17 | 1.51 | 10.67 | 1.44 | 8.89 |
| 587731185131192547 | 2.40203 | -0.84206 | 0.161 | 10.42 | 7.69 | 7.85 | 19.260.15 | 18.870.08 | 2.26 | 10.56 | 0.60 | 9.02 |
| 587727225154306171 | 2.45330 | -11.03518 | 0.211 | 10.35 | 4.13 | 8.32 | 20.080.22 | 19.550.10 | 1.42 | 9.98 | 1.07 | 8.67 |
| 588015508196753479 | 2.54157 | -0.76765 | 0.243 | 10.45 | 1.38 | 9.37 | 20.190.23 | 19.860.15 | 1.00 | 10.43 | 1.18 | 8.74 |
| 588015510344302646 | 2.78681 | 0.84544 | 0.108 | 10.54 | 3.24 | 8.72 | 18.020.08 | 17.870.04 | 0.37 | 9.76 | 1.71 | 8.71 |
| 588015509270626537 | 2.86065 | 0.06754 | 0.211 | 10.36 | 6.55 | 7.93 | 20.070.22 | 19.860.11 | 2.96 | 10.62 | 1.15 | 9.02 |
| 587727225154764940 | 3.43824 | -10.93658 | 0.246 | 10.57 | 12.52 | 7.58 | 19.900.08 | 19.270.03 | 2.35 | 10.99 | 1.20 | 9.06 |
| 587727225154961583 | 3.99757 | -11.02590 | 0.267 | 10.40 | 23.68 | 6.85 | 20.530.07 | 19.990.03 | 2.21 | 11.62 | 0.95 | |
| 587731185132109826 | 4.36789 | -0.94027 | 0.094 | 10.32 | 2.70 | 8.66 | 18.250.09 | 17.920.05 | 1.73 | 10.74 | 1.25 | 8.96 |
| 587731185132241048 | 4.78147 | -0.87711 | 0.187 | 10.42 | 4.13 | 8.39 | 19.630.17 | 19.350.10 | 1.37 | 10.28 | 1.35 | 8.89 |
| 587727227304476771 | 8.60397 | -9.19877 | 0.164 | 10.47 | 8.98 | 7.77 | 19.170.04 | 19.570.04 | 1.70 | 10.76 | 0.45 | |
| 587727180600705169 | 8.71946 | -9.02820 | 0.144 | 10.38 | 10.40 | 7.55 | 19.090.14 | 18.830.07 | 2.27 | 10.27 | 0.66 | 8.96 |
| 587727177916416108 | 8.84842 | -11.12945 | 0.123 | 10.33 | 9.98 | 7.53 | 18.830.03 | 20.190.03 | 2.85 | 10.44 | -0.13 | |
| 587724198812057678 | 9.06934 | 15.04284 | 0.119 | 10.63 | 3.99 | 8.63 | 18.020.03 | 1.91 | 10.61 | 0.21 | 9.11 | |
| 587727225157386334 | 9.58818 | -10.88660 | 0.184 | 10.52 | 9.26 | 7.79 | 19.340.15 | 19.130.08 | 2.18 | 10.77 | 1.06 | 8.94 |
| 587724199349387411 | 10.22635 | 15.56938 | 0.283 | 10.43 | 1.72 | 9.16 | 20.620.08 | 21.030.05 | 0.13 | 9.18 | 0.41 | 8.23 |
| 587724199349518558 | 10.52352 | 15.36599 | 0.259 | 10.32 | 13.81 | 7.24 | 20.660.10 | 20.280.04 | 9.20 | 11.27 | 0.91 | |
| 588015509274165442 | 10.94763 | 0.05960 | 0.213 | 10.83 | 13.08 | 7.80 | 18.920.11 | 18.940.08 | 0.63 | 11.24 | 0.84 | |
| 587724199349780648 | 11.19722 | 15.48662 | 0.227 | 10.56 | 2.30 | 9.04 | 19.750.05 | 19.520.03 | 10.71 | 1.39 | ||
| 588015510348169371 | 11.61157 | 0.86546 | 0.166 | 10.42 | 2.86 | 8.71 | 19.340.14 | 18.740.06 | 1.31 | 10.41 | 1.13 | 8.60 |
| 587724233712140399 | 11.69467 | 15.72774 | 0.181 | 10.43 | 9.28 | 7.70 | 19.520.05 | 19.160.02 | 3.41 | 11.10 | 1.06 | 9.27 |
| 587724232101724283 | 12.19103 | 14.44148 | 0.278 | 10.40 | 4.04 | 8.39 | 20.640.31 | 20.460.21 | 1.97 | 11.00 | 1.92 | |
| 588015508738539596 | 13.86443 | -0.36355 | 0.167 | 10.49 | 0.80 | 9.89 | 19.190.14 | 18.720.07 | 10.07 | 1.18 | ||
| 587727179529322564 | 14.14723 | -9.82308 | 0.189 | 10.58 | 4.74 | 8.43 | 19.230.04 | 0.00 | 11.08 | 0.57 | 9.01 | |
| 587731187283853386 | 14.19609 | 0.64680 | 0.218 | 10.43 | 2.38 | 8.88 | 19.960.20 | 19.300.12 | 1.38 | 10.02 | 0.92 | 8.65 |
| 587724234250256545 | 14.69203 | 16.03578 | 0.243 | 10.36 | 4.18 | 8.32 | 20.410.28 | 19.760.16 | 1.47 | 10.17 | 0.78 | 8.72 |
| 587724199888289961 | 14.98405 | 15.64598 | 0.144 | 11.16 | 11.24 | 8.26 | 17.140.02 | 19.110.02 | 1.99 | 10.94 | 0.53 | |
| 587724197204132105 | 15.36074 | 13.54601 | 0.223 | 10.51 | 11.28 | 7.61 | 19.820.20 | 19.720.15 | 10.44 | 11.10 | 0.69 | |
| 587724198814810262 | 15.61241 | 14.91062 | 0.086 | 10.33 | 1.68 | 9.08 | 18.000.03 | 0.66 | 9.93 | -0.29 | 8.89 | |
| 587731511530815637 | 16.03357 | -0.84219 | 0.207 | 10.38 | 4.08 | 8.36 | 19.960.23 | 19.290.09 | 0.80 | 10.09 | 1.44 | 8.78 |
| 588015509276590315 | 16.56369 | 0.12798 | 0.220 | 10.41 | 8.69 | 7.73 | 20.040.22 | 19.940.12 | 1.83 | 10.86 | 0.78 | 9.11 |
| 587731514215497820 | 16.70578 | 1.05622 | 0.253 | 10.95 | 5.02 | 8.75 | 19.040.14 | 19.690.11 | 1.43 | 11.70 | 2.41 | |
| 587731514215497878 | 16.80949 | 1.15869 | 0.159 | 10.34 | 6.82 | 7.87 | 19.430.17 | 19.550.10 | 2.01 | 10.78 | 0.91 | 9.14 |
| 587724197204983886 | 17.31450 | 13.43438 | 0.184 | 10.55 | 12.58 | 7.55 | 19.250.16 | 19.020.09 | 11.48 | 1.63 | ||
| 587724233178808483 | 20.14169 | 14.77605 | 0.130 | 10.48 | 11.91 | 7.53 | 18.610.03 | 3.26 | 11.07 | 0.53 | ||
| 587724233179332766 | 21.25810 | 14.63618 | 0.153 | 10.37 | 8.52 | 7.71 | 19.260.04 | 18.810.02 | 2.63 | 11.12 | 1.23 | |
| 587727180069404773 | 21.54104 | -9.12973 | 0.263 | 10.38 | 30.63 | 6.61 | 20.550.07 | 20.080.05 | 2.23 | 11.70 | 0.99 | |
| 587727178460496000 | 25.59877 | -10.18952 | 0.128 | 10.41 | 3.47 | 8.53 | 18.720.03 | 18.410.01 | 0.56 | 9.56 | 0.55 | 8.67 |
| 587724233181429914 | 26.26956 | 14.25279 | 0.172 | 10.36 | 9.84 | 7.58 | 19.570.05 | 19.360.02 | 0.00 | 11.14 | -0.20 | |
| 587727229449338983 | 26.80144 | -10.21155 | 0.198 | 10.35 | 14.62 | 7.22 | 19.920.05 | 19.310.02 | 0.00 | 11.06 | 0.86 | |
| 587724232644821098 | 26.81554 | 13.91049 | 0.193 | 10.47 | 3.21 | 8.66 | 19.580.05 | 19.030.02 | 0.48 | 10.08 | 1.44 | 8.70 |
| 587724197746180186 | 27.61831 | 13.14958 | 0.147 | 10.62 | 1.66 | 9.38 | 18.550.03 | 18.260.02 | 1.26 | 10.42 | 0.91 | 8.87 |
| 587724232108409001 | 27.85828 | 13.41965 | 0.243 | 10.52 | 1.53 | 9.35 | 20.000.06 | 19.530.03 | 1.19 | 10.52 | 1.29 | 8.98 |
| 587724197746376839 | 27.95274 | 13.19747 | 0.191 | 10.60 | 7.58 | 8.04 | 19.210.05 | 2.21 | 11.32 | -0.01 | ||
| 587724233720004940 | 30.32127 | 14.33144 | 0.285 | 10.34 | 54.49 | 6.07 | 20.860.09 | 19.910.03 | 3.55 | 11.10 | -0.07 | 9.10 |
| 587724198822215805 | 32.98133 | 13.47305 | 0.149 | 10.33 | 14.74 | 7.20 | 19.300.05 | 18.830.02 | 1.79 | 11.23 | 0.90 | |
| 587724232647508116 | 33.09660 | 13.20805 | 0.134 | 10.34 | 13.95 | 7.25 | 19.020.04 | 18.590.02 | 3.75 | 11.21 | 0.99 | |
| 587724198285541435 | 33.45223 | 12.99766 | 0.219 | 10.58 | 0.85 | 9.92 | 19.590.06 | 18.720.02 | 2.48 | 10.68 | 1.35 | |
| 587731511538745437 | 34.13192 | -1.02454 | 0.167 | 10.39 | 3.43 | 8.52 | 19.410.16 | 18.880.07 | 1.44 | 10.34 | 1.51 | 8.85 |
| 587727179540463751 | 39.85733 | -8.14107 | 0.184 | 10.99 | 13.21 | 7.95 | 18.160.03 | 18.710.01 | 6.02 | 11.40 | 0.06 | |
| 587727179540594732 | 40.14347 | -8.15686 | 0.177 | 10.31 | 5.77 | 7.99 | 19.740.05 | 19.270.02 | 1.36 | 10.51 | 0.76 | 9.00 |
| 587724241226498139 | 41.37314 | -8.27718 | 0.195 | 10.41 | 1.66 | 9.17 | 19.740.05 | 19.080.03 | 1.39 | 10.36 | 1.36 | 8.83 |
| 587724240153018558 | 42.18780 | -8.96868 | 0.238 | 10.73 | 20.17 | 7.32 | 19.420.04 | 19.280.03 | 2.33 | 10.99 | 0.98 | 9.00 |
| 587724241226891413 | 42.38908 | -8.09707 | 0.270 | 11.11 | 24.91 | 7.52 | 18.770.03 | 18.630.02 | 2.03 | 10.73 | 1.78 | 8.61 |
| 587731511543464076 | 44.95400 | -0.96678 | 0.293 | 10.59 | 5.14 | 8.37 | 20.300.23 | 19.470.11 | 1.95 | 10.96 | 1.93 | 8.87 |
| 588015509825978540 | 45.13415 | 0.51732 | 0.170 | 10.38 | 3.36 | 8.53 | 19.480.14 | 19.760.11 | 2.61 | 10.84 | 1.00 | |
| 587727180616695902 | 45.53338 | -6.63504 | 0.180 | 10.42 | 12.46 | 7.43 | 19.520.20 | 19.180.10 | 1.62 | 10.94 | 0.85 | 8.87 |
| 587727179543740592 | 47.44834 | -7.33566 | 0.196 | 10.43 | 4.96 | 8.24 | 19.710.06 | 19.580.03 | 2.26 | 10.58 | 0.95 | 9.06 |
| 587724241766187109 | 47.84834 | -7.00088 | 0.226 | 10.44 | 11.45 | 7.52 | 20.020.06 | 19.760.03 | 2.14 | 11.33 | 0.83 | 8.98 |
| 587724241229643897 | 48.61778 | -7.42162 | 0.208 | 10.32 | 2.02 | 8.91 | 20.120.08 | 20.090.04 | 0.78 | 10.46 | 0.29 | |
| 587724240156360834 | 49.81060 | -8.06979 | 0.125 | 10.50 | 3.21 | 8.69 | 18.450.12 | 18.250.07 | 1.79 | 10.29 | 1.00 | 8.88 |
| 587731511545954498 | 50.61609 | -1.03658 | 0.194 | 10.31 | 14.16 | 7.21 | 19.980.28 | 20.190.30 | 2.94 | 10.94 | 0.51 | |
| 587731514230571148 | 51.21346 | 1.11823 | 0.150 | 10.31 | 12.84 | 7.29 | 19.350.20 | 19.240.20 | 1.10 | 11.03 | 0.31 | |
| 588015510365602004 | 51.34779 | 0.96633 | 0.212 | 10.33 | 12.41 | 7.34 | 20.150.29 | 20.300.26 | 0.53 | 11.21 | 0.80 | 9.31 |
| 587731512083415213 | 51.98476 | -0.47176 | 0.162 | 10.54 | 4.53 | 8.43 | 18.970.16 | 18.620.09 | 0.90 | 10.29 | 1.64 | 8.83 |
| 587731512620351653 | 52.09571 | -0.13294 | 0.205 | 10.31 | 3.32 | 8.47 | 20.120.30 | 19.700.18 | 0.81 | 9.95 | 1.28 | 8.85 |
| 587731514231029883 | 52.19166 | 1.19744 | 0.142 | 10.39 | 1.74 | 9.11 | 19.040.17 | 19.050.12 | 0.48 | 9.74 | 1.19 | 8.78 |
| 587724242305286402 | 52.93439 | -5.93593 | 0.247 | 10.52 | 2.76 | 8.84 | 20.030.06 | 19.600.04 | 0.33 | 9.79 | 1.31 | 8.61 |
| 587731513694617768 | 53.22892 | 0.64229 | 0.227 | 10.54 | 12.33 | 7.56 | 19.780.24 | 19.420.17 | 1.51 | 11.14 | 0.89 | 9.02 |
| 588015509292712195 | 53.34551 | 0.09876 | 0.178 | 10.49 | 8.30 | 7.85 | 19.320.17 | 4.56 | 11.03 | 0.57 | ||
| 587731514231750803 | 53.87266 | 1.24974 | 0.171 | 10.48 | 6.96 | 8.00 | 19.250.21 | 19.930.24 | 1.49 | 10.63 | 0.68 | 9.14 |
| 587731514232144016 | 54.77985 | 1.16598 | 0.182 | 10.36 | 6.40 | 7.95 | 19.710.25 | 20.030.31 | 2.33 | 10.89 | 0.68 | 9.03 |
| 587731514232144028 | 54.80193 | 1.13992 | 0.261 | 10.62 | 3.60 | 8.71 | 19.940.27 | 19.640.18 | 2.05 | 10.90 | 1.15 | 9.07 |
| 588015510367240313 | 55.09066 | 0.92732 | 0.253 | 10.36 | 5.70 | 8.05 | 20.520.30 | 19.750.20 | 1.43 | 10.59 | 1.07 | 9.03 |
| 587731513158991989 | 56.09607 | 0.39638 | 0.219 | 10.32 | 4.04 | 8.31 | 20.250.30 | 19.780.14 | 1.53 | 10.33 | 1.60 | 8.82 |
| 587724242307121309 | 57.03210 | -5.42077 | 0.164 | 10.38 | 4.91 | 8.20 | 19.380.19 | 19.190.12 | 0.62 | 10.04 | 1.17 | 8.58 |
| 587724240697622665 | 59.81242 | -6.30119 | 0.181 | 10.51 | 8.05 | 7.90 | 19.300.19 | 19.210.15 | 3.03 | 11.07 | 1.41 | 8.98 |
| 587727180086378659 | 60.53695 | -5.11169 | 0.139 | 10.45 | 1.20 | 9.49 | 18.850.15 | 18.880.09 | 0.23 | 9.39 | 1.22 | 8.53 |
| 588007005229875657 | 115.76499 | 37.73554 | 0.202 | 10.44 | 5.97 | 8.09 | 19.740.05 | 19.310.02 | 2.13 | 11.44 | 1.05 | 9.11 |
| 587735236344414396 | 120.41840 | 23.20090 | 0.272 | 10.33 | 3.85 | 8.36 | 20.760.30 | 19.650.10 | 2.69 | 10.78 | 1.31 | 9.06 |
| 587728668268167253 | 122.18443 | 39.81455 | 0.091 | 10.45 | 0.50 | 10.25 | 17.850.08 | 17.540.04 | 1.04 | 10.33 | 1.02 | |
| 587725981224599567 | 123.84753 | 50.07076 | 0.164 | 10.50 | 1.87 | 9.16 | 19.110.15 | 18.610.07 | 1.51 | 10.30 | 2.10 | 8.99 |
| 587725774535000285 | 124.04864 | 49.38725 | 0.179 | 10.47 | 12.72 | 7.46 | 19.370.17 | 19.170.09 | 3.12 | 11.30 | 1.23 | |
| 587725470130110508 | 124.34376 | 46.74989 | 0.280 | 10.83 | 3.24 | 9.01 | 19.570.05 | 19.130.02 | 0.48 | 9.98 | 1.53 | 8.68 |
| 588007004697854025 | 124.67503 | 46.58495 | 0.218 | 10.43 | 2.24 | 8.93 | 19.970.05 | 19.310.02 | 3.02 | 11.21 | 2.21 | 9.06 |
| 587728668806611190 | 124.74548 | 42.90008 | 0.154 | 10.43 | 13.09 | 7.40 | 19.130.15 | 18.870.08 | 1.73 | 11.25 | 0.77 | |
| 587728931875651786 | 124.86896 | 41.29362 | 0.179 | 10.41 | 6.86 | 7.94 | 19.550.18 | 19.880.12 | 1.96 | 10.82 | 1.42 | 9.11 |
| 587728664505483532 | 124.88740 | 42.60294 | 0.232 | 10.53 | 2.86 | 8.82 | 19.860.21 | 20.280.15 | 1.20 | 10.98 | 0.50 | |
| 588007004160983209 | 125.22800 | 46.21449 | 0.229 | 10.41 | 2.96 | 8.67 | 20.130.06 | 19.630.03 | 1.16 | 9.79 | 1.13 | 8.66 |
| 587731872314884117 | 125.40520 | 37.17965 | 0.284 | 10.80 | 1.84 | 9.47 | 19.700.12 | 19.270.07 | 0.58 | 9.99 | 1.54 | 8.89 |
| 587728664506073210 | 126.05471 | 43.62250 | 0.118 | 10.61 | 2.64 | 8.97 | 18.050.09 | 17.900.05 | 10.36 | 1.40 | ||
| 587728931876176092 | 126.06725 | 42.16934 | 0.223 | 10.34 | 10.02 | 7.54 | 20.240.24 | 2.11 | 11.13 | -2.05 | ||
| 587731885736788122 | 126.13889 | 38.00366 | 0.103 | 10.33 | 4.37 | 8.25 | 18.430.07 | 17.840.03 | 1.22 | 10.93 | 1.71 | 9.15 |
| 587728664506400946 | 126.71116 | 44.14319 | 0.132 | 10.35 | 11.51 | 7.43 | 18.970.13 | 18.310.07 | 1.53 | 11.05 | 0.82 | |
| 587731886275166445 | 128.88380 | 40.71084 | 0.084 | 10.31 | 4.06 | 8.30 | 18.010.08 | 17.940.05 | 0.44 | 9.67 | 0.52 | 8.61 |
| 588010136800395436 | 129.38982 | 47.96454 | 0.215 | 10.56 | 2.96 | 8.82 | 19.590.15 | 18.930.06 | 0.30 | 9.91 | 1.41 | 8.31 |
| 588010135726456918 | 129.61571 | 47.17575 | 0.097 | 10.38 | 2.07 | 8.95 | 18.170.01 | 17.730.01 | 1.35 | 10.72 | 0.80 | 8.88 |
| 588009365859074276 | 130.71088 | 46.97751 | 0.229 | 10.33 | 11.08 | 7.44 | 20.330.04 | 19.660.02 | 2.79 | 11.15 | 1.09 | |
| 587728931341336751 | 130.91106 | 45.25332 | 0.193 | 10.42 | 4.74 | 8.27 | 19.680.16 | 19.460.08 | 2.39 | 10.65 | 1.43 | 9.10 |
| 587725470670192770 | 131.50928 | 52.53307 | 0.053 | 10.31 | 3.95 | 8.32 | 16.950.01 | 16.500.00 | 2.24 | 11.15 | 1.06 | 9.20 |
| 587728930804859108 | 132.25192 | 45.56725 | 0.220 | 10.58 | 10.79 | 7.72 | 19.610.16 | 19.340.08 | 2.85 | 11.03 | 0.88 | 9.08 |
| 587725552275226831 | 133.40443 | 57.07639 | 0.299 | 11.33 | 32.03 | 7.52 | 18.480.03 | 11.53 | -0.17 | |||
| 587732049480056879 | 136.07295 | 45.62538 | 0.195 | 10.47 | 9.68 | 7.70 | 19.580.20 | 19.340.10 | 2.70 | 10.85 | 0.99 | 9.11 |
| 587725469598023726 | 136.63254 | 54.47703 | 0.205 | 10.41 | 2.58 | 8.79 | 19.860.17 | 19.230.08 | 1.00 | 10.15 | 1.61 | 8.85 |
| 587732702855627062 | 136.67363 | 5.37485 | 0.226 | 10.33 | 9.72 | 7.56 | 20.300.26 | 20.070.17 | 2.80 | 11.29 | 0.99 | |
| 587732701782016286 | 137.08205 | 4.58679 | 0.124 | 10.35 | 9.05 | 7.64 | 18.820.14 | 18.240.06 | 2.43 | 10.74 | 0.90 | 9.06 |
| 588007004703096884 | 137.59975 | 55.39899 | 0.171 | 10.33 | 2.24 | 8.83 | 19.620.04 | 19.040.02 | 2.21 | 11.00 | 1.37 | |
| 587727942954844494 | 137.80559 | 1.23246 | 0.252 | 10.32 | 32.82 | 6.49 | 20.600.07 | 20.290.03 | 4.55 | 11.31 | 0.53 | |
| 587732054319890553 | 139.35410 | 42.75827 | 0.237 | 10.31 | 7.26 | 7.79 | 20.450.22 | 19.810.11 | 2.50 | 11.09 | 1.27 | |
| 587725817477988424 | 139.44617 | 59.29116 | 0.173 | 10.38 | 2.43 | 8.81 | 19.540.17 | 18.660.07 | 1.78 | 10.56 | 1.27 | 8.91 |
| 587731913110257902 | 139.95036 | 48.64304 | 0.237 | 10.32 | 14.44 | 7.20 | 20.430.25 | 19.880.11 | 1.76 | 11.01 | 0.91 | 9.04 |
| 587725551740321978 | 140.07605 | 59.86119 | 0.195 | 10.39 | 10.64 | 7.54 | 19.780.19 | 19.710.13 | 2.34 | 10.90 | 0.77 | 9.05 |
| 587731521208582257 | 140.49748 | 45.15344 | 0.235 | 10.82 | 1.53 | 9.65 | 19.170.13 | 18.800.06 | 2.22 | 10.54 | 1.99 | |
| 587725551203451103 | 140.60236 | 59.61079 | 0.277 | 10.40 | 16.56 | 7.16 | 20.630.27 | 20.180.17 | 2.30 | 11.47 | 0.57 | |
| 588007004167012515 | 140.65002 | 56.27194 | 0.191 | 10.32 | 6.25 | 7.93 | 19.910.19 | 19.230.08 | 3.15 | 11.10 | 1.28 | 9.11 |
| 587731913110520003 | 140.65392 | 48.95396 | 0.185 | 10.42 | 16.01 | 7.21 | 19.600.16 | 19.100.07 | 0.84 | 11.09 | 0.58 | |
| 588010136804786207 | 140.90192 | 54.81091 | 0.222 | 10.56 | 1.14 | 9.65 | 19.680.17 | 19.450.10 | 1.36 | 9.97 | 0.85 | 8.86 |
| 587725470673535009 | 141.13921 | 57.73800 | 0.227 | 10.69 | 9.29 | 7.96 | 19.420.16 | 2.28 | 11.18 | 0.75 | 8.98 | |
| 588013384341913605 | 141.50169 | 44.46005 | 0.181 | 10.73 | 1.03 | 9.91 | 18.760.10 | 18.840.06 | 0.46 | 9.20 | 0.72 | 8.46 |
| 587731521746043150 | 141.68233 | 46.17589 | 0.154 | 10.31 | 12.61 | 7.31 | 19.410.15 | 19.190.08 | 1.45 | 10.55 | 0.64 | |
| 588007006315544766 | 142.18282 | 59.00600 | 0.226 | 10.62 | 27.68 | 6.94 | 19.570.04 | 19.340.02 | 0.34 | 10.54 | 2.46 | 8.77 |
| 587729385531310202 | 142.37518 | 50.58275 | 0.223 | 10.46 | 11.44 | 7.54 | 19.940.22 | 19.620.10 | 2.87 | 10.98 | 0.89 | 9.10 |
| 587731680122110146 | 142.46309 | 46.42466 | 0.188 | 10.33 | 8.15 | 7.71 | 19.850.18 | 0.90 | 10.26 | 0.98 | 8.86 | |
| 587725816405098641 | 143.44133 | 59.84856 | 0.231 | 10.37 | 1.98 | 8.98 | 20.250.23 | 19.860.11 | 0.41 | 9.70 | 1.00 | 8.70 |
| 587732484347723780 | 143.78641 | 42.78500 | 0.234 | 10.59 | 2.76 | 8.91 | 19.740.17 | 19.360.09 | 1.62 | 10.21 | 1.36 | 8.81 |
| 587728932420255860 | 143.99200 | 53.45718 | 0.199 | 10.38 | 8.38 | 7.74 | 19.860.17 | 19.450.08 | 1.55 | 10.86 | 1.05 | 9.11 |
| 588009365863989360 | 143.99982 | 54.36830 | 0.262 | 10.69 | 5.77 | 8.37 | 19.760.17 | 19.170.07 | 1.71 | 10.88 | 1.64 | |
| 588009367475847371 | 147.05156 | 56.99398 | 0.214 | 10.31 | 14.44 | 7.19 | 20.200.21 | 20.260.12 | 2.64 | 11.00 | 1.03 | |
| 587725816943083550 | 147.10237 | 61.66580 | 0.173 | 10.43 | 1.04 | 9.60 | 19.390.04 | 19.280.02 | 9.88 | 0.92 | ||
| 587725816406081719 | 147.16391 | 61.22299 | 0.185 | 10.91 | 8.46 | 8.26 | 18.360.03 | 1.95 | 10.82 | 0.24 | ||
| 587731868014084272 | 147.40846 | 47.39235 | 0.249 | 10.36 | 6.32 | 7.96 | 20.470.23 | 20.510.17 | 2.20 | 10.61 | 1.10 | 9.06 |
| 587731869088219192 | 147.90614 | 48.66147 | 0.135 | 10.39 | 1.89 | 9.04 | 18.910.11 | 18.990.07 | 0.56 | 9.46 | 0.49 | 8.25 |
| 588010135732814044 | 147.92696 | 56.43008 | 0.283 | 10.38 | 6.04 | 8.02 | 20.720.27 | 20.310.12 | 1.48 | 10.68 | 1.07 | 9.11 |
| 588009367476174965 | 148.14238 | 57.40535 | 0.257 | 10.49 | 3.90 | 8.51 | 20.220.21 | 19.710.09 | 1.74 | 10.78 | 2.35 | 9.00 |
| 587732049484513320 | 148.64407 | 51.58557 | 0.130 | 10.78 | 1.55 | 9.60 | 17.840.07 | 0.89 | 9.56 | 1.35 | 8.63 | |
| 587735241719021680 | 148.73982 | 39.74292 | 0.198 | 10.46 | 9.21 | 7.73 | 19.640.15 | 19.270.08 | 2.61 | 11.08 | 1.26 | |
| 588009367476306065 | 148.80473 | 57.53416 | 0.141 | 10.40 | 2.46 | 8.82 | 18.990.12 | 19.220.08 | 0.19 | 9.62 | 0.82 | 8.60 |
| 588016526633861363 | 149.22546 | 38.67062 | 0.205 | 10.40 | 8.84 | 7.71 | 19.900.18 | 19.850.10 | 1.58 | 10.85 | 0.55 | |
| 588009367476568126 | 149.58009 | 57.82781 | 0.201 | 10.42 | 12.82 | 7.41 | 19.780.17 | 19.520.10 | 2.84 | 11.20 | 0.86 | |
| 587735239571603546 | 149.87546 | 38.15611 | 0.211 | 10.31 | 9.22 | 7.58 | 20.170.20 | 19.720.09 | 3.47 | 10.87 | 1.04 | 9.13 |
| 588009365865758909 | 150.09341 | 56.59479 | 0.228 | 10.31 | 10.50 | 7.47 | 20.370.22 | 20.080.13 | 2.20 | 11.03 | 1.08 | |
| 587735239571669282 | 150.10429 | 38.41888 | 0.252 | 10.41 | 12.81 | 7.40 | 20.360.22 | 20.370.13 | 3.54 | 11.13 | 1.33 | 9.08 |
| 587729387144806501 | 150.50368 | 55.12448 | 0.247 | 10.45 | 5.26 | 8.21 | 20.210.20 | 19.580.09 | 2.42 | 11.09 | 1.70 | |
| 588297864722382971 | 152.10156 | 42.73342 | 0.181 | 10.33 | 4.58 | 8.21 | 19.760.18 | 19.720.10 | 2.55 | 10.78 | 0.73 | 9.06 |
| 587732482202861656 | 152.16473 | 44.11267 | 0.151 | 10.56 | 11.73 | 7.62 | 18.760.10 | 18.550.05 | 0.59 | 11.05 | 0.64 | |
| 587732135914045580 | 152.51022 | 48.11020 | 0.255 | 10.44 | 15.28 | 7.27 | 20.330.22 | 20.130.16 | 2.05 | 11.40 | 0.65 | |
| 587732135377109127 | 152.62944 | 47.70260 | 0.190 | 10.46 | 7.01 | 7.97 | 19.560.15 | 19.400.08 | 2.44 | 10.78 | 1.22 | 9.07 |
| 587732136451047490 | 152.72443 | 48.49102 | 0.158 | 10.34 | 3.32 | 8.50 | 19.420.14 | 19.740.10 | 2.18 | 10.78 | 0.31 | |
| 587725816944459876 | 153.04662 | 63.41769 | 0.246 | 10.33 | 1.23 | 9.35 | 20.500.23 | 20.080.11 | 0.59 | 9.84 | 1.02 | 8.76 |
| 587732483814129906 | 153.54796 | 45.79028 | 0.161 | 10.38 | 11.82 | 7.44 | 19.370.14 | 18.970.06 | 1.80 | 11.02 | 0.81 | |
| 587729388219662459 | 153.73042 | 57.11367 | 0.255 | 10.35 | 10.92 | 7.48 | 20.530.24 | 19.930.10 | 4.46 | 11.21 | 0.93 | 9.15 |
| 587732152571986075 | 153.91460 | 45.34412 | 0.211 | 10.34 | 12.79 | 7.33 | 20.100.19 | 19.700.09 | 8.48 | 11.48 | 0.66 | |
| 588009368551817353 | 154.89285 | 60.22631 | 0.156 | 10.31 | 14.23 | 7.21 | 19.440.14 | 19.530.10 | 1.42 | 11.23 | 0.43 | |
| 587731500796739661 | 155.78958 | 54.49640 | 0.214 | 10.37 | 9.54 | 7.61 | 20.070.20 | 19.740.09 | 0.00 | 11.22 | 0.55 | |
| 587731869090709644 | 155.85841 | 51.10234 | 0.138 | 10.40 | 5.64 | 8.10 | 18.950.12 | 18.660.06 | 1.00 | 10.08 | 0.85 | 8.82 |
| 587732048949739624 | 156.04276 | 53.32828 | 0.185 | 10.40 | 10.56 | 7.55 | 19.650.16 | 19.280.08 | 0.69 | 11.03 | 0.82 | 9.05 |
| 587732048412868688 | 156.30435 | 52.87869 | 0.177 | 10.31 | 12.45 | 7.32 | 19.760.17 | 19.530.10 | 1.76 | 10.96 | 1.09 | |
| 587732582053117989 | 156.54250 | 56.66665 | 0.197 | 10.32 | 7.57 | 7.76 | 20.000.18 | 4.31 | 11.24 | 0.62 | ||
| 587732135378354188 | 156.55821 | 48.74970 | 0.160 | 10.47 | 2.17 | 9.00 | 19.130.12 | 18.910.06 | 0.25 | 9.91 | 1.10 | 8.33 |
| 588013383810220184 | 157.34006 | 49.69535 | 0.194 | 10.35 | 11.42 | 7.44 | 19.880.17 | 19.950.10 | 2.49 | 10.81 | 0.60 | |
| 587731870701977714 | 157.43727 | 52.86215 | 0.227 | 10.36 | 6.85 | 7.89 | 20.240.21 | 20.060.13 | 3.37 | 11.05 | 1.94 | 9.06 |
| 588009370685276243 | 157.76656 | 58.93386 | 0.173 | 10.44 | 2.46 | 8.86 | 19.370.17 | 18.720.07 | 10.13 | 1.42 | 8.70 | |
| 588007005245472903 | 157.82327 | 62.65335 | 0.198 | 10.39 | 4.69 | 8.25 | 19.830.17 | 20.100.13 | 1.40 | 10.90 | 0.70 | |
| 588007005782540350 | 158.33391 | 63.18797 | 0.145 | 10.62 | 5.32 | 8.37 | 18.500.09 | 18.180.05 | 2.25 | 10.99 | 2.10 | 9.06 |
| 587725551744909441 | 159.76553 | 65.55137 | 0.117 | 10.43 | 7.33 | 7.90 | 18.470.09 | 18.170.05 | 2.70 | 10.82 | 1.07 | 9.12 |
| 587732049487790084 | 159.83974 | 54.78919 | 0.186 | 10.57 | 2.92 | 8.84 | 19.210.13 | 18.620.05 | 0.09 | 9.54 | 1.13 | 8.62 |
| 587729386073489559 | 160.15704 | 56.81467 | 0.148 | 10.32 | 3.03 | 8.56 | 19.290.16 | 19.220.09 | 0.15 | 10.64 | 1.67 | 8.85 |
| 587725817483034723 | 160.69228 | 65.39616 | 0.189 | 10.34 | 9.44 | 7.59 | 19.840.05 | 19.180.02 | 1.59 | 11.04 | 1.45 | 9.13 |
| 587725551745564802 | 162.93958 | 66.10591 | 0.170 | 10.31 | 0.86 | 9.64 | 19.650.04 | 19.300.02 | 1.08 | 9.57 | 1.15 | 8.83 |
| 587725819094696047 | 165.08723 | 67.48546 | 0.191 | 10.33 | 5.02 | 8.13 | 19.900.23 | 19.420.10 | 1.50 | 11.19 | 1.37 | 9.14 |
| 587729386075455636 | 168.17336 | 58.13764 | 0.154 | 10.36 | 11.11 | 7.47 | 19.290.13 | 18.800.06 | 1.82 | 11.11 | 1.03 | |
| 587729153595539594 | 169.57059 | 63.26297 | 0.238 | 10.38 | 2.24 | 8.88 | 20.300.22 | 20.420.13 | 1.27 | 10.23 | 1.34 | 8.91 |
| 588011099410071613 | 169.80771 | 62.91817 | 0.286 | 10.32 | 4.04 | 8.31 | 20.900.28 | 20.270.12 | 0.75 | 10.95 | 0.67 | |
| 587729155743875234 | 173.26578 | 65.22815 | 0.241 | 10.72 | 0.38 | 10.77 | 19.480.04 | 19.620.02 | 0.01 | 8.94 | 0.51 | 8.19 |
| 588009372836757702 | 174.94957 | 63.15313 | 0.245 | 10.41 | 1.98 | 9.02 | 20.290.23 | 20.470.14 | 1.59 | 10.40 | 1.11 | |
| 587725816412766387 | 180.20340 | 66.43546 | 0.120 | 10.35 | 8.36 | 7.71 | 18.730.10 | 18.610.06 | 1.86 | 11.05 | 0.71 | 9.10 |
| 587728677395234987 | 189.59756 | 64.20047 | 0.212 | 10.38 | 10.17 | 7.57 | 20.000.21 | 19.870.11 | 0.25 | 11.12 | 0.97 | |
| 587728677932105821 | 189.88033 | 64.68499 | 0.133 | 10.50 | 1.48 | 9.36 | 18.600.11 | 0.52 | 9.83 | 0.94 | 8.62 | |
| 587725552827105291 | 208.48289 | 66.80015 | 0.198 | 10.66 | 1.89 | 9.31 | 19.160.13 | 18.480.05 | 0.84 | 9.99 | 1.71 | 8.72 |
| 588848899930194109 | 219.96780 | -0.07335 | 0.203 | 10.34 | 10.99 | 7.46 | 20.010.08 | 19.770.04 | 2.37 | 10.91 | 0.69 | |
| 587725575888634103 | 260.11795 | 59.22827 | 0.221 | 10.46 | 12.54 | 7.47 | 19.920.06 | 2.39 | 11.40 | 0.17 | ||
| 587725575888634081 | 260.18839 | 59.27158 | 0.154 | 10.31 | 7.50 | 7.76 | 19.420.04 | 19.000.02 | 2.34 | 10.66 | 0.82 | 9.02 |
| 587725576425505123 | 261.11240 | 59.28925 | 0.255 | 10.50 | 9.42 | 7.75 | 20.170.06 | 19.830.04 | 0.84 | 11.31 | 0.96 | |
| 587730847960924833 | 312.50006 | 0.52355 | 0.164 | 10.37 | 0.60 | 10.01 | 19.420.23 | 19.670.18 | 1.47 | 10.65 | 0.93 | |
| 587730846887707478 | 313.79340 | -0.31749 | 0.198 | 10.41 | 2.52 | 8.81 | 19.780.24 | 18.740.09 | 1.09 | 10.25 | 1.00 | 8.74 |
| 587730847962104313 | 315.19748 | 0.55589 | 0.254 | 10.59 | 6.32 | 8.19 | 19.930.24 | 19.850.14 | 1.26 | 11.25 | 1.33 | |
| 587730848499237044 | 315.84958 | 0.99881 | 0.177 | 10.32 | 7.51 | 7.77 | 19.720.31 | 19.530.17 | 4.22 | 11.15 | 1.51 | |
| 587727212271567298 | 317.70895 | -8.01180 | 0.211 | 10.39 | 21.74 | 6.92 | 19.980.08 | 19.760.04 | 6.37 | 11.15 | 0.63 | |
| 587730847428510324 | 322.76953 | 0.09779 | 0.178 | 10.33 | 7.76 | 7.75 | 19.720.18 | 19.650.12 | 2.25 | 10.56 | 0.93 | 9.06 |
| 587730846891704703 | 322.89319 | -0.30288 | 0.213 | 10.66 | 10.84 | 7.79 | 19.330.14 | 19.840.16 | 2.37 | 11.44 | 0.63 | |
| 587727212273992007 | 323.27859 | -8.59399 | 0.217 | 10.51 | 9.72 | 7.74 | 19.760.19 | 20.170.13 | 3.08 | 11.16 | 0.70 | |
| 587731186725814690 | 325.83533 | 0.25139 | 0.169 | 10.37 | 13.48 | 7.31 | 19.500.19 | 19.160.13 | 0.00 | 11.37 | 0.60 | |
| 587731187799687683 | 326.06918 | 1.09551 | 0.243 | 10.48 | 11.41 | 7.57 | 20.110.23 | 19.990.17 | 0.85 | 11.06 | 1.12 | 9.27 |
| 587731187799753015 | 326.25107 | 1.19933 | 0.204 | 10.39 | 0.77 | 9.82 | 19.910.22 | 19.240.11 | 1.32 | 10.12 | 1.47 | 8.86 |
| 587726877808591211 | 333.18124 | -9.00390 | 0.247 | 10.40 | 12.67 | 7.40 | 20.350.25 | 19.980.12 | 0.71 | 11.08 | 0.82 | |
| 587726879958302970 | 338.32794 | -7.73724 | 0.210 | 10.39 | 11.18 | 7.49 | 19.970.23 | 19.380.15 | 1.09 | 11.02 | 0.90 | |
| 587726877811605723 | 340.03107 | -9.63157 | 0.154 | 10.42 | 11.17 | 7.53 | 19.140.20 | 19.460.14 | 2.19 | 10.97 | 0.54 | |
| 587726877274800314 | 340.15994 | -10.09933 | 0.084 | 10.37 | 8.62 | 7.70 | 17.850.10 | 17.720.06 | 3.27 | 10.55 | -0.02 | |
| 587730815752667321 | 340.18524 | -10.27453 | 0.257 | 10.51 | 6.55 | 8.08 | 20.180.29 | 19.980.21 | 3.29 | 10.76 | 1.37 | |
| 587730817365245979 | 344.72656 | -9.34214 | 0.116 | 10.50 | 3.40 | 8.64 | 18.300.09 | 17.840.04 | 0.67 | 9.97 | 1.15 | 8.65 |
| 587731187808731205 | 346.76562 | 1.21978 | 0.126 | 10.43 | 0.71 | 9.93 | 18.660.02 | 18.270.01 | 0.65 | 10.15 | 0.92 | 8.82 |
| 587731187809059012 | 347.51736 | 1.17908 | 0.207 | 10.41 | 6.18 | 8.03 | 19.880.20 | 19.750.13 | 2.19 | 11.10 | 1.06 | 9.16 |
| 588015508191051903 | 349.55417 | -0.69060 | 0.252 | 10.85 | 2.40 | 9.29 | 19.270.04 | 18.820.02 | 0.76 | 9.92 | 1.56 | 8.68 |
| 587731186736365813 | 349.90442 | 0.22842 | 0.185 | 10.74 | 20.00 | 7.34 | 18.790.03 | 19.630.03 | 10.85 | 0.50 | ||
| 587731187273892048 | 351.41345 | 0.75200 | 0.277 | 10.52 | 1.06 | 9.67 | 20.320.06 | 20.200.03 | 0.73 | 9.31 | 0.78 | 8.61 |
| 587731187811549347 | 353.21692 | 1.23279 | 0.187 | 10.33 | 6.85 | 7.86 | 19.840.24 | 20.030.18 | 1.48 | 10.33 | 0.64 | 9.06 |
| 587731186737938564 | 353.46399 | 0.28075 | 0.198 | 10.50 | 7.96 | 7.90 | 19.560.19 | 19.270.12 | 1.17 | 10.56 | 1.61 | 8.96 |
| 587731186738266349 | 354.30264 | 0.27763 | 0.212 | 10.51 | 8.15 | 7.89 | 19.690.19 | 19.600.10 | 2.36 | 10.37 | 0.94 | 8.99 |
| 588015509266890925 | 354.41162 | 0.05134 | 0.186 | 10.31 | 8.35 | 7.67 | 19.870.20 | 20.390.15 | 3.09 | 10.59 | 0.45 | |
| 588015510342402184 | 358.44873 | 0.90061 | 0.223 | 10.48 | 2.17 | 9.01 | 19.890.19 | 20.030.14 | 0.27 | 9.55 | 0.53 | 8.22 |
| 588015510342468082 | 358.57800 | 0.94167 | 0.232 | 10.42 | 11.38 | 7.51 | 20.130.22 | 20.230.16 | 1.07 | 10.71 | 1.04 | 9.07 |
| 587727225152733191 | 358.70636 | -10.97845 | 0.121 | 10.35 | 1.89 | 9.00 | 18.760.12 | 18.380.06 | 0.74 | 10.08 | 0.94 | 8.62 |
| 588015509269053589 | 359.30862 | 0.14575 | 0.262 | 10.38 | 7.69 | 7.81 | 20.530.26 | 19.560.12 | 2.32 | 11.01 | 1.59 | 8.89 |
Note. — UVLG sample. Col. (1): SDSS Object ID number. Col. (2): Right Ascension (2000). Col. (3): Declination (2000). Col. (4): Redshift from SDSS pipeline. Col. (5): Log of FUV luminosity (corrected for Galactic extinction). Col. (6): Seeing-corrected half light radius in -band. Col. (7): Log of FUV surface brightness (corrected for Galactic extinction). Col. (8): FUV magnitude (corrected for Galactic extinction). Col. (9): NUV magnitude (corrected for Galactic extinction). Col. (10): FUV attenuation using the Balmer decrement measured on the SDSS spectra, and the Calzetti (2001) starburst attenuation law. Col. (11): Log of stellar mass determined via SED fitting. Col. (12): Log of extinction-corrected star formation rate determined via SED fitting. Col. (13): Metallicity using the Tremonti et al (2004) method.
| Parameter | Large UVLGs | Compact UVLGs | Supercompact UVLGs | LBGsaaProperties for LBGs are taken from Shapley et al. (2001), Erb et al. (2006a), Papovich et al. (2001), Giavalisco et al (2002), and Ferguson et al. (2004). |
|---|---|---|---|---|
| ( kpc-2) | ( kpc-2) | |||
| Number | 110 | 105bbThe supercompact UVLGs are a subset of the compact UVLGs, i.e., the compact UVLG sample includes the 35 supercompact UVLGs. | 35bbThe supercompact UVLGs are a subset of the compact UVLGs, i.e., the compact UVLG sample includes the 35 supercompact UVLGs. | |
| log () | to | to | to | to |
| log ( kpc-2) | to | to | to | to |
| log (kpc) | to | to | to | to |
| log () | to | to | to | to |
| to | to | to | to | |
| log SFR ( yr-1) | to | to | to | to |
| log SFR/ (yr-1) | to | to | to | to |
| FUV | to | to | to | to |
| 12+log(O/H)ccMetallicity determined using the Tremonti et al (2004) technique. | to | to | to | to |
| 12+log(O/H)ddMetallicity determined using the technique (see Pettini & Pagel 2004; Erb et al 2006a.)
|
to | to | to | to |