Small-Scale X-ray Variability in the Cassiopeia A Supernova Remnant
Abstract
A comparison of X-ray observations of the Cassiopeia A supernova remnant taken in 2000, 2002, and 2004 with the Chandra ACIS-S3 reveals the presence of several small scale features () which exhibit significant intensity changes over a 4 year time frame. Here we report on the variability of six features, four of which show count rate increases from 10% to over 90%, and two which show decreases of 30% – 40%. While extracted 1-4.5 keV X-ray spectra do not reveal gross changes in emission line strengths, spectral fits using non-equilibrium ionization, metal-rich plasma models indicate increased or decreased electron temperatures for features showing increasing or decreasing count rates, respectively. Based on the observed count rate changes and the assumption that the freely expanding ejecta has a velocity of 5000 km s-1 at the reverse shock front, we estimate the unshocked ejecta to have spatial scale variations of pc, which is consistent with the X-ray emitting ejecta belonging to a more diffuse component of the supernova ejecta than that seen in the optically emitting ejecta, which have spatial scales 10-3 pc.
Subject headings:
ISM: individual (Cassiopeia A) - supernova remnants - ISM: dynamics1. Introduction
Cassiopeia A (Cas A) is currently the youngest known Galactic supernova remnant (SNR) with an estimated explosion date no earlier than around 1670 AD (Thorstensen et al., 2001; Fesen et al., 2006a). The remnant consists of optical, infrared, and X-ray emission arranged in a shell roughly 4 diameter ( 4 pc at 3.4 kpc; Reed et al. 1995) consisting of undiluted supernova (SN) ejecta rich in O, Si, Ar, Ca, and Fe heated by the remnant’s 3000 km s-1 reverse shock (Chevalier & Kirshner, 1978, 1979; Douvion et al., 1999; Hughes et al., 2000; Willingale et al., 2003; Hwang & Laming, 2003; Laming & Hwang, 2003; Morse et al., 2004).
Viewed in X-rays, the remnant’s brightest emission is concentrated in a 30 thick, 110 radius emission ring dominated by thermal plasma arising from shock heated SN debris. Farther out beyond this emission ring, lies fainter filamentary X-ray emission (radius 150) associated with the current position of the remnant’s 6000 km s-1 forward blast wave as it moves through the surrounding circumstellar material (Gotthelf et al., 2001; DeLaney & Rudnick, 2003).
If the remnant’s expanding SN ejecta were uniform in density and chemical composition, X-ray emission from the shocked ejecta would appear as a uniform ring of emission with little spectral variation. What is actually observed, however, is a patchy, irregular ring of clumpy emission reflecting the inhomogeneous nature of the expanding SN debris as it interacts with the reverse shock front. Due both to strong ejecta clumping caused by radiative cooling instabilities and the turbulent mixing of different chemical layers of the progenitor star during the SN explosion, the resulting X-ray emission morphology is structurally and chemically complex (Hughes et al., 2000; Hwang et al., 2000).
Although Cas A’s reverse shock front has been located to arcsecond accuracy in a few regions through high-resolution optical images (Fesen et al., 2001; Morse et al., 2004), it has only been broadly localized through a sharp increase in X-ray emission in azimuthal averages of selected portions of the remnant (Gotthelf et al., 2001). On small spatial scales, evidence for the reverse shock interacting with the ejecta would be manifested in X-rays as a rise in emission as the SN ejecta is shocked and decelerated. Post-shock cooling of the metal-rich ejecta could lead to equally dramatic localized emission declines.
Here we present an analysis of archival Chandra images of Cas A which show a number of substantial, small-scale brightness changes between 2000 and 2004 which we interpret as marking regions of reverse shock passage. We report on spectral analyses for six specific regions and find some plasma temperature changes in the X-ray emitting ejecta. In 2 we present the relevant Chandra observations and subsequent data reduction. In 3 we discuss the results from our analysis, and summarize our conclusions in 4.
2. Observations and Data Reduction
Cas A was observed with the ACIS-S3 chip as part of the Chandra Guest Observer program for 50 ksec both on 30 January 2000 and 6 February 2002, and for 1 Msec as a Chandra Very–Large Project during the first half of 2004 (see Hwang et al. 2000; Gotthelf et al. 2001; DeLaney & Rudnick 2003 for details regarding the 2000 and 2002 observations, and Hwang et al. 2004 for the 2004 observations.). The CCD pixel scale of ACIS undersamples the telescope’s resolution. We reprocessed these data using the latest version (3.2) of the Chandra Calibration Database (CalDB). This reprocessing focused on recalculating the aspect solution for better positional accuracy. Version 3.2 of the CalDB was also used in the generation of detector response matrices used in the spectral fitting, which is discussed below.
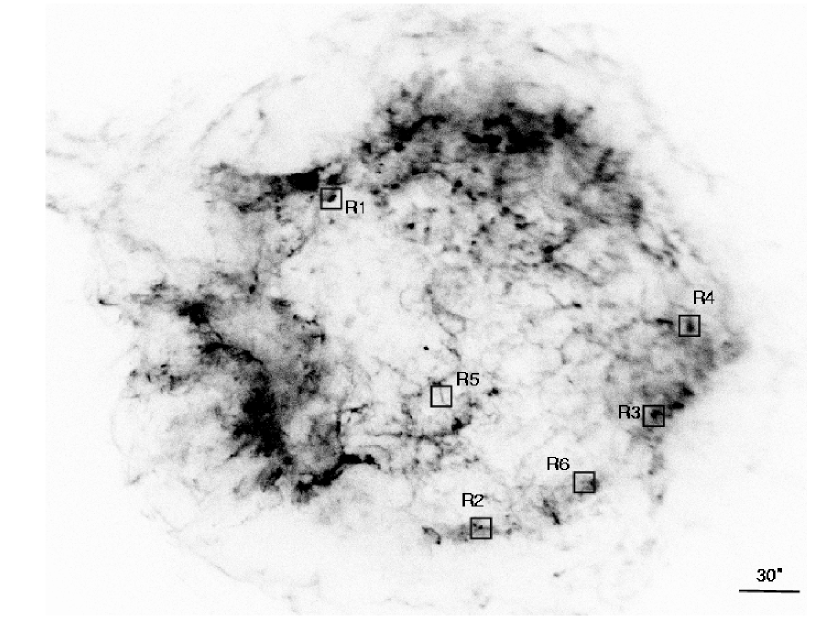
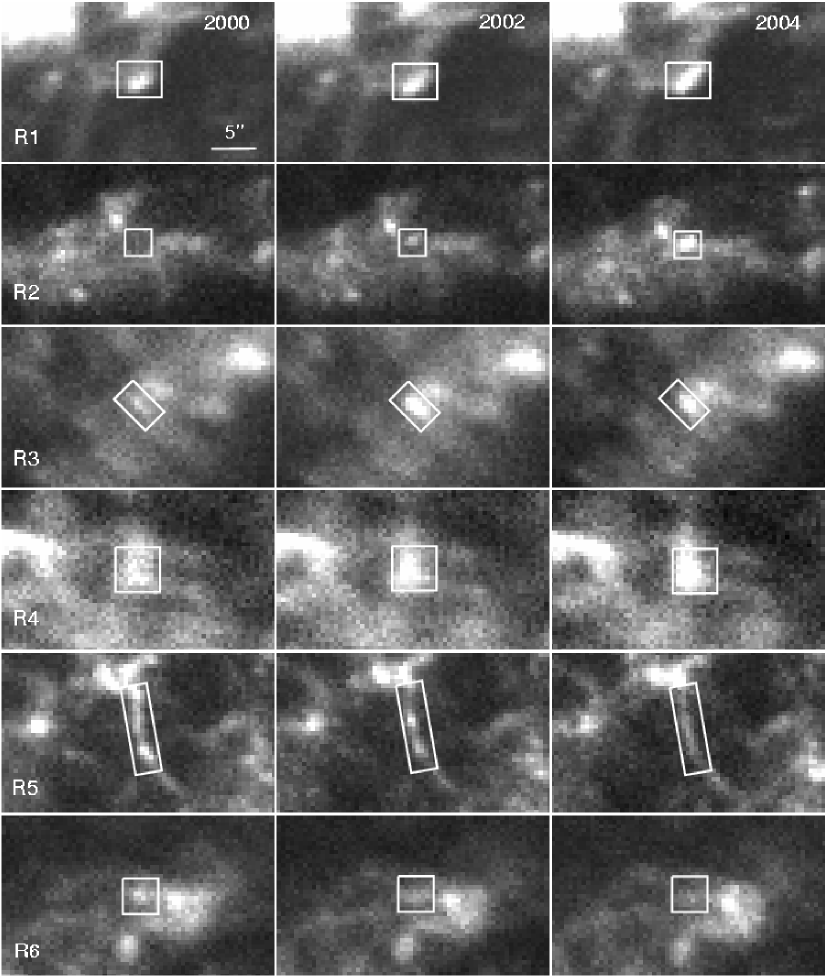
Both direct visual comparisons of the three epoch images and image differences and subtractions were used to identify several small scale regions where the detected flux appeared to vary with time. Six selected regions showing significant flux variations in the total ACIS band (0.3 – 10.0 keV) are marked in Figure 1 with enlargements shown for the years 2000, 2002, and 2004 in Figure 2. The coordinates, sizes of the extracted flux regions, and count rates are given in Table 1. The quoted rates for each epoch are normalized to the observed count rate of the remnant’s central X-ray point source (Tananbaum, 1999; Aschenbach, 1999; Pavlov & Zavlin, 1999).
Spectra were extracted for the six regions listed in Table 1. Background subtraction was done by selecting regions close to the knots. The background spectra were binned such that each detector channel contained a minimum of 10 counts. The background spectra were then fit to models appropriate for a thermal plasma in non-equilibrium ionization. More specifically, since we are investigating regions in the interior of the SNR, the background contains contributions from swept up circumstellar material as well as diffuse emission from shocked supernova ejecta around the regions of interest. This method of background subtraction is preferred to using ACIS Blank-Sky images since scattered X-rays from the SNR are the dominant source of background here. Furthermore, while the source spectra were found to vary, the background spectra comes from the diffuse emission around the knots and does not vary.
In order to minimize the effects of Chandra’s azimuthally varying point spread function which are manifest in the combined 2004 observations (Hwang et al., 2004), we limited ourselves to using a 50 ksec subset (ObsID 5196; 8 February 2004) of the 1 Msec observation when extracting the 2004 spectra, since the observational parameters for these data closely match those of the 2000 (ObsID 114) and 2002 (ObsID 1952) observations. The extracted source and background spectra were fit using version 11.2 of the X-ray spectral fitting package XSPEC.
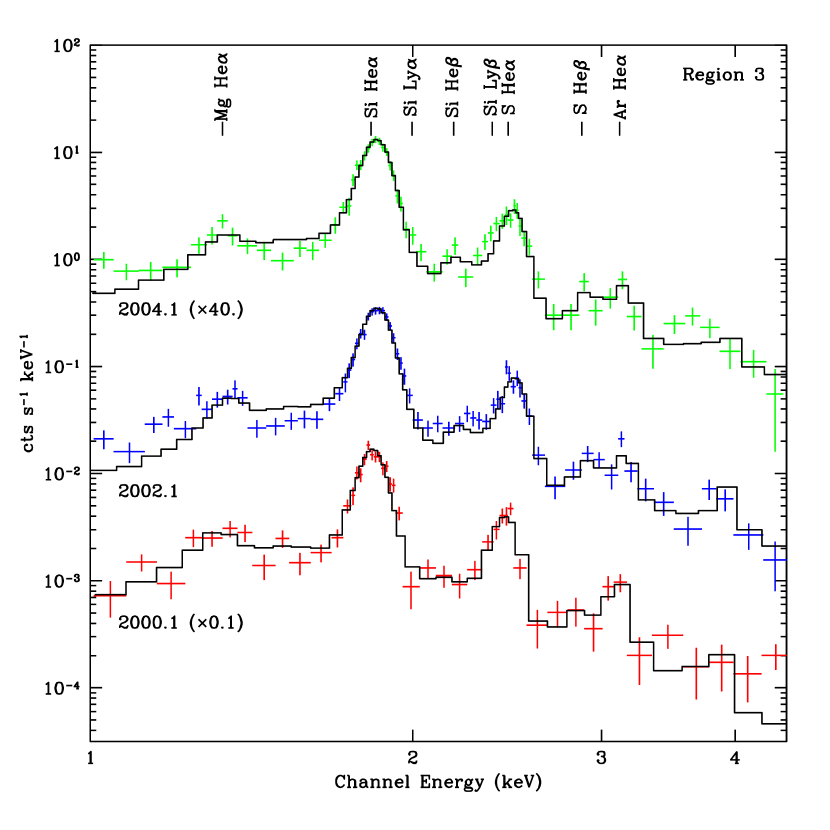
The six regions of interest are relatively small in area ( 30 arcsec2) with total observed counts of 5000 – 20,000 for the 0.3 – 10 keV energy a range for each of the three epoch observations. We grouped the extracted spectra such that there was a minimum of 10 counts in any detector channel. Moreover, since the goal of this analysis was not concerned with looking for specific abundance variations in the ejecta, we chose to limit our spectral fitting to NEI models (Borkowski et al., 2001) containing mainly Si, S, and Ar (and Mg and Ca, when there were prominent emissions visible at 1.2 and 3.8 keV, respectively) and limited the fits to between 1.0 and 4.5 keV. For all models, the ratio (Si/Si☉) was fixed at 1, while the relative abundances of the other included elements were allowed to vary. Finally, we chose to freeze the abundances of all other modeled elements (H, He, C, N, O, Ne, Ca, Fe, and Ni) at zero. We justify this by noting that these elements do not have emission lines in the energy band we are interested in. We do note, however, that by not including these elements, we may under-predict the contribution to the flux from the underlying continuum. In Table 2, we list the fitted plasma temperature for each epoch and each region, and show the data and the resulting fits in Figures 3–5.
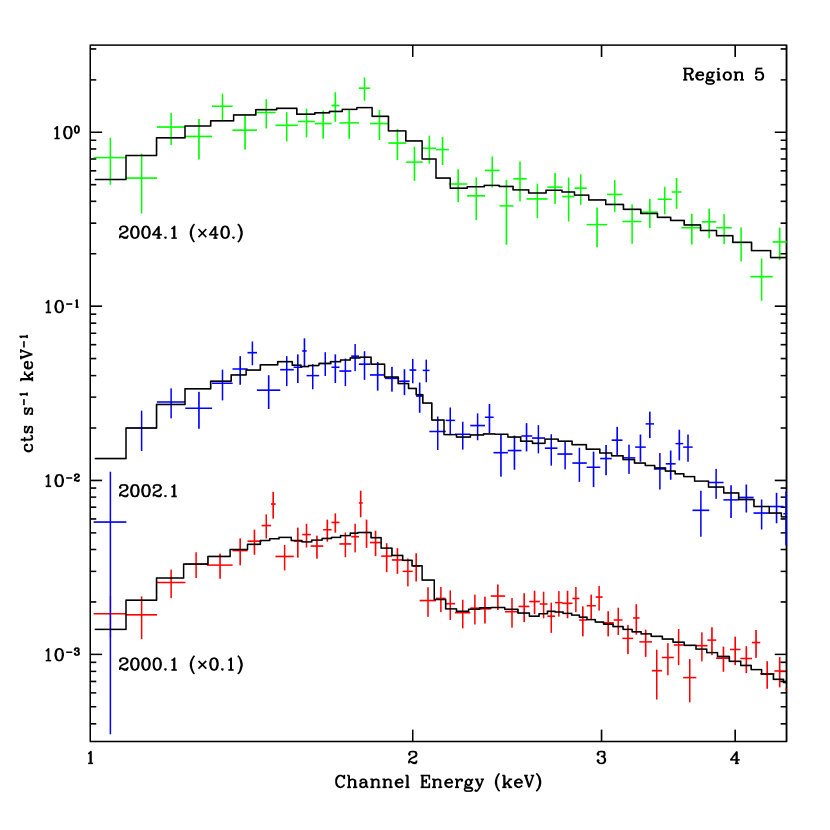
All regions, with the exception of Region 5, are well modeled as a thermal spectrum. Region 5 appears to possess purely nonthermal emission and is likely filamentary emission arising from the remnant’s forward shock front viewed in tangent like several other interior projected filamentary features (Hughes et al. 2000; Region ‘D’) and common in the remnant’s southwestern quadrant (DeLaney et al., 2004).
3. Results and Discussion
3.1. Count Rate Variations
A comparison of 2000 – 2004 Chandra images of Cas A shows fairly steady X-ray emission flux from the remnant’s shock heated ejecta on both large and small spatial scales. However, there are a few small features in the main emission ring that do show significant changes in brightness over this time interval. Most of these show increases rather than decreases although this may be due in part to a detection bias against finding changes in diffuse patches of emission, especially if they are faint.
As can be seen qualitatively in Figure 2 and quantitatively in Table 1, between 2000.1 and 2004.1 four small regions in Cas A’s X-ray emission structure exhibited significant increases in intensity while two regions showed a decrease. Specifically, Regions 1, 3, and 4 each show increases of 10%–20% between 2000 and 2004, while Region 2 went from near invisibility in 2000 to being among the brightest features in the remnant, with a near doubling of its count rate between 2002 and 2004. In 2000, the count rate in this small region is due mainly to the diffuse emission in the area around and toward the knot in Region 2. As can seen in the 2000 and 2002 images, a new and relatively bright knot emerges here, becoming twice as bright just two years later.
We note that fine-scale flux changes in the remnant are not necessarily monotonic. Region 3, for example, showed both an increase and a decrease over four years; nearly a 40% increase from 2000 to 2002 but then a 14% decrease from 2002 to 2004. The short time span of data taken in early 2004, taken as part of the 1Msec Very Large Program on Cas A, does not permit us to investigate whether this decrease continued after February 2004, but future observations could investigate this question.
Most of these flux changes occur on relatively small spatial scales, of order a few arcseconds. For example, the white box in Figure 2 centered on the emerging bright spot in Region 2 is just and yet encloses most of the observed count rate change. Similarly, the majority of the brightness change for the northeastern limb emission knot shown in Region 1 occurs along a segment of the knot’s structure extending 1” - 3” to the northwest.
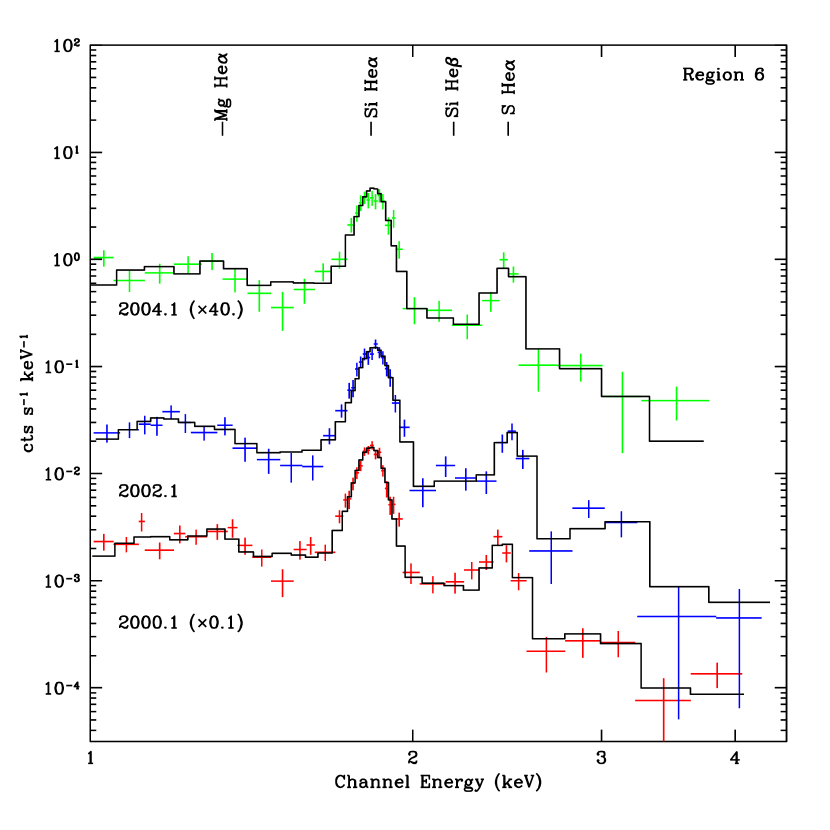
In contrast to the brightening seen for Regions 1–4, the X-ray emission detected in Regions 5 and 6 show decreases in brightness. Shown in the bottom two rows of Figure 2, the count rates in these regions drop significantly from 2002 to 2004; a 40% decrease for Region 5 and 20% in Region 6. For Region 5, the measured 40% change in flux represents an average over several small, individual features some of which exhibited large and small changes in brightness.
While it has been known for some time that a layer of contamination is forming over the ACIS detector thus reducing its overall efficiency (Plucinsky et al., 2003), the expected flux reduction from this effect is not enough to explain the overall decreases we see here. Nonetheless, to avoid uncertainties due to detector sensitivity degradation, we list in Table 2 measured count rates normalized to the observed count rate for the remnant’s central X-ray point source. Conversion of the observed count rates into intensity changes can be estimated using the X-ray point source observed erg cm-2 (for keV; see Fesen, Pavlov, & Sanwal 2006 and refs. therein).
3.2. Spectral Variations
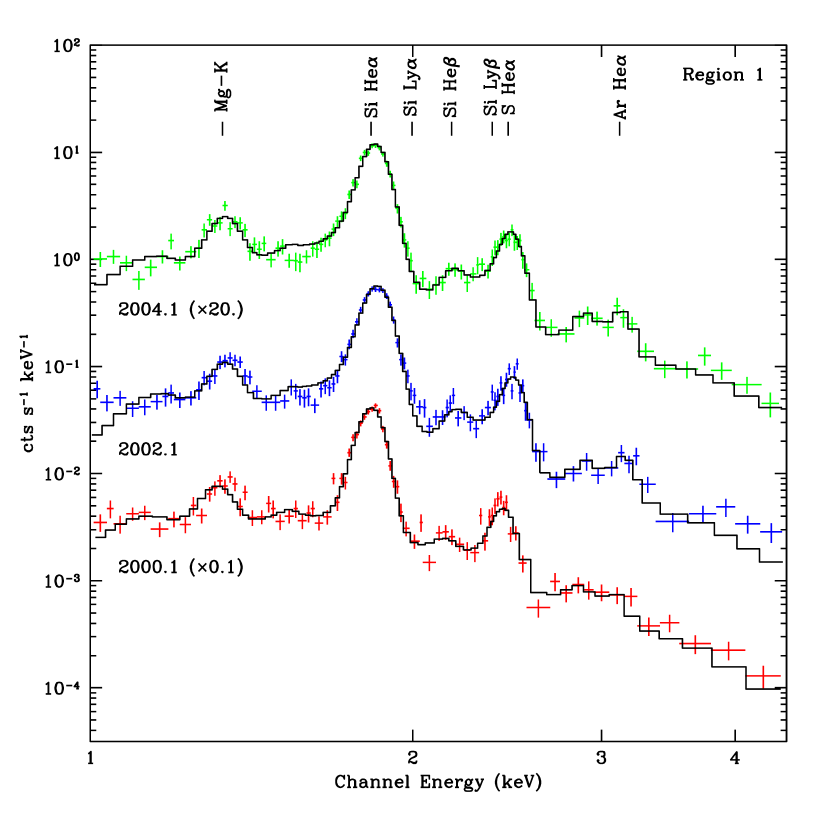
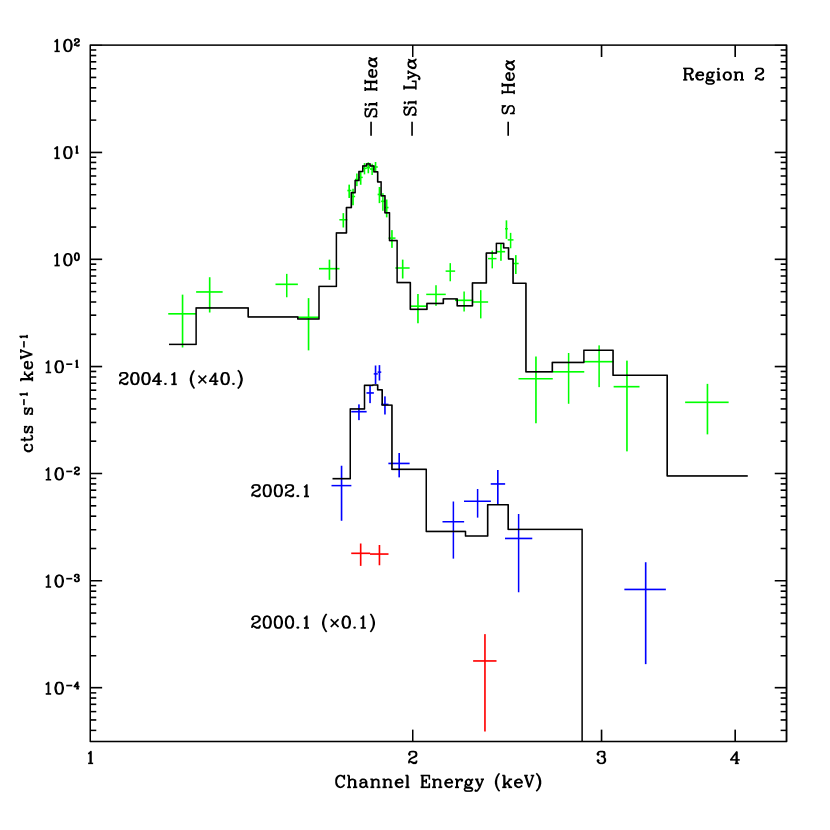
We performed spectral fits for each region to investigate whether rapid changes in the observed count rate also reflected changes in spectral properties of the emission features. In general, we find that the modeled spectra are relatively constant from year to year (cf., Region 1, Fig. 3, left, and Regions 4, Fig. 4, right), but there are exceptions. For example, Region 2 (Fig. 3, right) which showed the most extreme flux brightening, shows some evidence for the emergence of helium-like silicon and sulfur emission starting in the 2002 spectrum. From our spectral fits for this region, we also found that increased in value from 1.0 – 1.5 keV between 2002 and 2004, combined with an increase in from 4.6 – 53 1010 cm-3 s over the same time period. Such large increases in flux and ionization timescale suggest that the ejecta in this location has indeed recently encountered the remnant’s reverse shock front.
Anderson et al. (1994) predict that ejecta knots which are strongly decelerated by the reverse shock will show both a marked increase in their thermal emission (like that seen here), coupled with an increase in synchrotron emission. We have compared 6 cm VLA radio observations ( resolution) taken in April 2000 and again in April 2001 and note a qualitative increase in the radio emission around Region 2 (Delaney, 2006) which is comparable to the increase in X-ray emission. This increase in the radio and X-ray flux is consistent with the interpretation of Anderson et al. (1994). However, we do not find any corresponding changes in the radio emission for the other five regions we present here, contrary to what is expected if we interpret these flux changes in the context of Anderson et al. (1994). In particular, Region 1, which like Region 2, also shows a change in (from 0.8 – 1.1 keV) between 2000 and 2004 , does not exhibit a corresponding increase in the 6 cm radio emission (Delaney, 2006).
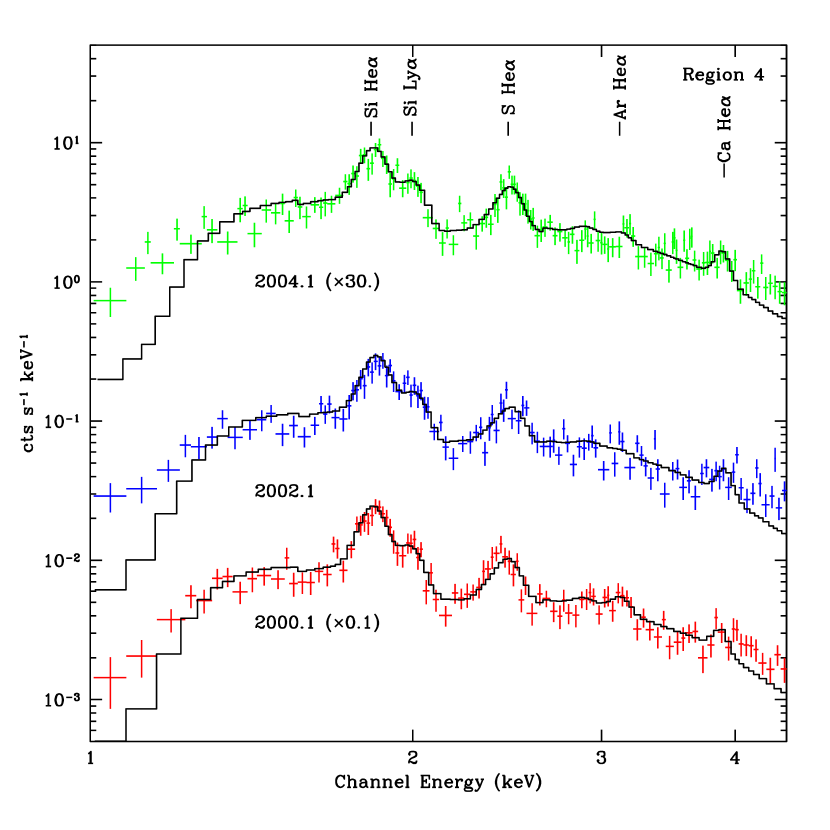
On the other hand, model fits for Region 4, a large diffuse patch along the eastern rim and which showed about the same level of X-ray flux changes as seen for Region 1, exhibited nearly a constant electron temperature over the four year period. Moreover, Region 3 (Fig. 4, left) did not exhibit the same sort of strong, monotonic changes as the other three regions. However, based on the large change in the modeled between 2000 and 2002 (Table 2) from 0.8–1.5 keV, along with the emergence of a broadening near helium-like sulfur (tentatively identified here as Si Ly) suggests that the ejecta here may be undergoing the same sort of rapid ionization seen in Region 2. Another possible spectral change seen for Region 3 is the apparent broadening of the silicon lines in the 2002 and 2004 spectra. Combined with the increase in , this suggests that the ejecta is in the process of ionizing up to the hydrogen-like state for silicon.
From its spectrum, Region 4 (Fig. 4; right) appears to be nearly in ionization equilibrium, and as noted above (Table 2) the fitted temperature stays nearly constant between 2000 and 2004. Modeling suggests that its spectrum can be equally well modeled by either a NEI plasma with an ionization age 1013 cm-3 s, or by a collisional ionization model, such as a Raymond–Smith plasma (Raymond & Smith, 1977). The high fitted ionization age is puzzling because it implies electron densities of 103 cm-3; densities which are as high as those seen in the optical knots. However, visual inspection of the spectrum for Region 4 (Fig. 4; right) shows that it is clearly different from regions which do not exhibit ionization equilibrium (i.e., Regions 1 and 3 for instance).
Morse et al. (2004) proposed that Cas A’s ejecta consists of cool, optically bright emission knots embedded in a warm, tenuous ejecta medium which is responsible for the observed X-ray emission. This general description is supported by our model fits (Table 2). Were the ejecta completely uniform, then a single temperature, single ionization age would adequately describe the spectra in all regions at each epochs. However, since we see that the fitted temperature rises in Regions 1–3, the rate at which the ejecta is being shocked in these regions is not constant due to density inhomogeneities in the preshock material.
While the four regions which showed increases in intensity appear to be associated with ejecta which has recently crossed the reverse shock, Regions 5 and 6 show flux decreases and therefore do not indicate reverse shock locations. The interior projected thin filament seen in Region 5 has a non-thermal spectrum and is likely associated with the forward and not the reverse shock front (DeLaney et al., 2004). The observed changes in its brightness probably reflects changes in path length along interconnecting tangents of the wave front of the forward shock as it interacts with the local circumstellar medium on the near-facing side of the remnant.
In contrast, emission seen in Region 6 (Fig. 5, right) which also showed a decrease in brightness, may represent ejecta cooling in the post-shock flow following reverse shock passage. Its projected location in the remnant is consistent with this identification. While it lies at approximately the same radial distance from the center of expansion as the brightening Regions 1–4, it lies just behind (eastward) a patch of optically bright emission ejecta along the remnant’s southwestern limb. If this feature is indeed fading due to cooling, this would imply it was shocked much earlier than in the other regions in the area and would be consistent with its location inside the steady X-ray and optical emission features found farther out from the remnant’s center.
3.3. Scale Length of X-ray Emitting Knots
Rapid intensity changes in small regions throughout the remnant offer some insight into the structure of the lower density component of Cas A’s SN ejecta. Abrupt increases (or decreases) in the observed count rate strongly suggest that the X-ray emitting ejecta is non-uniform on fairly small scales. This conclusion has long been clear from optical observations (Fesen et al., 2001) but not from X-ray observations which are sensitive to a much lower density, higher temperature component of the ejecta but which likely dominate the remnant’s overall mass budget (Vink et al., 1996; Willingale et al., 2003; Laming & Hwang, 2003). The velocity of the freely expanding ejecta clumps at the specific regions we investigated is not known, but a rough estimate can be made based on the distance of the reverse shock from the center of expansion. The reverse shock is located 95 ( 1.6 pc at a distance of 3.4 kpc) from the center of expansion (Gotthelf et al., 2001) and unshocked, freely expanding ejecta at this distance have been expanding for 330 yr. Therefore, we estimate that the unshocked ejecta velocity is no more than 5000 km s-1.
The observed intensity for the small features we studied show significant changes on time scales of 2–4 yrs. This suggests a scale length for spatial variations in the ejecta no larger than the distance covered by a 3000 km s-1 reverse shock moving through 5000 km s-1 expanding ejecta over the course of a few years; i.e., pc or about 1–2 arcsecond at 3.4 kpc. This scale length is consistent with the actual sizes of the variable flux features we see in the remnant. In contrast, the fine-scale structure of optical knots in Cas A are of order in size (Fesen et al., 2001), roughly an order of magnitude smaller than the spatial scale for variations seen in the clumpy component of the X-ray bright ejecta.
4. Conclusions
With the exception of the rapidly evolving remnant associated with SN 1987A (Burrows et al., 2000; Park et al., 2004), no remnant has been previously reported to show significant flux changes across portions of its X-ray emitting structure. This is due in part to the limited number of high-resolution images available on young SNRs covering a significant time span, and the relatively small number of very young Galactic or LMC/SMC SNRs known.
Inspection of X-ray data taken of the Cassiopeia A supernova remnant with Chandra ACIS-S3 in 2000, 2002, and 2004 reveals the presence of several small scale features () which exhibit significant intensity changes over this 4 year time frame. Here we described six such features four of which had count rate increases from 10% to over 90%, while two others showed decreases of 30% – 40%. Whereas the majority of the six variable flux features exhibited no gross spectral changes in the 1–4 keV energy band during the four year period, one region which had the greatest increase in brightness also showed hints of slight emission line changes as well as an increase in its 6 cm radio emission. Spectral fits using non-equilibrium ionization, metal-rich plasma models indicate increased or decreased electron temperatures for features showing increasing or decreasing count rates, respectively.
A fading emission filament projected near the remnant’s interior (Region 5) showed a completely nonthermal spectrum and thus may be associated with the forward shock front. It decreasing intensity may be the result of changing path lengths along the edges of a wavy forward shock as it interacts with the local, inhomogeneous circumstellar medium. Based on the observed count rate changes and the assumption of freely expanding 5000 km s-1 ejecta at the reverse shock front, we estimate the unshocked ejecta to have spatial scale variations of pc, consistent with the X-ray emitting ejecta belonging to a more diffuse component of the supernova ejecta.
In general, bright X-ray and optical knots are not coincident. This is not unexpected given the differences in their temperatures and densities. Moreover, the sizes of the X-ray knots () appear to be an order of magnitude larger than the optical knots (; Fesen et al. 2001). However, the remnant’s optical knots can also appear and brighten on timescales as short as a few years, not unlike the timescales we observed for these X-ray knots. Given the newly observed short term variability seen here in the X-ray, future X-ray and optical observations of selected knots and filaments might provide valuable information regarding the dynamical and radiative evolution of supernova ejecta knots over a range of densities, sizes, and postshock temperatures.
Cassiopeia A is currently the youngest and one of the most studied Galactic SNRs. The small yet noticeable changes we found combined with future X-ray observations of this bright X-ray remnant may help shed light not only on the remnant’s near-term X-ray evolution, but also help us better understand the fine-scale structure, dynamics and chemistry of debris from core-collapse supernovae in general.
References
- Anderson et al. (1994) Anderson, M. C., Jones, T. W., Rudnick, L., Tregillis, I. L., & Kang, H. 1994, ApJ, 421, L31
- Aschenbach (1999) Aschenbach, B. 1999, IAU Circ. 7249
- Borkowski et al. (2001) Borkowski, K. J., Lyerly, W. J., & Reynolds, S. P. 2001, ApJ, 548, 820
- Burrows et al. (2000) Burrows, D. N., et al. 2000, ApJ, 543, L149
- Chevalier & Kirshner (1978) Chevalier, R. A., & Kirshner, R. P. 1978, ApJ, 219, 931
- Chevalier & Kirshner (1979) Chevalier, R. A., & Kirshner, R. P. 1979, ApJ, 233, 154
- DeLaney & Rudnick (2003) DeLaney, T., & Rudnick, L. 2003, ApJ, 589, 818
- Delaney (2006) Delaney, T. private communication
- DeLaney et al. (2004) DeLaney, T., Rudnick, L., Fesen, R. A., Jones, T. W., Petre, R., & Morse, J. A. 2004, ApJ, 613, 343
- Douvion et al. (1999) Douvion, T., Lagage, P. O., & Cesarsky, C. J. 1999, A&A, 352, L111
- Fesen et al. (2001) Fesen, R. A., Morse, J. A., Chevalier, R. A., Borkowski, K. J., Gerardy, C. L., Lawrence, S. S., & van den Bergh, S. 2001, AJ, 122, 2644
- Fesen et al. (2006a) Fesen, R. A., Hammell, M. C.,Morse, J., Chevalier, R. A., Borkowski, K. J., Dopita, M. A., Gerardy, C. L., Lawrence, S. S., Raymond, J. C., & van den Bergh, S. 2006a, ApJ, 645, 283
- Fesen, Pavlov, & Sanwal (2006) Fesen, R. A., Pavlov, G. G., & Sanwal, D. 2006b, ApJ, 636, 848
- Gotthelf et al. (2001) Gotthelf, E. V., Koralesky, B., Rudnick, L., Jones, T. W., Hwang, U., & Petre, R. 2001, ApJ, 552, L39
- Hughes et al. (2000) Hughes, J. P., Rakowski, C. E., Burrows, D. N., & Slane, P. O. 2000, ApJ, 528, L109
- Hwang et al. (2000) Hwang, U., Holt, S. S., & Petre, R. 2000, ApJ, 537, L119
- Hwang & Laming (2003) Hwang, U., & Laming, J. M. 2003, ApJ, 597, 362
- Hwang et al. (2004) Hwang, U., et al. 2004, ApJ, 615, L117
- Kamper & van den Bergh (1976) Kamper, K. & van den Bergh, S. 1976, ApJS, 32, 351
- Laming & Hwang (2003) Laming, J. M., & Hwang, U. 2003, ApJ, 597, 347 133, 403
- Morse et al. (2004) Morse, J. A., Fesen, R. A., Chevalier, R. A., Borkowski, K. J., Gerardy, C. L., Lawrence, S. S., & van den Bergh, S. 2004, ApJ, 614, 727
- Park et al. (2004) Park, S., Zhekov, S. A., Burrows, D. N., Garmire, G. P., & McCray, R. 2004, ApJ, 610, 275
- Pavlov & Zavlin (1999) Pavlov, G. G., & Zavlin, V. E. 1999, IAU Circ. 7270
- Peimbert & van den Bergh (1971) Peimbert, M., & van den Bergh, S. 1971, ApJ, 167, 223
- Plucinsky et al. (2003) Plucinsky, P. P., et al. 2003, Proc. SPIE, 4851, 89
- Raymond & Smith (1977) Raymond, J. C., & Smith, B. W. 1977, ApJS, 35, 419
- Reed et al. (1995) Reed, J. E., Hester, J. J., Fabian, A. C., & Winkler, P. F. 1995, ApJ, 440, 706
- Tananbaum (1999) Tananbaum, H. 1999, IAU Circ. 7246
- Thorstensen et al. (2001) Thorstensen, J. R., Fesen, R. A., & van den Bergh, S. 2001, AJ, 122, 297
- Vink et al. (1996) Vink, J., Kaastra, J. S., & Bleeker, J. A. M. 1996, A&A, 307,
- Willingale et al. (2003) Willingale, R., Bleeker, J. A. M., van der Heyden, K. J., & Kaastra, J. S. 2003, A&A, 398, 1021
| Region | RA (J2000) | Dec (J2000) | Extraction | Normalized Count RateaaValues listed are detected counts s-1 normalized to Cas A’s X-ray point source rate of 0.120.01 cts s-1. | Count Rate Change | ||
|---|---|---|---|---|---|---|---|
| (h:m:s.s) | (° ′ ″) | Region | (2000.1) | (2002.1) | (2004.1bbEpoch 2004 count rates are calculated from Chandra Observation ID 5196, which has the same roll angle as the 2000.1 and 2002.1 observations. ) | () | |
| 1 | 23:23:34.0 | +58:49:56.2 | 1.840.02 | 2.040.01 | 2.090.01 | % | |
| 2 | 23:23:24.4 | +58:47:13.2 | 0.480.02 | 0.570.01 | 0.930.01 | % | |
| 3 | 23:23:13.4 | +58:48:10.0 | 0.930.01 | 1.280.02 | 1.100.02 | % | |
| 4 | 23:23:11.2 | +58:48:53.2 | 2.060.02 | 2.240.02 | 2.510.01 | % | |
| 5 | 23:23:26.9 | +58:48:19.0 | 1.560.02 | 1.210.02 | 0.950.02 | % | |
| 6 | 23:23:18.0 | +58:48:37.0 | 1.040.01 | 0.830.01 | 0.710.02 | % | |
| Region | (keV) | ||
|---|---|---|---|
| 2000.1 | 2002.1 | 2004.1 | |
| 1 | 0.76 | 0.86 | 1.05 |
| 2 | 1.09 | 1.46 | |
| 3 | 0.84 | 1.43 | 1.45 |
| 4 | 0.94 | 0.92 | 0.94 |
| 6 | 0.71 | 0.63 | 0.55 |