A SPECTROSCOPIC SURVEY OF REDSHIFT GALAXIES IN THE GOODS-NORTH FIELD: SURVEY DESCRIPTION, CATALOGS, AND PROPERTIES11affiliation: Based on data obtained at the W.M. Keck Observatory, which is operated as a scientific partnership among the California Institute of Technology, the University of California, and NASA, and was made possible by the generous financial support of the W.M. Keck Foundation.
Abstract
We present the results of a spectroscopic survey with the Low Resolution Imaging Spectrograph on the Keck I telescope of more than star-forming galaxies and AGN at redshifts in the GOODS-North field. Candidates are selected by their colors using the “BM” and “BX” criteria to target redshift galaxies and the Lyman break criteria to target redshift galaxies; combined these samples account for of the R and -band counts to and , respectively. The sample of BM/BX galaxies and LBGs is presently the largest spectroscopic sample of galaxies at in GOODS-N, and includes spectroscopically-confirmed distant red galaxies (DRGs) with (Vega). Extensive multi-wavelength data, including our very deep ground-based near-IR imaging to , allow us to investigate the stellar populations, stellar masses, bolometric luminosities (), and extinction of galaxies. Deep Chandra X-ray and Spitzer IRAC and MIPS data indicate that the sample includes galaxies with a wide range in , from L⊙ to L⊙, and covering 4 orders of magnitude in dust obscuration (). The sample includes galaxies with a large dynamic range in evolutionary state, from very young galaxies (ages Myr) with small stellar masses ( M⊙) to evolved galaxies (ages Gyr) with stellar masses comparable to the most massive galaxies at these redshifts ( M⊙). Spitzer data indicate that the optical sample includes some fraction of the obscured AGN population at high redshifts: at least 3 of 11 AGN in the sample are undetected in the deep X-ray data but exhibit power-law SEDs longward of m (rest-frame) indicative of obscured AGN. The results of our survey indicate that rest-frame UV selection and spectroscopy presently constitute the most time-wise efficient method of culling large samples of high redshift galaxies with a wide range in intrinsic properties, and the data presented here will add significantly to the multi-wavelength legacy of the GOODS survey.
Subject headings:
cosmology: observations — galaxies: active — galaxies: evolution — galaxies: high redshift — galaxies: starburst — galaxies: stellar content1. Introduction
Rapid advances in our understanding of galaxy evolution have been prompted by the recognition that observations covering the full spectrum are necessary to adequately interpret the physical nature of galaxies. Multi-color Hubble Space Telescope (HST) imaging of two otherwise inconspicuous fields in the high Galactic latitude sky (Williams et al., 1996, 2000) marked the inception of a decade dominated by large-scale multi-wavelength surveys. The two Hubble Deep Fields are now encompassed or supplanted by other areas of the sky which are the focus of a number of space and ground-based observations both within and peripheral to the Great Observatories Origins Deep Survey (GOODS; Dickinson et al. 2003a). Included among these data are the deepest Chandra X-ray observations (Alexander et al., 2003), HST ACS optical imaging (Giavalisco et al., 2004), Spitzer IR to far-IR imaging (Dickinson et al., in prep; Chary et al., in prep), GALEX far and near-UV imaging (Schiminovich et al., 2003), ground-based optical and near-IR imaging and spectroscopy (Capak et al., 2004; Cowie et al., 2004; Vanzella et al., 2005), and radio/submillimeter observations (Richards 2000; Pope et al. 2005).
Despite the easy access to broadband photometry and subsequent insights into galaxy evolution made possible by multi-wavelength surveys such as GOODS, important issues regarding survey completeness and the physical conditions in galaxies and their surrounding intergalactic medium can only be investigated spectroscopically. Spectroscopy of galaxies in blind flux-limited surveys can be quite inefficient and expensive, particularly if one only wants to study galaxies at certain cosmological epochs. However, we have shown that the technique of photometric pre-selection can allow one to cull large samples of galaxies in particular redshift ranges over a large range in redshift (e.g., Adelberger et al. 2004; Steidel et al. 2004, 2003, 1995; Steidel & Hamilton 1993), which can then be efficiently followed up using multi-object optical spectrographs such as the Low Resolution Imaging Spectrograph (LRIS) on the 10 m Keck telescope. Near-UV sensitive spectrographs such as the blue arm of LRIS (LRIS-B) on Keck and the Focal Reducer/low dispersion Spectrograph (FORS) on the VLT have significantly extended our capabilities by allowing for spectroscopy of key features that fall shortward of the OH emission forest for redshifts , a particularly active epoch in the context of galaxy evolution and the buildup of stellar and black hole mass. To take advantage of extensive multi-wavelength data, we included the GOODS-North (GOODS-N, hereafter) field in our ongoing survey to select and spectroscopically followup large samples of galaxies at redshifts (Steidel et al., 2004). In the interest of public dissemination of data, we present in this paper the results of our spectroscopic survey of star-forming galaxies in the GOODS-N field including associated photometry and spectroscopic redshifts. Information on the galaxies, including their photometric measurements and errors and stellar population fits, are available at the following public website: http://www.astro.caltech.edu/drlaw/GOODS/.
The outline of this paper is as follows. In § 2 we briefly describe the optical imaging, photometry, and spectroscopy. To supplement these, we have also obtained the deepest wide-area near-IR and -band imaging in the GOODS-North field, and these data are also presented in § 2. The spectroscopic results and associated catalog are presented in § 3. We describe the Spitzer IRAC and MIPS data (taken from the GOODS-N public release; Dickinson et al. in prep. and Chary et al. in prep.) for our spectroscopic sample of galaxies in § 4. Ground-based photometry and Spitzer IRAC data, together with spectroscopic redshifts, enable the modeling of the stellar populations of galaxies given certain simplifying assumptions. Our modeling procedure and results are discussed in § 5. In § 6 we describe a few characteristics of the sample of star-forming galaxies and AGN to demonstrate the wide range in intrinsic properties of UV-selected galaxies at high redshift. A flat CDM cosmology is assumed with km s-1 Mpc-1 and . All magnitudes are on the AB (Oke & Gunn, 1983) system.
2. Data and Sample Selection
2.1. Optical and Near-IR Imaging and Photometry
The imaging, photometry, color selection, and spectroscopic observations of galaxies in the fields of our survey are described in several other papers published by our group (Steidel et al., 2003, 2004; Adelberger et al., 2004; Reddy et al., 2005). Specific details regarding the GOODS-N optical imaging are presented in Reddy et al. (2005) and summarized below for convenience.
The optical images used to photometrically pre-select candidate galaxies at redshifts in the GOODS-N field were obtained in 2002 and 2003 April with the KPNO and Keck I telescopes. The KPNO MOSAIC -band image obtained from the GOODS team (PI: Giavalisco) was transformed to magnitudes (Steidel et al., 2004). The Keck I - and -band images were taken with the LRIS instrument (Oke et al., 1995; Steidel et al., 2004) and were oriented to ensure maximum overlap with the GOODS Spitzer Legacy and Hubble Treasury programs. The images cover with FWHM to a limiting magnitude of measured within a aperture ( ) in the bands. This depth ensures we are complete to , neglecting photometric scatter, for galaxies whose colors satisfy our color criteria. The optical imaging reduction and photometry were done following the procedures described in Steidel et al. (2003, 2004). The images were astrometrically calibrated using the SDSS database. Source detection is done at -band, and and colors are computed by applying the -band isophotal apertures to images in the other filters.
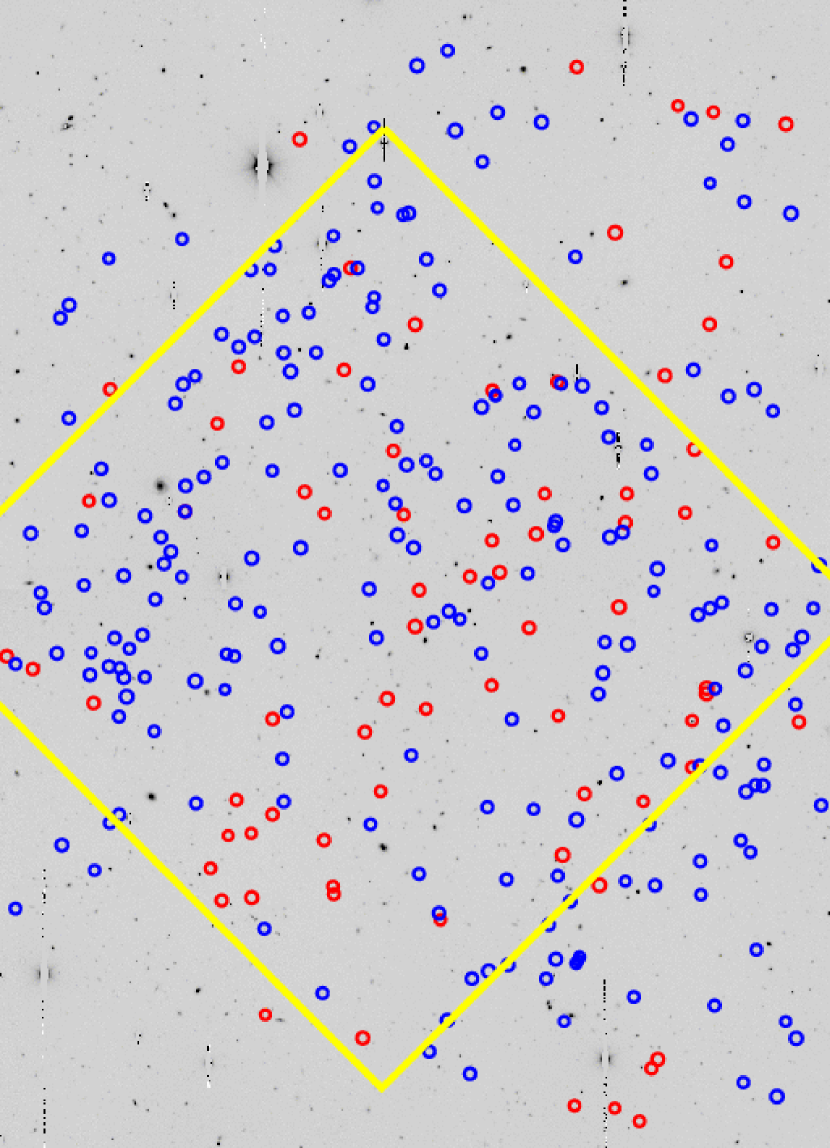
We have obtained very deep wide-area near-IR imaging at and -band in the GOODS-N field from observations with the Wide Field Infrared Camera (WIRC; Wilson et al. 2003) on the Palomar Hale m telescope. The images, taken under photometric conditions with FWHM, reach a depth of and over the central of the GOODS-N field. The near-IR imaging reduction procedure is described in detail by Erb et al. (2006c). Near-IR magnitudes were calibrated in Vega magnitudes and converted to AB units assuming the following conversions: and . Figure 1 shows the area imaged in the near-IR with respect to our optical image of the GOODS-N field.
Photometric errors for both optical and near-IR magnitudes were determined from Monte Carlo simulations. We added large numbers of simulated galaxies with known magnitudes to our images and then recovered them using the same photometric method used to detect actual galaxies. Comparing the input magnitudes with those recovered then yields an estimate of the bias and uncertainty in our photometry. The Monte Carlo method is discussed in more detail by Shapley et al. (2005). The typical errors in the optical and near-IR magnitudes range from to mag.
2.2. Photometric Selection
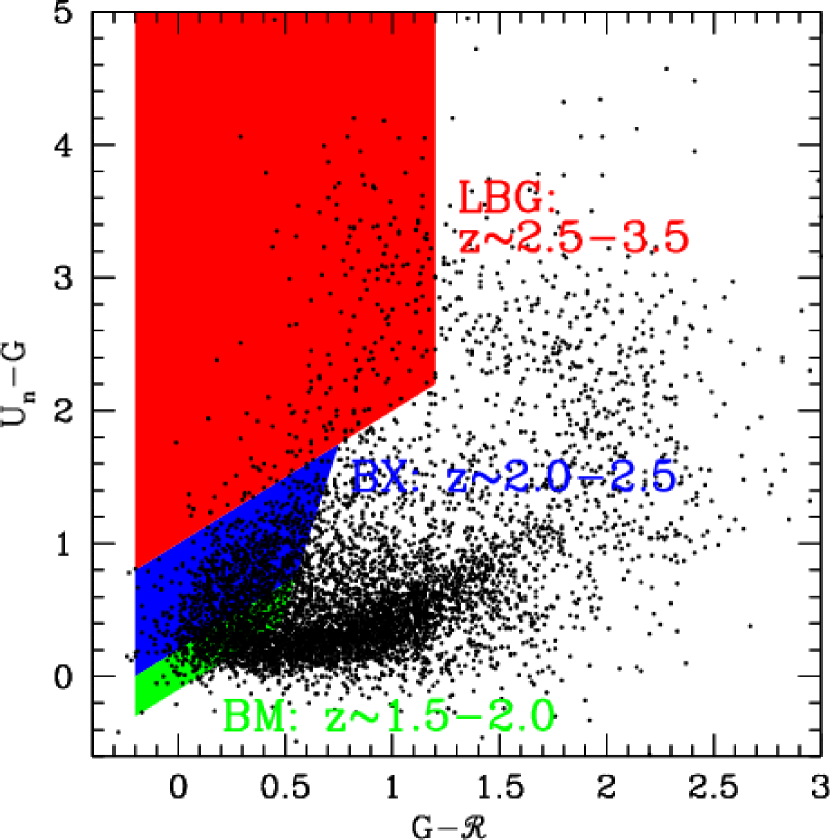
We selected galaxies in different redshift ranges between using the “BM”, “BX”, “C”, “D”, and “MD” selection criteria (Steidel et al., 2003; Adelberger et al., 2004; Steidel et al., 2004). The “C”, “D”, and “MD” criteria are used to select Lyman Break Galaxies (LBGs) at redshifts (Steidel et al., 2003)111Note that we did not select “M” galaxies in GOODS-N as was done in other fields of the survey (Steidel et al., 2003).. The “BM” and “BX” criteria were designed to cull galaxies at redshifts and , respectively, with approximately the same range of UV luminosity and intrinsic UV color as the LBGs (Adelberger et al., 2004; Steidel et al., 2004). The various selection criteria considered here are shown in Figure 2. We only considered candidates to to ensure a sample of galaxies which are bright enough such that optical spectroscopy is feasible222A few objects were candidates based on photometry of our Palomar images of the GOODS-N field (Steidel et al., 2003), but failed to satisfy the photometric selection criteria based on the newer Keck images. These objects are indicated in subsequent tables by their notation as presented in Steidel et al. (2003) or, in the case of BM/BX objects, by the letters “BX” or “BM” followed by no more than 3 numerical digits. The photometric values for these objects are the ones based on the new photometry.. This limit corresponds to an absolute magnitude mag fainter at than at , based on the distance modulus between the two redshifts. We also excluded from the sample those candidates with since almost all of these objects are stars. Optical selection yielded 1360 BM/BX and 192 C/D/MD candidates in the area of the GOODS-N field. Combined, the BX/BM and C/D/MD candidates constitute of the -band counts to . The number of candidates and their surface densities are listed in Table 1. Approximately of these candidates lie in the region imaged at and . The remainder of this paper focuses on those galaxies which have been spectroscopically confirmed to lie at redshifts , as described in the next section.
2.3. Optical Spectroscopy
We took advantage of the multi-object capabilities of the Keck LRIS instrument to obtain spectroscopy for the photometrically selected candidates. In its upgraded double-armed capacity, LRIS makes use of a dichroic to send light to both a red and blue arm. The commissioning of the blue arm of LRIS (LRIS-B) allowed, for the first time, the ability to obtain very sensitive near-UV spectroscopic observations at wavelengths as short as Å, essentially to the atmospheric transmission limit. The wavelength range from the atmospheric cutoff up to Å is particularly useful for probing the rich set of interstellar and stellar lines between Ly and C IV () for galaxies in the so-called “spectroscopic desert”, between redshifts . As shown previously in Adelberger et al. (2004) and Steidel et al. (2004), combining photometric selection of BM and BX candidates with the near-UV sensitivity of LRIS-B allows for the wholesale spectroscopy of large numbers of galaxies in this redshift range; this in turn enables us to focus our study on an epoch that was particularly active in terms of star formation and accretion activity (e.g., Dickinson et al. 2003b; Chapman et al. 2003; Fan et al. 2001; Madau et al. 1996; Shaver et al. 1996; Schmidt et al. 1995).
The instrumental setup used for spectroscopy in the GOODS-N field varied during the course of the survey; the various setups are described in more detail by Steidel et al. (2004). We selected dichroic filters designed to split the incoming beam at Å or Å. To provide maximum throughput between and Å, we used a groove mm-1 grism blazed at Å on LRIS-B, resulting in a dispersion of Å per pixel. For simultaneous observations on the red-side of LRIS (LRIS-R), we used a groove mm-1 grating blazed at Å, providing wavelength coverage up to Å. We typically obtained simultaneous blue and red side spectroscopic observations between and Å, with slight variations due to the relative placement of slits in the telescope focal plane.
The slit masks used for spectroscopy cover on the sky. For a minimum slit length of (adopted in order to ensure good background subtraction), we are able to include slits, in addition to star boxes used to accurately align each mask. We set the width of each slit to and this, combined with a typical seeing of , yields a typical resolution of Å for point sources. To obtain the optimum mix of objects on any given slit mask, we assigned each candidate a weight primarily based on its optical magnitude. We gave larger weights to objects with and lower weights for fainter objects where absorption line spectroscopy is more difficult and brighter objects where the foreground () interloper fraction is larger. Nonetheless, we filled “blank” areas of the masks with filler objects which included these fainter and brighter objects. In particular, we included some bright () objects on masks since at least some of these are intrinsically bright galaxies and are most suitable for detailed followup spectroscopic studies. To support other projects being conducted by our group, we also deliberately targeted objects within the sample that had interesting multi-wavelength properties, such as those identified with m or m emission, as well as those with unusually red near-IR colors. We also designed masks to overlap as much as possible with the near-IR imaging. Because of this, of spectroscopically confirmed galaxies with lie in the -band region, even though of candidates lie in the same region (see Figure 1).
We typically obtained 3 exposures of sec per mask, for a total exposure of sec. The range in optical magnitudes implies a large range in the S/N of the spectra. At the minimum, however, we found sec to be sufficient to obtain redshifts, and a few objects were observed on more than one mask. The spectroscopic success rate per mask is primarily a function of the weather conditions (e.g., cirrus, seeing) at the time of observation, with a success rate of obtaining redshifts in the best conditions; these redshifts, for the most part, fell within the targeted redshift ranges. This suggests that the redshift distribution for the spectroscopic and photometric samples are similar, and there are not large numbers of galaxies whose true redshifts are far from those expected based on their observed colors. Details of the spectral reduction techniques are described in Steidel et al. (2003). We identified redshifts based on the presence of a number of low-ionization interstellar absorption lines (e.g., Si II , O I+S II , C II , Si II , Fe II , Al II , and Al III ), stellar wind features (e.g., N V , S IV , and C IV ), the C III nebular emission line, or Ly emission or absorption. A few examples of spectra are shown in Steidel et al. (2003, 2004). Spectroscopically confirmed galaxies with are shown with respect to the -band image of the GOODS-N field in Figure 1.
Comparison with nebular redshifts derived from H spectroscopy indicates that Ly emission is almost always redshifted, and interstellar absorption lines are almost always blueshifted, with respect to the systemic (nebular) redshift of the galaxy. These systematic offsets have been interpreted as the result of outflows (e.g., Adelberger et al. 2003, 2005b; Pettini et al. 2001; Shapley et al. 2003). Adelberger et al. (2005b) present linear least-squares fits to the systemic redshifts of galaxies given their Ly and interstellar absorption redshifts based on a sample of objects with near-IR spectroscopy (Erb et al., 2006c; Pettini et al., 2001).
3. Spectroscopic Results and Catalog
Our spectroscopic sample in the GOODS-N field presently includes 212 BM/BX and 74 C/D/MD galaxies with secure spectroscopic redshifts (Table 2). The total sample includes 347 objects with secure spectroscopic redshifts, including interlopers with . We also include 41 objects with uncertain redshifts in Table 2, denoted by a colon (“:”) in the redshift field (for consistency with Steidel et al. 2003), for a total of objects. Table 1 lists the statistics for the individual samples, including the numbers of candidates observed, the interloper fractions, and mean redshifts. The primary source of contamination in the LBG sample is from K dwarfs in the Galactic halo. Star-forming galaxies at redshift contaminate the BX sample since their Balmer breaks mimic the Ly forest decrement. These interlopers can be easily excluded using -band photometry (e.g., the criteria; Daddi et al. 2004), but we have not imposed any additional criteria other than the observed optical magnitudes and colors. The main “contaminants” of the BM sample occur from galaxies with redshifts ; these galaxies have colors very similar to those of BM objects, and the narrow BM color selection window implies that photometric scatter and Ly perturbations on the colors can have a significant impact on the observed redshift distribution of BM galaxies (Reddy et al., in prep.). Throughout this paper we consider objects with to be contaminants. The AGN/QSO (as identified from either their X-ray, UV, or Spitzer IRAC or MIPS emission) with make up of the sample (see § 6.2 for further discussion).
For consistency, we compared redshifts for objects in common with the Team Keck Treasury Redshift Survey (TKRS; Wirth et al. 2004; Cowie et al. 2004). We note that the TKRS survey is based primarily upon observations with the DEIMOS intrument on Keck II, and so the TKRS redshift selection function rapidly declines above as the emission and absorption lines used for redshift identifiction (including [N II], [S II], [O III], [O II] emission features and Calcium H and K absorption features) are shifted out of the DEIMOS spectral range. The overlap between the and TKRS samples is small given that the two surveys target different redshifts (TKRS is better at identifying galaxies at and our selection is better at identifying galaxies at ).
There are 64 objects with redshifts in the catalog which are also in the TKRS database. Of these, 52 were previously published in other surveys of the GOODS field (Cowie et al., 2004; Cohen et al., 1996, 2000; Cohen, 2001; Barger et al., 2000, 2003; Wirth et al., 2004; Phillips et al., 1997; Lowenthal et al., 1997; Dawson et al., 2001; Steidel et al., 2003, 1996; Dickinson, 1998) and/or have agreement in redshift between the and TKRS samples. Upon further inspection of the 12 objects with discrepant redshifts, we adopted the TKRS redshift for 6 of them (BX1202, BX1371, BMZ1010, BMZ1100, BMZ1121, and BMZ1208); the redshifts for these 6 galaxies are all below where the DEIMOS-determination was found to be secure and where our BM selection function drops off. Five of the objects had the correct redshifts in our catalog (BX1299, BX1319, BX1805, BMZ1119, and BMZ1375). For the remaining object, BX1214, we were able to rule out the Cohen et al. (2000) redshift of , but were unable to confidently assign a redshift based on our LRIS spectrum.
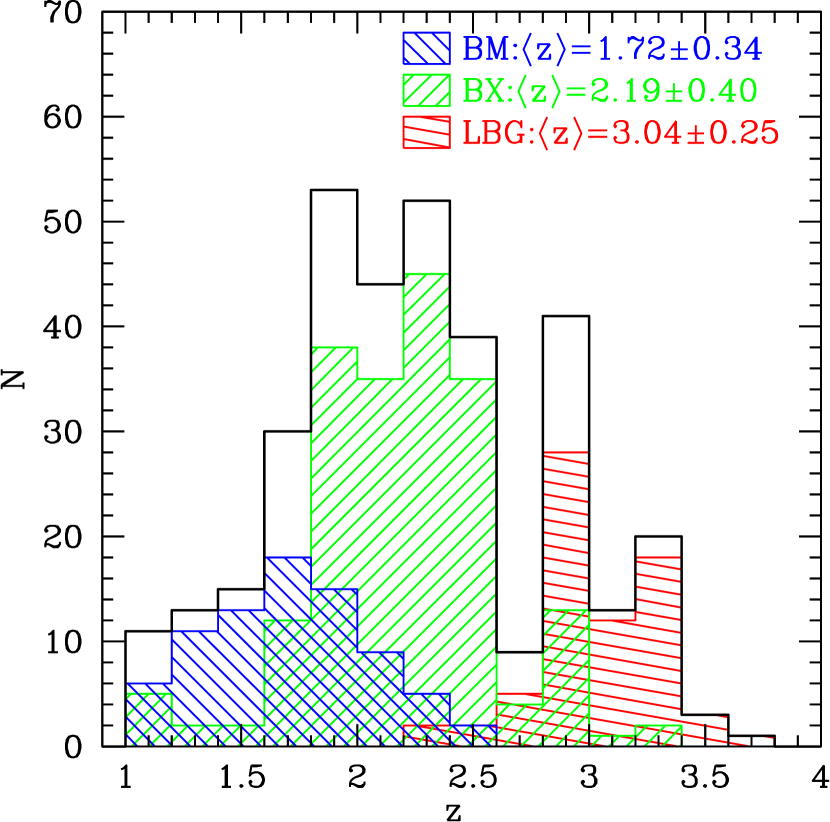
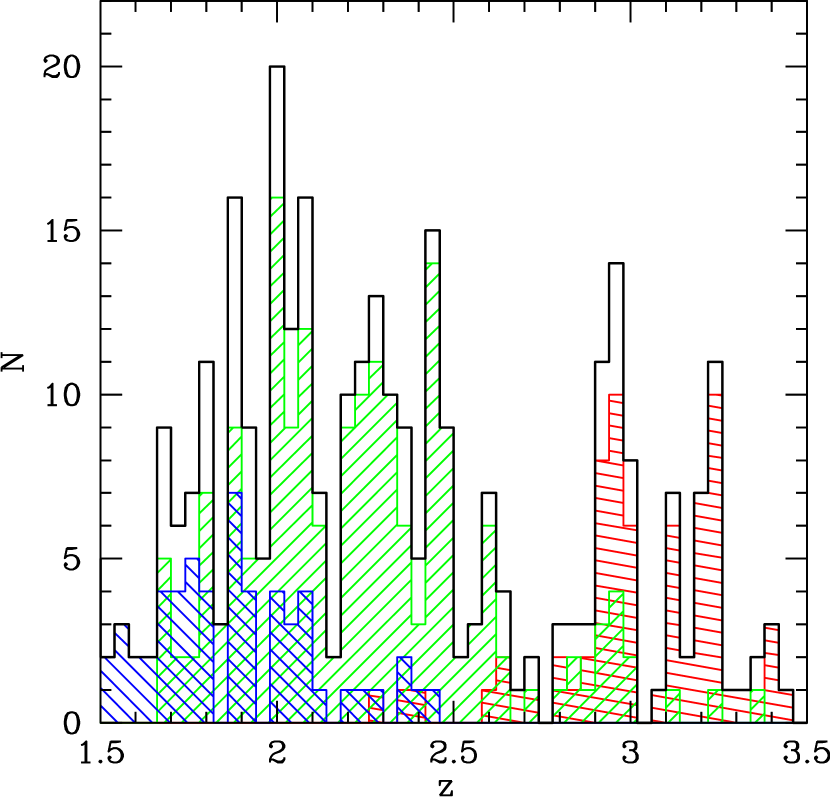
The redshift distributions of BM/BX and LBG galaxies with are shown in Figure 3, where the right panel emphasizes large-scale structure in the GOODS-N field. The redshift over-density at is prominent, and was also noted in the LBG survey (Steidel et al., 2003). We also note a possible over-density at , which corresponds to an over-density of 5 submillimeter galaxies as noted by Blain et al. (2004). However, we caution that Figure 3 only presents raw numbers, and we have not accounted for the selection function and relative fractions of candidates observed. Therefore, the significance of any redshift “over-densities” appearing in Figure 3 is not quantified.
4. Spitzer IRAC and MIPS Data
To aid in understanding the stellar populations and extinction of galaxies, we compiled Spitzer IRAC and MIPS photometry for our sample of -selected galaxies using the public Spitzer data in the GOODS-N field (Dickinson et al., in prep; Chary et al., in prep). The IRAC photometry was performed by fitting an empirical point spread function (PSF) determined from the IRAC images to the spatial positions of sources from the higher resolution -band data. Specifically, to accurately compute the empirical PSF for each IRAC channel we used as many isolated point sources located throughout the IRAC images as possible. Changing the number of objects used to compute the PSF results in variations of the best-fit fluxes of , and is generally small compared to the background noise (see below). Using the -band data to constrain source positions mitigates the effects of confusion by allowing for the deblending of partially resolved sources in the IRAC images, and is similar to the method employed by the GOODS team for extracting photometry (Dickinson et al., in prep; Chary et al., in prep; see also Labbé et al. 2005 and Shapley et al. 2005). We extracted the MIPS m fluxes of galaxies using a similar procedure; the spatial positions of sources from the IRAC data were used to deblend and extract the m fluxes (Reddy et al., 2006). Errors for both IRAC and MIPS photometry were computed from the dispersion of extracted fluxes for 100 PSFs fit to random blank regions around each galaxy. Since the IRAC and MIPS data are background-limited, the errors will be dominated by the background noise for all but the brightest galaxies at these wavelengths. The IRAC channel magnitudes and MIPS m fluxes are listed in Table 2.333Magnitude and flux errors for the Spitzer data are provided in the accompanying machine-readable table. We do not give fluxes for those galaxies which were either undetected or were badly blended with a nearby bright source. Of the 212 BX/BM galaxies with secure spectroscopic redshifts , only 2 () are undetected at m to the GOODS IRAC depth. Of the 74 LBGs, 11 () are undetected at m. The MIPS detection fraction is for BX/BM galaxies, decreasing to a for the LBGs, to a limiting flux of Jy.
5. Stellar Population Modeling
The combination of multi-wavelength photometry and spectroscopic redshifts allows us to better constrain the stellar populations of UV-selected galaxies than if we only had photometric redshifts. To demonstrate the wide range in stellar populations of UV-selected galaxies at redshifts , we fit the IRAC magnitudes with Bruzual & Charlot (2003) models assuming a Salpeter (1955) IMF and solar metallicity. The assumption of solar metallicity is a reasonable approximation for most galaxies in the -selected sample (Erb et al., 2006a). The models were corrected for the effects of IGM opacity before comparing to the observed magnitudes. In fitting the stellar populations, we assumed an exponentially-declining star formation history with decay time scales 10, 20, 50, 100, 200, 500, 1000, 2000, and 5000 Myr, and (constant star formation, CSF, model). We also assumed a varying amount of reddening, or , from to . The best-fit model was taken to be the combination of , age, and that gave the lowest value with respect to the observed magnitudes. The star formation rate (SFR) and stellar mass are determined from the normalization of the model to the observed magnitudes. Even with spectroscopic redshifts, there is considerable uncertainty in the best-fit parameters, with the exception of the total stellar mass which is generally robust to changes in the assumed star formation history (e.g., Papovich et al. 2001; Shapley et al. 2001; Sawicki & Yee 1998; Shapley et al. 2005; Erb et al. 2006c). The best-fit stellar population parameters for both a CSF and model for each galaxy are collected in Table 3. Monte Carlo simulations indicate that the typical fractional uncertainties associated with the best-fit parameters (when including IRAC data in the fits) are , , , and in , age, SFR, and stellar mass, respectively (Erb et al., 2006c). For completeness we have included the best-fit SFRs from the fitting in Table 3, but we note that we have several other independent multi-wavelength measures of the SFRs for these galaxies (e.g., from dust-corrected UV, H, and m data) that are unaffected by the degeneracies associated with stellar population modeling.
Aside from the systematic errors resulting from the degeneracy between star formation history and the best-fit parameters, there are additional caveats to the SED results. Around 30 objects had optical through IRAC photometry which is inconsistent with the stellar population models considered here; these objects exhibit large J/ and IRAC magnitude residuals with respect to the best-fit stellar population (and have ), and often give unrealistically young ages ( Myr) and large SFRs ( ). We do not present the SED results for these galaxies. In addition to these 30, there are 4 galaxies which fit the optical and IRAC data well, but have large residuals with respect to the best-fit stellar population (i.e., a magnitude more than away from the best-fit). Three of these 4 galaxies have redshifts where the magnitude may be contaminated by emission from H+[N ii]. The 4 galaxies with large residuals are indicated by the notation “” in Table 3. Also, we noted a few objects with m excesses when compared with the best-fit stellar population, many of which have large m fluxes ( Jy) indicating they may be obscured AGN (see Table 5). We do not present SED fitting results for any of the sources which may have AGN based on their m and m excesses and/or X-ray/optical emission. Finally, we did not perform SED fitting for galaxies without photometry longward of -band or which had redshifts . The best-fit SED parameters for the remaining galaxies are listed in Table 3. Note that the SFRs and stellar masses () in Table 3 assume a Salpeter (1955) IMF from to M⊙. Assuming the Chabrier (2003) IMF with a shallower faint-end slope results in SFRs and stellar masses a factor of lower than listed in Table 3. We also note that a number of galaxies have inferred ages Myr, which are unlikely given the dynamical time-scale of Myr for star formation in galaxy-sized objects. The SED parameters for these galaxies with extremely young inferred ages should be taken with caution.
6. The Diverse Properties of Optically-Selected Galaxies at High Redshift
6.1. Star-Forming Galaxies
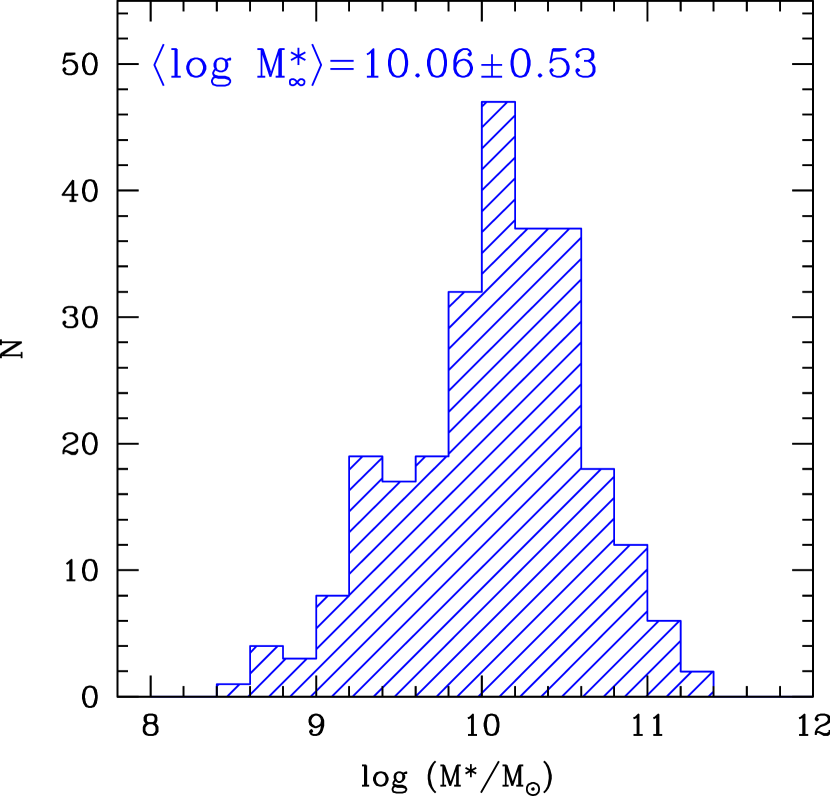
Of the best-fit SED parameters, the stellar mass is the least uncertain and is generally robust to changes in the assumed star formation history, as can be seen by comparing columns 6 and 11 in Table 3. Figure 4 shows the distribution of stellar masses for -selected galaxies with redshifts , assuming a constant star formation history. Table 4 shows the median and mean stellar masses and dispersion (assuming a CSF history) for galaxies in the various samples. While the mean stellar mass of the sample is M⊙, there is large dispersion about this mean of a factor of . This mean stellar mass is a factor of lower than found in Shapley et al. (2005) and Erb et al. (2006c), partly because we included galaxies undetected to in the sample considered here (as long as they had IRAC data to constrain the stellar mass), and these faint galaxies on average have lower stellar masses than -detected galaxies. Further, we have included BM galaxies which have a mean stellar mass that is a factor of lower than than the mean stellar mass for BX galaxies and LBGs (Table 4). This difference in mean stellar mass likely reflects the fact that BM galaxies have a lower mean redshift (; Figure 3) than BX galaxies and LBGs, and therefore we are able to probe down to fainter absolute magnitudes and are sensitive to lower mass galaxies.
Regardless, the sample includes galaxies with a wide range in ages, from young galaxies with ages comparable to the dynamical timescale for star formation of Myr to those which are older than Gyr. In fact, the sample includes galaxies which are as old ( Gyr) and as massive ( M⊙) as galaxies found at in near-IR selected samples (e.g., the distant red galaxies, or DRGs, of Franx et al. 2003)444Optically selected galaxies which satisfy the DRG criteria ( in Vega magnitudes, or in AB) are indicated by “DRG” in the last column of Table 2. There are such DRGs with secure spectroscopic redshifts in our sample.. In particular, Shapley et al. (2005) and Reddy et al. (2005) have shown that while the typical stellar mass of near-IR selected DRGs with is larger by an order of magnitude than the typical stellar mass of -selected galaxies to , the actual range in stellar mass probed by DRG selection does not appear to significantly exceed the range in stellar mass of -selected galaxies (although we note that DRG selection appears to be much more efficient is selecting galaxies with M⊙ at ; e.g., van Dokkum et al. 2006). Further, SED analysis of the optically-selected DRGs (as indicated in Table 2 by the notation “DRG” in the last column) with fainter near-IR magnitudes () have stellar masses that are comparable to the stellar masses of typical -selected galaxies ( M⊙). While optical selection allows us to very efficiently followup galaxies spanning over two orders of magnitude in age and stellar mass at redshifts , other techniques are required to assess the total stellar mass budget at these redshifts (e.g., Rudnick et al. 2006; van Dokkum et al. 2006; Reddy et al. 2005).
While the and SFRs determined from SED modeling are more uncertain than the inferred stellar masses, we have several independent methods of assessing the extinction and SFRs in galaxies, made possible by the extensive multi-wavelength data in the GOODS-N field. The exquisite, photon-limited Chandra X-ray data in the GOODS-N field, currently the deepest X-ray data ever taken (Alexander et al., 2003), allow for stacking analyses to estimate the average emission properties of galaxies (Brandt et al., 2001; Nandra et al., 2002; Reddy & Steidel, 2004; Reddy et al., 2005). Based on the stacking analyses of Nandra et al. (2002) and Reddy & Steidel (2004), the mean SFRs of -selected galaxies is , with mean attenuation factors, defined as the ratio between the bolometric SFR and UV-based SFR (uncorrected for extinction), of .
The X-ray data allow us to determine the average extinction and SFRs of galaxies over the entire range of redshifts probed by the BX/BM and LBG criteria. However, important progress has been made in determining the individual properties of galaxies in a narrower redshift range, , where the Spitzer MIPS m band is sensitive to the m polycyclic aromatic hydrocarbon (PAH) dust emission ubiquitous in local and high redshift star forming galaxies (Reddy et al., 2006; Papovich et al., 2006). Reddy et al. (2006) demonstrate that the m emission of galaxies can be used as a tracer of the SFR or total infrared luminosity (), particularly for galaxies with spectroscopic redshifts where we are able to accurately constrain the K-corrections from m flux to rest-frame m luminosity. The MIPS data indicate that -selected galaxies at redshifts span more than 3 orders of magnitude in , from those which are undetected to the sensitivity limit of Jy for MIPS data in the GOODS field, to those which have comparable to the most luminous star-forming galaxies at these redshifts, the submillimeter galaxies (Smail et al., 1997; Hughes et al., 1998; Barger et al., 1998; Chapman et al., 2005). The mean infrared luminosity for -selected galaxies is L⊙, assuming that the rest-frame infrared emission () as probed by MIPS observations scales with infrared luminosity as as determined from local samples (see Reddy et al. 2006), and this value of inferred from MIPS is in excellent agreement with X-ray and dust-corrected UV-based estimates. Reddy et al. (2006) further demonstrate that the agreement in SFR extends to galaxies on an individual (object-by-object) basis for a small sample of -selected galaxies with both m and H detections: the scatter between the bolometric luminosity inferred from m versus H observations is dex. Finally, we have compared the m-estimated SFRs with those obtained from the SED-fitting analysis: as expected they are positively correlated at the level with a scatter of dex assuming a CSF model.555Adopting a declining model, as opposed to assuming a CSF model for all galaxies, will generally increase the scatter in SFRs since the youngest galaxies will have inferred SFRs (from declining star formation history models) that are systematically lower than those inferred from H observations (see discussion in Erb et al. 2006b). The advantage of multi-wavelength data is that we can assess SFRs independent of the degeneracies associated with SED-fitting. In summary, the -selected sample includes galaxies over 4 orders of magnitude in dust obscuration (), from those galaxies with little dust and whose UV luminosity is comparable to , to those which are heavily dust-obscured and have attenuation factors .
Aside from the large dynamic range in SFRs and extinction of -selected galaxies, the sample also hosts galaxies with a wide range in morphology and kinematics (Erb et al. 2003, 2006c; Law et al., in prep.), from disk-like galaxies with signatures of rotation, as inferred from H spectral data (e.g., Forster Schreiber et al. 2006), to those galaxies which appear irregular and/or are merging. UV-selected samples efficiently target the redshift range where the morphological transformation of galaxies from irregular at high redshift to the Hubble sequence at low redshifts () takes place. The deep Hubble ACS data in the GOODS field (Giavalisco et al., 2004) combined with our extensive rest-frame UV spectroscopic database make it possible to study in detail the correlation between morphological structure and the SFRs, extinction, masses, and spectral properties of high redshift galaxies (Law et al., in prep.).
6.2. AGN
The combination of X-ray, observed optical, m, and m data, along with spectroscopic redshifts, allows for a powerful probe of AGN activity among -selected galaxies. We classified objects as AGN based on one or more of the following criteria: (a) the presence of high ionization UV lines (identical to the method used in Steidel et al. 2002 and Shapley et al. 2005); (b) direct detection in the Chandra 2 Ms data (Alexander et al., 2003) and an X-ray-to-optical flux ratio indicative of AGN (e.g., see Hornschemeier et al. 2001 and Reddy et al. 2005); or (c) an and m flux excess above what one would expect from a simple star-forming population. Table 5 lists the 11 AGN with confirmed redshifts which have emission indicative of AGN.
MD31 is the most unusual source: it has an X-ray counterpart within of the optical position, but shows no evidence of AGN from the rest-UV (observed optical) spectrum nor from Spitzer observations. The SED analysis indicates that MD31 is best-fit with an Gyr old population with a modest and SFR assuming the CSF model, and thus is not expected to be bright in X-rays as a result of star formation alone (i.e., the 2 Ms X-ray sensitivity implies a detection threshold of at the redshift of MD31, ). Examination of the deep ACS imaging in the GOODS field reveals no other optical counterpart within of MD31. If the X-ray counterpart is indeed associated with accretion activity in MD31, then the X-ray detection fraction of AGN with in our sample is , or . On the other hand, the fraction of AGN showing m and/or m excesses is , or . While the object statistics are insufficient to judge the efficiency of AGN detection in the X-ray versus IR, we note that the IRAC and MIPS integration time for any given object in the GOODS-N field is hours, whereas the X-ray integrations required to detect faint AGN at redshifts is on the order of a megasecond or larger. The possible difference in AGN detection fraction and especially integration time between the IR and X-ray observations suggest that deep IR imaging may be a more efficient method of finding AGN at high redshifts. In this case, the m and m data indicate at least an additional 3 AGN which are unidentified in X-rays. For comparison, while our optical spectra have integration times of s, a factor of 370 times shorter than the X-ray integration time ( Ms), we can still detect of AGN based on their rest-frame UV emission lines.
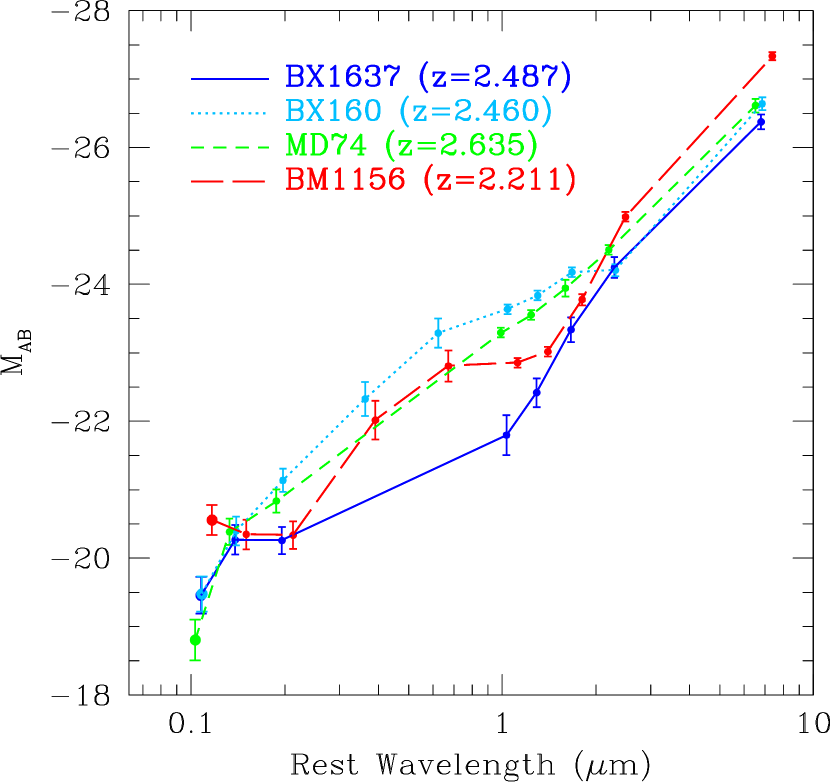
The properties of the 3 X-ray undetected AGN with are worth further consideration: these AGN are BX1637, BX160, and MD74. Figure 5 shows the observed optical through m SEDs of these AGN, as well as BM1156 which is very weakly detected in X-rays, and demonstrates the power-law behavior at observed wavelengths longer than m, indicative of warm dust population. The three X-ray undetected AGN are also not detected in the deep radio imaging of the HDF (Richards, 2000), placing a upper limit on their observed GHz flux of Jy. However, all three have disturbed and/or extended rest-frame UV morphologies from deep ACS imaging (Giavalisco et al., 2004), suggesting the obscured AGN in these systems may be triggered by merger activity. The non-detection of these three AGN (even when stacking them) in both the soft ( keV) and full ( keV) X-ray bands of Chandra makes it difficult to constrain their column densities. Nonetheless, these three AGN have a mean spectroscopic redshift of , and if we assume the AGN have intrinsic photon index of (e.g., Alexander et al. 2005), then we cannot rule out the possibility that these could be Compton-thick AGN with column densities cm-2. Comparison with the m and m fluxes of Mrk 463 and Mrk 1014, two infrared luminous AGN (Armus et al., 2004), suggests that BX1637 and MD74 could have total infrared luminosities in the range L⊙. Constraints on the m fluxes of these two AGN could narrow the range of possible , but unfortunately submillimeter observations do not cover the region containing these two AGN. BX160 is covered in published m imaging and is undetected to mJy (Wang et al., 2004), suggesting an upper limit on the infrared luminosity of L⊙. We caution, however, that the lack of data across the Raleigh-Jeans tail of the dust SEDs makes it difficult to accurately constrain the dust temperatures and hence total bolometric luminosities of these sources.
The presence of obscured AGN at high redshifts has been postulated based on the expected fraction of high column density AGN ( cm-2) at in simulations that model the contribution to the X-ray background (Comastri & Fiore, 2004; Gilli, 2004). While high column density AGN may be unidentifiable as AGN based on their optical spectra alone, the fact that some fraction of their host galaxies are optically bright () and fall within optically-selected samples bodes well for determining their spectroscopic redshifts. Accurate spectroscopic redshifts are particularly important for constraining AGN column densities (); the inferred depends strongly on the assumed redshift, (Alexander et al., 2005).
In summary, of the 11 AGN with in our optically-selected sample, () are detected in X-rays to Ms, () are detected with and/or m excesses, and () have rest-frame UV signatures of AGN. Even in the deepest X-ray image available, there is still a considerable number of AGN that remain undetected, and we must incorporate other techniques, e.g., optical spectra and and m data, to fully account for the census of AGN.
7. Summary
We have presented the results of a spectroscopic survey of redshift star-forming galaxies in the GOODS-North field, made possible by efficient UV () color selection and the unique multi-object capabilities of the LRIS instrument on the Keck I telescope. Our sample consists of 212 redshifts for galaxies at redshifts selected using the BM and BX criteria of Adelberger et al. (2004) and Steidel et al. (2004), and 30 new redshifts (of a total of 74) for Lyman break galaxies at redshifts . Our deep optical and near-IR imaging, supplemented by publicly available Spitzer IRAC and MIPS data (Dickinson et al., in prep; Chary et al., in prep), allow us to measure the stellar populations, stellar masses, star formation rates, and dust extinction for galaxies in our sample (e.g., Erb et al. 2006c; Shapley et al. 2003, 2005; Reddy & Steidel 2004; Reddy et al. 2005, 2006; Steidel et al. 2004). These analyses indicate that the -selected sample consists of galaxies which span two orders of magnitude in age and stellar mass, and 4 orders of magnitude in dust obscuration (). Included are galaxies with bolometric star formation rates ranging from to . We further identify at least 3 of 11 AGN in our sample which appear to be heavily dust-obscured based on their power-law SEDs longward of m (rest-frame) and lack of detection in the deep Chandra 2 Ms data (Alexander et al., 2003). A compilation of the multi-wavelength data for these 11 AGN indicates that optical and Spitzer data are able to more efficiently (in terms of integration time) select AGN at than X-ray data, but optical spectra and Spitzer and Chandra data are all required to fully account for the census of AGN at high redshifts. The photometry and SED fitting results for galaxies in our sample are available at http://www.astro.caltech.edu/drlaw/GOODS/.
Large spectroscopic samples at high redshifts allow for a number of other detailed investigations such as the galaxy and AGN/QSO luminosity functions (Steidel et al. 1999; Adelberger & Steidel 2000; Shapley et al. 2001; Hunt et al. 2004, Reddy et al. in prep.); metallicities (Pettini et al., 1998, 2001; Shapley et al., 2004; Erb et al., 2006a); signatures of galaxy feedback and IGM metal enrichment (Adelberger et al., 2003); and accurate clustering analyses (Adelberger et al., 2005a, b). This large range in galaxy evolution studies highlights the versatility and efficiency of optically-selected samples in addressing many fundamental issues in cosmology.
References
- Adelberger et al. (2005a) Adelberger, K. L., Erb, D. K., Steidel, C. C., Reddy, N. A., Pettini, M., & Shapley, A. E. 2005a, ApJ, 620, L75
- Adelberger et al. (2005b) Adelberger, K. L., Shapley, A. E., Steidel, C. C., Pettini, M., Erb, D. K., & Reddy, N. A. 2005b, ApJ, 629, 636
- Adelberger & Steidel (2000) Adelberger, K. L. & Steidel, C. C. 2000, ApJ, 544, 218
- Adelberger et al. (2004) Adelberger, K. L., Steidel, C. C., Shapley, A. E., Hunt, M. P., Erb, D. K., Reddy, N. A., & Pettini, M. 2004, ApJ, 607, 226
- Adelberger et al. (2003) Adelberger, K. L., Steidel, C. C., Shapley, A. E., & Pettini, M. 2003, ApJ, 584, 45
- Alexander et al. (2003) Alexander, D. M. et al. 2003, AJ, 126, 539
- Alexander et al. (2005) Alexander, D. M., Bauer, F. E., Chapman, S. C., Smail, I., Blain, A. W., Brandt, W. N., & Ivison, R. J. 2005, ApJ, 632, 736
- Armus et al. (2004) Armus, L. et al. 2004, ApJS, 154, 178
- Barger et al. (2003) Barger, A. J., Cowie, L. L., Capak, P., Alexander, D. M., Bauer, F. E., Fernandez, E., Brandt, W. N., Garmire, G. P., & Hornschemeier, A. E. 2003, AJ, 126, 632
- Barger et al. (2000) Barger, A. J., Cowie, L. L., & Richards, E. A. 2000, AJ, 119, 2092
- Barger et al. (1998) Barger, A. J., Cowie, L. L., Sanders, D. B., Fulton, E., Taniguchi, Y., Sato, Y., Kawara, K., & Okuda, H. 1998, Nature, 394, 248
- Blain et al. (2004) Blain, A. W., Chapman, S. C., Smail, I., & Ivison, R. 2004, ApJ, 611, 725
- Brandt et al. (2001) Brandt, W. N., Hornschemeier, A. E., Schneider, D. P., Alexander, D. M., Bauer, F. E., Garmire, G. P., & Vignali, C. 2001, ApJ, 558, L5
- Bruzual & Charlot (2003) Bruzual, G. & Charlot, S. 2003, MNRAS, 344, 1000
- Capak et al. (2004) Capak, P. et al. 2004, AJ, 127, 180
- Chabrier (2003) Chabrier, G. 2003, PASP, 115, 763
- Chapman et al. (2003) Chapman, S. C., Blain, A. W., Ivison, R. J., & Smail, I. R. 2003, Nature, 422, 695
- Chapman et al. (2005) Chapman, S. C., Blain, A. W., Smail, I., & Ivison, R. J. 2005, ApJ, 622, 772
- Cohen (2001) Cohen, J. G. 2001, AJ, 121, 2895
- Cohen et al. (1996) Cohen, J. G., Cowie, L. L., Hogg, D. W., Songaila, A., Blandford, R., Hu, E. M., & Shopbell, P. 1996, ApJ, 471, L5+
- Cohen et al. (2000) Cohen, J. G., Hogg, D. W., Blandford, R., Cowie, L. L., Hu, E., Songaila, A., Shopbell, P., & Richberg, K. 2000, ApJ, 538, 29
- Comastri & Fiore (2004) Comastri, A. & Fiore, F. 2004, Ap&SS, 294, 63
- Cowie et al. (2004) Cowie, L. L., Barger, A. J., Hu, E. M., Capak, P., & Songaila, A. 2004, AJ, 127, 3137
- Daddi et al. (2004) Daddi, E. et al. 2004, ApJ, 600, L127
- Dawson et al. (2001) Dawson, S., Stern, D., Bunker, A. J., Spinrad, H., & Dey, A. 2001, AJ, 122, 598
- Dickinson (1998) Dickinson, M. 1998, in The Hubble Deep Field, ed. M. Livio, S. M. Fall, & P. Madau, 219–+
- Dickinson et al. (2003a) Dickinson, M., Giavalisco, M., & The Goods Team. 2003a, in The Mass of Galaxies at Low and High Redshift, 324–+
- Dickinson et al. (2003b) Dickinson, M., Papovich, C., Ferguson, H. C., & Budavári, T. 2003b, ApJ, 587, 25
- Erb et al. (2006a) Erb, D. K., Shapley, A. E., Pettini, M., Steidel, C. C., Reddy, N. A., & Adelberger, K. L. 2006a, ArXiv Astrophysics e-prints
- Erb et al. (2003) Erb, D. K., Shapley, A. E., Steidel, C. C., Pettini, M., Adelberger, K. L., Hunt, M. P., Moorwood, A. F. M., & Cuby, J.-G. 2003, ApJ, 591, 101
- Erb et al. (2006b) Erb, D. K., Steidel, C. C., Shapley, A. E., Pettini, M., Reddy, N. A., & Adelberger, K. L. 2006b, ArXiv Astrophysics e-prints
- Erb et al. (2006c) —. 2006c, ArXiv Astrophysics e-prints
- Fan et al. (2001) Fan, X. et al. 2001, AJ, 121, 54
- Forster Schreiber et al. (2006) Forster Schreiber, N. M. et al. 2006, ArXiv Astrophysics e-prints
- Franx et al. (2003) Franx, M. et al. 2003, ApJ, 587, L79
- Giavalisco et al. (2004) Giavalisco, M. et al. 2004, ApJ, 600, L93
- Gilli (2004) Gilli, R. 2004, Advances in Space Research, 34, 2470
- Hornschemeier et al. (2001) Hornschemeier, A. E. et al. 2001, ApJ, 554, 742
- Hughes et al. (1998) Hughes, D. H. et al. 1998, Nature, 394, 241
- Hunt et al. (2004) Hunt, M. P., Steidel, C. C., Adelberger, K. L., & Shapley, A. E. 2004, ApJ, 605, 625
- Labbé et al. (2005) Labbé, I. et al. 2005, astro-ph/0504219
- Lowenthal et al. (1997) Lowenthal, J. D. et al. 1997, ApJ, 481, 673
- Madau et al. (1996) Madau, P., Ferguson, H. C., Dickinson, M. E., Giavalisco, M., Steidel, C. C., & Fruchter, A. 1996, MNRAS, 283, 1388
- Nandra et al. (2002) Nandra, K., Mushotzky, R. F., Arnaud, K., Steidel, C. C., Adelberger, K. L., Gardner, J. P., Teplitz, H. I., & Windhorst, R. A. 2002, ApJ, 576, 625
- Oke et al. (1995) Oke, J. B., Cohen, J. G., Carr, M., Cromer, J., Dingizian, A., Harris, F. H., Labrecque, S., Lucinio, R., Schaal, W., Epps, H., & Miller, J. 1995, PASP, 107, 375
- Oke & Gunn (1983) Oke, J. B. & Gunn, J. E. 1983, ApJ, 266, 713
- Papovich et al. (2001) Papovich, C., Dickinson, M., & Ferguson, H. C. 2001, ApJ, 559, 620
- Papovich et al. (2006) Papovich, C. et al. 2006, ApJ, 640, 92
- Pettini et al. (1998) Pettini, M., Kellogg, M., Steidel, C. C., Dickins on, M., Adelberger, K. L., & Giavalisco, M. 1998, ApJ, 508, 539
- Pettini et al. (2001) Pettini, M., Shapley, A. E., Steidel, C. C., Cuby, J.-G., Dickinson, M., Moorwood, A. F. M., Adelberger, K. L., & Giavalisco, M. 2001, ApJ, 554, 981
- Phillips et al. (1997) Phillips, A. C., Guzman, R., Gallego, J., Koo, D. C., Lowenthal, J. D., Vogt, N. P., Faber, S. M., & Illingworth, G. D. 1997, ApJ, 489, 543
- Pope et al. (2005) Pope, A., Borys, C., Scott, D., Conselice, C., Dickinson, M., & Mobasher, B. 2005, MNRAS, 358, 149
- Reddy et al. (2005) Reddy, N. A., Erb, D. K., Steidel, C. C., Shapley, A., Adelberger, K. L., & Pettini, M. 2005, ApJ, 633, 748
- Reddy & Steidel (2004) Reddy, N. A. & Steidel, C. C. 2004, ApJ, 603, L13
- Reddy et al. (2006) Reddy, N. A., Steidel, C. C., Fadda, D., Yan, L., Pettini, M., Shapley, A. E., Erb, D. K., & Adelberger, K. L. 2006, ArXiv Astrophysics e-prints
- Richards (2000) Richards, E. A. 2000, ApJ, 533, 611
- Rudnick et al. (2006) Rudnick, G. et al. 2006, ArXiv Astrophysics e-prints
- Salpeter (1955) Salpeter, E. E. 1955, ApJ, 121, 161
- Sawicki & Yee (1998) Sawicki, M. & Yee, H. K. C. 1998, AJ, 115, 1329
- Schiminovich et al. (2003) Schiminovich, D., Arnouts, S., Milliard, B., & GALEX Science Team. 2003, American Astronomical Society Meeting Abstracts, 203,
- Schmidt et al. (1995) Schmidt, M., Schneider, D. P., & Gunn, J. E. 1995, AJ, 110, 68
- Shapley et al. (2004) Shapley, A. E., Erb, D. K., Pettini, M., Steidel, C. C., & Adelberger, K. L. 2004, ApJ, 612, 108
- Shapley et al. (2001) Shapley, A. E., Steidel, C. C., Adelberger, K. L., Dickinson, M., Giavalisco, M., & Pettini, M. 2001, ApJ, 562, 95
- Shapley et al. (2005) Shapley, A. E., Steidel, C. C., Erb, D. K., Reddy, N. A., Adelberger, K. L., Pettini, M., Barmby, P., & Huang, J. 2005, ApJ, 626, 698
- Shapley et al. (2003) Shapley, A. E., Steidel, C. C., Pettini, M., & Adelberger, K. L. 2003, ApJ, 588, 65
- Shaver et al. (1996) Shaver, P. A., Wall, J. V., Kellermann, K. I., Jackson, C. A., & Hawkins, M. R. S. 1996, Nature, 384, 439
- Smail et al. (1997) Smail, I., Ivison, R. J., & Blain, A. W. 1997, ApJ, 490, L5+
- Steidel et al. (1999) Steidel, C. C., Adelberger, K. L., Giavalisco, M., Dickinson, M., & Pettini, M. 1999, ApJ, 519, 1
- Steidel et al. (2003) Steidel, C. C., Adelberger, K. L., Shapley, A. E., Pettini, M., Dickinson, M., & Giavalisco, M. 2003, ApJ, 592, 728
- Steidel et al. (1996) Steidel, C. C., Giavalisco, M., Dickinson, M., & Adelberger, K. L. 1996, AJ, 112, 352
- Steidel & Hamilton (1993) Steidel, C. C. & Hamilton, D. 1993, AJ, 105, 2017
- Steidel et al. (2002) Steidel, C. C., Hunt, M. P., Shapley, A. E., Adelberger, K. L., Pettini, M., Dickinson, M., & Giavalisco, M. 2002, ApJ, 576, 653
- Steidel et al. (1995) Steidel, C. C., Pettini, M., & Hamilton, D. 1995, AJ, 110, 2519
- Steidel et al. (2004) Steidel, C. C., Shapley, A. E., Pettini, M., Adelberger, K. L., Erb, D. K., Reddy, N. A., & Hunt, M. P. 2004, ApJ, 604, 534
- van Dokkum et al. (2006) van Dokkum, P. G. et al. 2006, ApJ, 638, L59
- Vanzella et al. (2005) Vanzella, E. et al. 2005, A&A, 434, 53
- Wang et al. (2004) Wang, W.-H., Cowie, L. L., & Barger, A. J. 2004, ApJ, 613, 655
- Williams et al. (2000) Williams, R. E. et al. 2000, AJ, 120, 2735
- Williams et al. (1996) Williams, R. E., Blacker, B., Dickinson, M., Dixon, W. V. D., Ferguson, H. C., Fruchter, A. S., Giavalisco, M., Gilliland, R. L., Heyer, I., Katsanis, R., Levay, Z., Lucas, R. A., McElroy, D. B., Petro, L., Postman, M., Adorf, H.-M., & Hook, R. 1996, AJ, 112, 1335
- Wilson et al. (2003) Wilson, J. C. et al. 2003, in Instrument Design and Performance for Optical/Infrared Ground-based Telescopes. Edited by Iye, Masanori; Moorwood, Alan F. M. Proceedings of the SPIE, Volume 4841, pp. 451-458 (2003)., 451–458
- Wirth et al. (2004) Wirth, G. D. et al. 2004, AJ, 127, 3121
| bbSurface density of photometric candidates to . | |||||||
|---|---|---|---|---|---|---|---|
| Candidates | aaNumber of photometric candidates. | (arcmin-2) | ccNumber of objects with secure spectroscopic identifications. | ddNumber of objects with secure redshifts . | eeFraction of spectroscopically observed objects with . The foreground () contamination rates of the C, D, and MD samples are very low () and we assume the interloper fractions derived over all fields of the Lyman Break Galaxy survey (Steidel et al., 2003). For the BM and BX samples, we assume foreground contamination fractions derived from the GOODS-N field, which are similar to those derived in other fields of the survey (Steidel et al., 2004). | ffNumber of objects with | ggMean and standard deviation of redshift distribution for objects with . |
| BM | 470 | 67 | 63 | 0.94 | 49 | ||
| BX | 890 | 205 | 170 | 0.83 | 163 | ||
| C | 55 | 26 | 26 | 0.97 | 26 | ||
| D | 59 | 23 | 23 | 0.98 | 23 | ||
| MD | 78 | 26 | 25 | 0.96 | 25 | ||
| Total | 1552 | 347 | 307 | 0.88 | 286 |
| dd magnitude in AB units. | eeUpper limits given for galaxies undetected in . | ffA blank entry indicates the object did not lie in the region with near-IR imaging. | ffA blank entry indicates the object did not lie in the region with near-IR imaging. | m3.6μm | m4.5μm | m5.8μm | m8.0μm | f24μm | ||||||||
|---|---|---|---|---|---|---|---|---|---|---|---|---|---|---|---|---|
| Name | (J2000.0) | (J2000.0) | aaEmission line redshift. An entry with a colon indicates the redshift is uncertain. A blank entry indicates that an emission line redshift could not be measured. | bbAbsorption line redshift. An entry with a colon indicates the redshift is uncertain. A blank entry indicates that an absorption line redshift could not be measured. | TypeccSource type, either galaxy (“GAL”), “AGN”, “QSO”, or “STAR”. The distinction between QSO and AGN classification is based on the line widths, as described in Steidel et al. (2002), where an object is classified as a “QSO” if it has any emission line with FWHM km s-1. AGN identified using other means (X-ray or mid-infrared emission) are discussed in § 6.2. | (mag) | (mag) | (mag) | (mag) | (mag) | (mag) | (mag) | (mag) | (mag) | (Jy) | NotesggGalaxies in common with the LBG survey in the HDF-N are indicated by their names (“S03-XXX”) as given in Steidel et al. (2003). Galaxies with X-ray counterparts within are indicated by their names (“B03-XXX”) in the spectroscopic followup to the Chandra 2 Ms survey by Barger et al. (2003). Galaxies satisfying the distant red galaxy (DRG) criteria of Franx et al. (2003) are indicated by “DRG”. |
| BX1035 | 12:36:13.03 | 62:10:21.1 | … | 2.236 | GAL | 23.46 | 0.37 | 0.68 | … | … | 22.48 | 22.47 | 22.11 | 22.59 | 33.0 | |
| BX1040 | 12:36:17.81 | 62:10:11.2 | 2.469 | 2.466 | GAL | 24.84 | 0.22 | 0.68 | … | … | 22.94 | 23.27 | … | … | … | |
| BX1042 | 12:35:50.89 | 62:13:33.5 | 2.613 | 2.601 | GAL | 24.83 | 0.50 | 1.16 | … | … | 23.09 | 23.03 | 23.13 | 22.88 | 15.2 | |
| BX1050 | 12:36:18.80 | 62:10:37.4 | … | 2.322 | GAL | 24.71 | 0.40 | 0.73 | … | … | 23.49 | 23.51 | 23.46 | … | … | |
| BX1051 | 12:35:52.97 | 62:13:36.8 | … | 2.098 | GAL | 24.23 | 0.14 | 0.57 | … | … | 23.07 | … | … | … | 203.9 | |
| BX1055 | 12:35:59.59 | 62:13:07.5 | 2.496 | 2.486 | GAL | 24.09 | 0.24 | 0.81 | … | … | 23.12 | 23.23 | … | … | … | |
| BX1060 | 12:36:06.40 | 62:12:29.1 | … | 2.081 | GAL | 24.22 | 0.43 | 0.84 | … | … | 21.74 | 21.73 | 21.93 | … | 67.3 | |
| BX1064 | 12:36:30.34 | 62:09:45.3 | … | 2.086 | GAL | 24.20 | 0.28 | 0.61 | 23.60 | 22.63 | 23.00 | 23.11 | 23.16 | 23.76 | 26.0 | |
| BX1065 | 12:36:09.84 | 62:11:39.0 | … | 2.701 | GAL | 24.01 | 0.43 | 1.04 | … | … | 22.41 | 22.60 | … | … | 13.3 | |
| BX1069 | 12:36:45.82 | 62:08:08.2 | 0.000 | 0.000 | STAR | 21.95 | 0.38 | 0.77 | … | … | 23.37 | 24.01 | … | … | … | |
| BX1071 | 12:36:20.10 | 62:11:12.6 | … | 1.996 | GAL | 24.41 | 0.27 | 0.76 | 23.71 | 24.10 | 22.84 | 23.06 | … | … | … | |
| BX1073 | 12:36:43.35 | 62:08:19.6 | 0.087 | 0.087 | GAL | 20.59 | 0.40 | 0.82 | … | … | 21.71 | 22.15 | 22.66 | 22.56 | 41.2 | |
| BX1074 | 12:36:19.38 | 62:11:25.5 | 1.754 | 1.745 | GAL | 24.01 | 0.13 | 0.40 | 22.74 | 21.92 | 22.11 | 22.09 | 22.00 | … | 40.5 | |
| BX1075 | 12:36:14.45 | 62:11:52.1 | … | 2.221 | GAL | 24.08 | 0.35 | 1.04 | … | … | 22.47 | 22.49 | 22.30 | … | 10.8 | |
| BX1080 | 12:36:18.39 | 62:11:39.2 | … | 2.390 | GAL | 24.38 | 0.51 | 1.15 | … | … | 22.55 | 22.53 | 22.72 | 23.02 | 47.3 | S03-D7 |
| BX1081 | 12:36:15.19 | 62:12:07.6 | … | 1.801 | GAL | 24.23 | 0.23 | 0.60 | … | … | 22.25 | 22.33 | 22.66 | 22.79 | 48.3 | |
| BX1084 | 12:36:13.57 | 62:12:21.5 | … | 2.437 | GAL | 23.24 | 0.26 | 0.72 | … | … | 22.29 | 22.33 | 22.19 | 22.63 | 54.3 | |
| BX1085 | 12:36:13.33 | 62:12:16.3 | … | 2.236 | GAL | 24.50 | 0.33 | 0.87 | … | … | 23.38 | 23.52 | 23.47 | … | … | |
| BX1086 | 12:36:13.42 | 62:12:18.8 | 2.444 | 2.444 | GAL | 24.64 | 0.41 | 1.09 | … | … | 23.25 | 23.24 | … | … | … | z from H |
| BX1089 | 12:36:00.64 | 62:13:59.4 | … | 2.049 | GAL | 24.23 | 0.16 | 0.83 | … | … | 21.92 | 21.95 | 21.94 | 21.83 | 76.7 | |
| BX1100 | 12:36:39.65 | 62:09:48.4 | … | 2.079 | GAL | 23.20 | 0.17 | 0.61 | 22.85 | 22.11 | 22.22 | 22.26 | 22.19 | … | 84.4 | |
| BX1104 | 12:36:18.35 | 62:12:22.2 | 2.445 | 2.438 | GAL | 24.03 | 0.18 | 0.78 | … | … | 23.03 | 23.08 | 23.26 | 23.12 | 24.5 | |
| BX1106 | 12:36:27.56 | 62:11:29.8 | … | 2.917 | GAL | 24.61 | 0.65 | 1.52 | 24.05 | 23.07 | 23.16 | 22.88 | 22.93 | 8.5 | S03-oMD28 | |
| BX1112 | 12:36:15.65 | 62:13:05.3 | 0.170 | … | GAL | 24.26 | 0.21 | 0.87 | … | … | 24.18 | 24.77 | … | … | … | |
| BX1116 | 12:36:09.05 | 62:13:59.1 | … | 2.048 | GAL | 24.10 | 0.13 | 0.62 | … | … | 22.59 | 22.66 | 22.50 | 23.06 | 18.4 | |
| BX1120 | 12:36:07.62 | 62:14:16.6 | 0.169 | … | GAL | 24.64 | 0.43 | 1.31 | … | … | 24.95 | … | … | … | … | |
| BX1121 | 12:36:13.24 | 62:13:39.6 | 1.878 | 1.878 | GAL | 23.80 | 0.13 | 0.46 | … | … | 21.77 | 21.78 | 22.07 | 22.22 | 55.5 | |
| BX1125 | 12:36:25.00 | 62:12:23.6 | 2.222 | … | GAL | 25.20 | 0.18 | 0.94 | 24.00 | 24.37 | … | … | … | |||
| BX1126 | 12:36:11.91 | 62:13:58.7 | … | :1.942 | GAL | 24.59 | 0.07 | 0.32 | … | … | 23.61 | 23.74 | … | … | … | |
| BX1129 | 12:36:56.94 | 62:08:48.7 | … | 1.973 | GAL | 22.80 | 0.21 | 0.58 | … | … | 21.52 | 21.60 | 21.46 | 22.00 | 104.4 | |
| BX1130 | 12:36:33.17 | 62:11:34.1 | 0.080 | … | GAL | 20.65 | 0.30 | 0.84 | 20.50 | 20.20 | 21.05 | 20.99 | 21.15 | 21.57 | 152.8 | B03-173 |
| BX1132 | 12:36:03.91 | 62:15:08.3 | … | :2.112 | GAL | 24.41 | 0.45 | 0.98 | … | … | 22.72 | 22.64 | 22.53 | … | … | |
| BX1140 | 12:36:08.51 | 62:14:48.0 | 1.487 | … | GAL | 24.69 | 0.10 | 0.36 | … | … | 22.62 | 22.74 | 22.71 | … | 9.1 | |
| BX1145 | 12:36:10.12 | 62:14:49.2 | … | 2.325 | GAL | 25.40 | 0.17 | 0.51 | … | … | 24.13 | 24.23 | … | … | … | |
| BX1157 | 12:36:18.30 | 62:14:09.1 | 2.083 | 2.078 | GAL | 24.14 | 0.14 | 0.34 | … | … | 21.99 | 22.00 | 21.62 | 21.84 | … | |
| BX1161 | 12:36:59.39 | 62:09:21.9 | … | 1.891 | GAL | 23.71 | 0.37 | 0.59 | … | … | 21.85 | 21.87 | 22.24 | 22.47 | 23.3 | |
| BX1164 | 12:36:24.20 | 62:13:32.6 | 2.598 | 2.588 | GAL | 24.49 | 0.22 | 0.85 | 24.05 | 24.43 | … | … | … | |||
| BX1166 | 12:36:20.32 | 62:14:04.9 | 1.334 | … | GAL | 24.54 | 0.09 | 0.30 | 22.95 | 23.13 | 23.28 | 23.55 | … | … | 12.5 | |
| BX1169 | 12:36:28.27 | 62:13:15.3 | … | 1.871 | GAL | 23.82 | 0.14 | 0.43 | 23.04 | 22.30 | 22.47 | 22.45 | 22.54 | 23.14 | 40.7 | |
| BX1170 | 12:36:31.94 | 62:12:51.8 | 2.445 | 2.441 | GAL | 24.26 | 0.35 | 1.04 | 23.23 | 22.58 | 22.38 | 22.49 | 22.06 | … | 32.9 | |
| BX1172 | 12:36:54.35 | 62:10:18.3 | 2.811 | 2.802 | GAL | 24.50 | 0.55 | 1.19 | 24.05 | 24.31 | … | … | … | S03-D2 | ||
| BX1174 | 12:36:47.82 | 62:11:06.1 | 2.349 | … | GAL | 24.37 | 0.19 | 0.49 | 24.40 | 23.72 | 23.07 | 23.36 | … | … | … | |
| BX1178 | 12:36:33.52 | 62:12:51.8 | 0.000 | 0.000 | STAR | 23.23 | 0.01 | 0.42 | 23.38 | 22.64 | 24.01 | … | … | … | … | |
| BX1183 | 12:37:08.51 | 62:08:54.7 | 2.043 | :2.039 | GAL | 24.67 | 0.37 | 1.00 | … | … | 23.25 | 23.51 | … | … | … | |
| BX1185 | 12:36:12.60 | 62:15:30.0 | 2.207 | 2.203 | GAL | 24.99 | 0.47 | 0.96 | … | … | 22.54 | 22.46 | 22.41 | 22.52 | 44.1 | |
| BX1186 | 12:36:13.20 | 62:15:26.2 | … | 2.079 | GAL | 25.02 | 0.22 | 0.53 | … | … | 24.66 | 24.53 | … | … | … | |
| BX1192 | 12:36:16.83 | 62:15:14.3 | … | 1.996 | GAL | 24.22 | 0.15 | 0.86 | … | … | 21.52 | 21.56 | 21.47 | 21.67 | 111.6 | |
| BX1197 | 12:36:18.89 | 62:15:06.8 | 2.599 | 2.587 | GAL | 24.13 | 0.17 | 0.80 | 22.73 | 22.76 | … | … | 31.9 | |||
| BX1201 | 12:36:14.13 | 62:15:41.8 | … | 2.000 | GAL | 24.00 | 0.18 | 0.71 | … | … | 22.94 | 22.99 | 23.04 | … | 29.0 | |
| BX1204 | 12:36:21.73 | 62:14:52.6 | 2.209 | 2.200 | GAL | 24.27 | 0.32 | 1.13 | 23.27 | 22.38 | 22.51 | 22.62 | 22.76 | 23.21 | 15.8 | |
| BX1208 | 12:36:41.67 | 62:12:38.7 | 2.589 | … | GAL | 24.44 | 0.30 | 0.79 | 23.66 | 23.99 | 23.76 | 24.17 | … | … | … | |
| BX1209 | 12:36:37.07 | 62:13:11.8 | 0.348 | … | GAL | 24.63 | 0.30 | 0.88 | 23.07 | 23.96 | 23.93 | … | … | 13.1 | ||
| BX1214 | 12:36:44.65 | 62:12:27.2 | … | :1.879 | GAL | 23.99 | 0.23 | 0.60 | 22.67 | 22.10 | 22.05 | 21.96 | 21.97 | 22.39 | 46.9 | |
| BX1217 | 12:37:08.47 | 62:09:47.1 | … | :2.170 | GAL | 24.73 | 0.27 | 0.89 | 23.40 | 22.82 | 23.23 | 23.24 | 23.27 | 23.44 | … | |
| BX1218 | 12:36:41.69 | 62:12:58.0 | … | :2.054 | GAL | 23.88 | 0.11 | 0.35 | 23.23 | 22.50 | 22.40 | 22.40 | 22.67 | 22.97 | 26.2 | |
| BX1220 | 12:36:30.85 | 62:14:18.2 | 0.136 | 0.136 | GAL | 24.86 | 0.41 | 0.81 | 23.51 | 22.45 | 21.92 | 21.91 | 21.99 | 22.56 | … | |
| BX1222 | 12:37:02.99 | 62:10:34.1 | 2.446 | 2.438 | GAL | 24.53 | 0.26 | 0.75 | 24.14 | 24.43 | 24.41 | … | … | … | S03-MD18 | |
| BX1223 | 12:36:18.22 | 62:15:51.6 | :1.865 | … | GAL | 25.07 | 0.25 | 0.48 | 23.55 | 21.81 | 21.17 | 20.92 | 20.51 | 20.79 | 307.4 | DRG |
| BX1228 | 12:36:20.19 | 62:15:40.6 | 1.999 | 1.995 | GAL | 24.03 | 0.39 | 0.65 | 23.12 | 23.33 | 22.94 | 23.10 | 23.05 | … | 14.7 | |
| BX1229 | 12:36:33.23 | 62:14:11.0 | 1.343 | 1.343 | GAL | 23.80 | 0.12 | 0.36 | 23.06 | 22.57 | 22.42 | 22.40 | 22.31 | 22.34 | 48.4 | |
| BX1233 | 12:36:36.76 | 62:13:51.3 | 2.856 | … | GAL | 24.67 | 0.37 | 0.86 | 23.37 | 22.75 | 22.61 | 22.20 | … | … | S03-D12; DRG | |
| BX1238 | 12:36:54.39 | 62:11:55.4 | … | 2.261 | GAL | 24.57 | 0.30 | 0.65 | 24.00 | 23.33 | 22.97 | 22.91 | 23.21 | … | … | |
| BX1240 | 12:37:06.77 | 62:10:23.1 | … | 2.282 | GAL | 24.01 | 0.14 | 0.68 | 24.06 | 23.63 | 23.19 | 23.19 | … | … | … | |
| BX1243 | 12:37:06.66 | 62:10:35.2 | … | :2.037 | GAL | 23.99 | 0.27 | 0.52 | 23.21 | 22.99 | 22.68 | 22.71 | 22.67 | … | … | |
| BX1244 | 12:37:02.55 | 62:11:05.0 | … | 1.012 | GAL | 23.68 | 0.07 | 0.27 | 22.35 | 22.48 | 22.70 | … | 35.7 | |||
| BX1245 | 12:36:16.28 | 62:16:30.4 | 2.097 | 2.089 | GAL | 23.82 | -0.05 | 0.34 | … | … | 22.91 | 22.91 | … | … | 18.8 | |
| BX1250 | 12:36:32.11 | 62:14:50.9 | 1.856 | 1.853 | GAL | 24.68 | 0.04 | 0.40 | 24.06 | 23.39 | 22.86 | 22.86 | 22.95 | … | … | |
| BX1252 | 12:37:07.71 | 62:10:37.6 | … | 2.931 | GAL | 24.12 | 0.60 | 1.57 | 24.56 | 23.72 | 23.53 | … | … | … | … | |
| BX1253 | 12:36:23.62 | 62:15:55.9 | … | 1.933 | GAL | 24.51 | 0.18 | 0.38 | 22.49 | 22.53 | 23.13 | 23.18 | … | |||
| BX1260 | 12:37:13.31 | 62:10:14.9 | … | :1.714 | GAL | 24.98 | 0.50 | 1.02 | 22.97 | 21.60 | 21.51 | 21.45 | 21.34 | 21.83 | 105.7 | |
| BX1264 | 12:37:09.38 | 62:10:46.3 | 2.942 | … | GAL | 24.76 | 0.14 | 0.80 | 23.75 | … | … | … | … | … | S03-oMD24 | |
| BX1265 | 12:36:33.35 | 62:15:04.4 | 2.437 | 2.431 | GAL | 23.93 | 0.17 | 1.02 | 24.27 | 22.74 | 23.20 | 23.27 | 23.42 | 23.33 | … | S03-oMD51; DRG |
| BX1267 | 12:36:22.67 | 62:16:21.6 | 1.996 | 1.996 | GAL | 23.90 | 0.13 | 0.51 | 22.84 | 22.17 | 23.45 | … | … | … | 48.7 | |
| BX1269 | 12:37:10.37 | 62:10:49.2 | … | 2.275 | GAL | 23.53 | 0.45 | 1.00 | 22.97 | 21.96 | 21.85 | 21.78 | 21.77 | 22.15 | 89.1 | |
| BX1270 | 12:36:51.42 | 62:13:00.6 | 0.089 | 0.089 | GAL | 22.93 | 0.28 | 0.95 | 22.81 | 22.89 | 23.97 | 24.35 | … | … | … | |
| BX1274 | 12:37:11.35 | 62:10:44.2 | 2.599 | 2.594 | GAL | 24.29 | 0.25 | 0.93 | 24.02 | 23.87 | 22.80 | 23.02 | … | … | 26.6 | |
| BX1277 | 12:37:18.60 | 62:09:55.5 | … | 2.268 | GAL | 23.87 | 0.14 | 0.61 | 22.89 | 23.08 | 23.11 | 23.28 | … | … | 27.0 | |
| BX1279 | 12:36:19.45 | 62:17:01.1 | 0.995 | … | GAL | 24.79 | -0.19 | 0.19 | 23.79 | 24.15 | … | … | 40.7 | |||
| BX1281 | 12:37:03.39 | 62:11:53.5 | … | 2.410 | GAL | 25.16 | 0.32 | 0.70 | 23.89 | 23.84 | 24.11 | … | … | 13.4 | S03-D8 | |
| BX1283 | 12:37:16.29 | 62:10:23.3 | … | 2.427 | GAL | 24.59 | 0.24 | 0.60 | 23.46 | 22.72 | 22.69 | 22.69 | 23.31 | 23.18 | … | |
| BX1284 | 12:36:44.08 | 62:14:09.9 | 2.276 | 2.270 | GAL | 24.37 | 0.01 | 0.61 | 23.77 | 22.97 | 23.28 | 23.33 | 23.10 | … | … | |
| BX1287 | 12:36:20.64 | 62:16:57.9 | … | 1.675 | GAL | 23.05 | 0.05 | 0.34 | 22.17 | 22.58 | 22.60 | 22.50 | 22.68 | 23.27 | 35.1 | |
| BX1288 | 12:37:11.14 | 62:11:04.5 | 2.301 | … | GAL | 24.16 | 0.10 | 0.58 | 23.29 | 23.50 | 23.15 | 23.31 | 23.57 | … | … | |
| BX1289 | 12:36:33.67 | 62:15:32.9 | … | 2.488 | GAL | 24.15 | 0.34 | 1.16 | 23.47 | 22.64 | 22.76 | 22.77 | 22.90 | 22.91 | 18.8 | |
| BX1290 | 12:36:35.55 | 62:15:21.8 | 2.980 | … | GAL | 24.69 | 0.39 | 0.79 | 23.81 | 24.16 | … | … | … | S03-oMD54 | ||
| BX1291 | 12:37:00.11 | 62:12:25.2 | … | 2.052 | GAL | 23.56 | 0.30 | 0.80 | 23.49 | 23.17 | 23.05 | 23.15 | 23.19 | 23.71 | 22.4 | |
| BX1293 | 12:36:46.52 | 62:14:07.5 | 0.128 | … | GAL | 24.22 | 0.33 | 0.67 | 23.53 | 23.43 | 21.07 | 21.09 | 21.06 | 20.79 | 199.2 | |
| BX1296 | 12:36:20.91 | 62:17:09.5 | 1.989 | 1.988 | GAL | 24.15 | 0.26 | 0.59 | 22.82 | 21.75 | 21.19 | 20.96 | 20.67 | 21.00 | 263.7 | |
| BX1297 | 12:37:13.08 | 62:11:02.2 | … | 2.274 | GAL | 24.53 | 0.35 | 0.82 | 23.25 | 22.00 | 21.89 | 21.85 | 21.76 | 22.19 | … | |
| BX1299 | 12:36:53.24 | 62:13:22.2 | 1.654 | 1.649 | GAL | 23.49 | 0.36 | 0.61 | 23.38 | 22.32 | 22.94 | 22.96 | 23.49 | … | 18.7 | |
| BX1300 | 12:36:54.76 | 62:13:14.7 | :2.288 | :2.288 | GAL | 24.55 | 0.21 | 0.65 | 24.08 | 23.34 | 22.93 | 23.06 | … | … | … | |
| BX1303 | 12:37:11.20 | 62:11:18.7 | 2.305 | 2.304 | GAL | 24.72 | 0.11 | 0.81 | 24.24 | 22.85 | 23.55 | 23.35 | … | … | 15.1 | DRG |
| BX1305 | 12:36:50.12 | 62:14:01.0 | 2.238 | 2.231 | GAL | 24.77 | 0.14 | 0.72 | 23.35 | 23.00 | 22.80 | 22.76 | 22.68 | 22.76 | 73.1 | |
| BX1307 | 12:36:48.33 | 62:14:16.7 | … | 2.002 | GAL | 23.30 | 0.20 | 0.74 | 22.69 | 21.83 | 21.69 | 21.61 | 21.34 | 21.44 | 145.5 | |
| BX1311 | 12:36:30.54 | 62:16:26.1 | 2.490 | 2.479 | GAL | 23.29 | 0.21 | 0.81 | 22.94 | 22.30 | 22.65 | 22.74 | 22.60 | … | 24.0 | |
| BX1312 | 12:37:02.27 | 62:12:43.2 | 0.107 | 0.107 | GAL | 22.72 | 0.46 | 1.04 | 22.32 | 22.71 | 23.86 | … | … | … | 45.4 | |
| BX1313 | 12:37:04.04 | 62:12:33.8 | 2.637 | 2.632 | GAL | 24.31 | 0.42 | 0.99 | 23.68 | 23.71 | … | … | … | |||
| BX1315 | 12:36:30.10 | 62:16:35.9 | … | 1.671 | GAL | 23.77 | 0.19 | 0.41 | 22.62 | 22.06 | 21.79 | 21.75 | 21.91 | 22.05 | 64.8 | |
| BX1316 | 12:37:20.70 | 62:10:40.7 | 2.088 | … | GAL | 24.26 | 0.20 | 0.55 | 23.16 | 22.41 | 22.04 | 21.99 | 21.79 | … | … | |
| BX1317 | 12:36:25.36 | 62:17:08.0 | 1.792 | 1.787 | GAL | 23.28 | 0.16 | 0.41 | 22.44 | 21.78 | 22.26 | 22.25 | 22.32 | 22.50 | 53.9 | |
| BX1319 | 12:37:04.26 | 62:12:39.5 | 1.109 | 1.109 | GAL | 23.33 | 0.31 | 0.62 | 22.54 | 21.82 | 21.34 | 21.23 | 21.17 | 21.46 | 102.1 | |
| BX1321 | 12:36:48.31 | 62:14:26.5 | 0.139 | … | — | 19.22 | 0.32 | 0.91 | 18.72 | 18.46 | 19.37 | 19.74 | 19.73 | 17.68 | 434.8 | B03-251 |
| BX1322 | 12:37:06.54 | 62:12:24.9 | 2.449 | 2.438 | GAL | 23.72 | 0.31 | 0.57 | 24.01 | 22.77 | 23.25 | 23.28 | … | … | 31.9 | |
| BX1324 | 12:37:12.95 | 62:11:44.5 | 1.821 | 1.815 | GAL | 24.38 | 0.46 | 1.03 | 22.85 | 22.15 | 21.79 | 21.70 | 21.90 | 22.09 | 143.0 | |
| BX1326 | 12:36:35.71 | 62:16:14.9 | 2.984 | … | GAL | 24.49 | 0.40 | 0.73 | 23.90 | 23.81 | 24.17 | … | … | … | ||
| BX1327 | 12:36:57.51 | 62:13:44.2 | 2.209 | … | GAL | 24.05 | 0.21 | 0.44 | 23.13 | 22.51 | 22.92 | 23.00 | 22.98 | 23.45 | 23.3 | |
| BX1329 | 12:36:54.62 | 62:14:07.7 | … | :1.987 | GAL | 24.69 | -0.04 | 0.45 | 23.95 | 23.79 | 24.46 | … | … | … | 8.2 | |
| BX1330 | 12:36:48.91 | 62:14:50.9 | … | 2.363 | GAL | 23.73 | 0.05 | 0.61 | 23.66 | 22.72 | 22.91 | 22.95 | 22.86 | … | 24.8 | |
| BX1332 | 12:37:17.13 | 62:11:39.9 | 2.218 | 2.209 | GAL | 23.64 | 0.32 | 0.92 | 23.35 | 22.50 | 22.50 | 22.53 | 22.41 | … | 29.7 | |
| BX1334 | 12:36:46.64 | 62:15:17.0 | 3.371 | … | GAL | 25.11 | 0.46 | 1.19 | 23.22 | … | … | … | … | … | S03-M28; DRG | |
| BX1335 | 12:36:44.69 | 62:15:31.2 | … | :2.453 | AGN? | 25.15 | 0.28 | 0.94 | 23.74 | 22.84 | 22.90 | 22.89 | 22.67 | 22.88 | 19.3 | |
| BX1339 | 12:36:25.09 | 62:17:56.8 | 1.993 | 1.984 | GAL | 24.60 | -0.05 | 0.48 | … | … | 23.06 | 23.03 | 22.63 | … | … | |
| BX1343 | 12:37:08.77 | 62:12:57.8 | … | 2.268 | GAL | 23.98 | 0.17 | 0.82 | 22.88 | 22.57 | 22.45 | 22.51 | 22.45 | … | 21.0 | |
| BX1348 | 12:37:05.84 | 62:13:29.3 | 1.923 | 1.919 | GAL | 24.76 | 0.05 | 0.29 | 23.84 | 23.89 | 23.88 | … | … | … | 24.8 | |
| BX1349 | 12:36:57.27 | 62:14:29.7 | … | 1.873 | GAL | 24.29 | 0.41 | 0.74 | 22.93 | 22.18 | 21.61 | 21.45 | 21.49 | 21.68 | 104.8 | |
| BX1350 | 12:37:05.50 | 62:13:34.6 | … | :2.830 | GAL | 24.56 | 0.45 | 1.14 | … | … | … | … | … | S03-MD37 | ||
| BX1351 | 12:36:59.40 | 62:14:04.7 | 0.089 | 0.089 | GAL | 20.17 | 0.45 | 1.01 | 19.69 | 19.83 | 21.53 | 21.90 | 21.98 | 21.55 | … | |
| BX1353 | 12:36:31.15 | 62:17:39.9 | … | :2.505 | GAL | 24.28 | 0.24 | 0.61 | 22.92 | 22.03 | 21.82 | 21.75 | 21.92 | 22.14 | 65.7 | |
| BX1354 | 12:37:17.25 | 62:12:20.3 | 2.088 | 2.088 | GAL | 24.98 | -0.10 | 0.38 | 24.50 | … | … | … | … | |||
| BX1355 | 12:36:43.16 | 62:16:20.1 | … | 2.307 | GAL | 24.09 | 0.13 | 1.07 | 23.77 | 22.98 | 22.34 | 22.53 | 22.94 | … | … | |
| BX1358 | 12:36:59.46 | 62:14:27.7 | 2.943 | … | GAL | 24.83 | 0.49 | 1.45 | 23.73 | 24.11 | 24.25 | … | … | … | ||
| BX1361 | 12:36:30.47 | 62:17:53.9 | … | :1.849 | GAL | 25.48 | -0.04 | 0.22 | 23.43 | 24.22 | … | … | … | … | DRG | |
| BX1362 | 12:36:42.57 | 62:16:29.4 | … | 1.664 | GAL | 24.55 | 0.05 | 0.28 | 23.56 | 22.83 | 22.08 | 22.34 | … | … | … | |
| BX1363 | 12:37:27.40 | 62:11:12.7 | … | 2.297 | GAL | 23.82 | 0.33 | 0.76 | 22.89 | 22.15 | 22.58 | 22.59 | 22.52 | 22.76 | 58.8 | |
| BX1364 | 12:37:23.74 | 62:11:41.2 | … | 2.183 | GAL | 24.27 | 0.22 | 0.74 | 23.56 | 22.82 | 22.65 | 22.64 | 22.78 | 23.14 | 11.5 | |
| BX1368 | 12:36:48.24 | 62:15:56.2 | 2.446 | 2.440 | GAL | 23.79 | 0.30 | 0.96 | 23.34 | 22.45 | 22.35 | 22.60 | 22.43 | 22.40 | 71.0 | |
| BX1371 | 12:37:16.57 | 62:12:45.2 | 0.947 | … | GAL | 24.23 | 0.30 | 0.95 | 23.84 | 23.79 | 24.49 | 24.95 | … | … | … | |
| BX1374 | 12:36:57.90 | 62:15:07.0 | 0.116 | 0.116 | GAL | 23.80 | 0.26 | 0.88 | 23.27 | 23.41 | 24.13 | … | … | … | … | |
| BX1376 | 12:36:52.96 | 62:15:45.5 | 2.434 | 2.426 | GAL | 24.48 | 0.01 | 0.70 | 24.05 | 23.95 | 23.93 | 24.05 | … | … | … | |
| BX1378 | 12:37:02.02 | 62:14:43.4 | … | 1.971 | GAL | 23.90 | 0.33 | 0.66 | 23.14 | 22.75 | 22.42 | 22.40 | 22.43 | 23.15 | 29.4 | |
| BX1387 | 12:36:56.32 | 62:15:52.4 | … | 2.324 | GAL | 24.77 | 0.17 | 0.61 | 23.72 | 23.89 | 23.61 | 23.60 | 23.40 | … | 15.2 | |
| BX1388 | 12:36:44.84 | 62:17:15.8 | … | 2.032 | GAL | 24.55 | 0.27 | 0.99 | 22.63 | 21.77 | 21.55 | 21.43 | 21.23 | 21.54 | 151.7 | |
| BX1391 | 12:37:13.87 | 62:13:54.9 | … | 1.906 | GAL | 24.06 | 0.35 | 0.57 | 23.14 | 22.98 | 22.46 | 22.45 | 22.52 | 23.19 | … | |
| BX1392 | 12:37:25.92 | 62:12:06.4 | 0.089 | … | GAL | 21.58 | 0.37 | 0.94 | 21.27 | 21.23 | 22.48 | 22.85 | 23.35 | 23.04 | … | |
| BX1397 | 12:37:04.12 | 62:15:09.8 | … | 2.133 | GAL | 24.12 | 0.14 | 0.76 | 22.85 | 22.69 | 22.47 | 22.36 | 22.30 | 22.50 | 30.2 | |
| BX1399 | 12:37:18.30 | 62:13:32.6 | … | 2.033 | GAL | 25.22 | 0.23 | 0.73 | 23.91 | 23.49 | 22.73 | 22.84 | 22.51 | … | 20.9 | |
| BX1400 | 12:37:06.09 | 62:15:01.5 | :3.239 | … | GAL | 23.77 | 0.52 | 1.21 | 23.17 | 23.41 | 23.79 | 24.10 | … | … | … | |
| BX1401 | 12:37:02.93 | 62:15:22.5 | … | 2.481 | GAL | 23.47 | 0.41 | 0.87 | 22.38 | 21.73 | 21.76 | 21.57 | 21.35 | 21.60 | 41.2 | |
| BX1403 | 12:37:25.12 | 62:12:49.5 | … | :1.706 | GAL | 24.63 | 0.32 | 0.52 | 22.85 | 22.82 | … | … | 15.4 | |||
| BX1408 | 12:36:57.40 | 62:16:18.2 | … | 2.482 | GAL | 24.83 | 0.64 | 1.47 | 24.13 | 22.68 | 22.49 | 22.38 | 22.28 | 22.63 | 31.4 | S03-MD40; DRG |
| BX1409 | 12:36:47.41 | 62:17:28.7 | … | 2.237 | GAL | 24.66 | 0.49 | 1.17 | 23.28 | 21.89 | 22.23 | 22.22 | 22.10 | 22.34 | 52.1 | DRG |
| BX1420 | 12:36:50.87 | 62:17:12.4 | … | 2.133 | GAL | 23.79 | 0.45 | 1.01 | 22.84 | 22.34 | 22.06 | 22.13 | … | … | 18.5 | |
| BX1425 | 12:37:17.96 | 62:14:17.6 | … | 1.864 | GAL | 24.65 | 0.02 | 0.28 | 23.44 | 23.66 | 23.30 | 23.28 | 23.50 | … | … | |
| BX1427 | 12:37:33.28 | 62:12:33.8 | … | 2.548 | GAL | 24.54 | 0.39 | 0.85 | … | … | 22.98 | 22.97 | 22.82 | … | 8.3 | |
| BX1431 | 12:36:58.48 | 62:16:45.5 | 2.006 | 1.996 | GAL | 24.00 | 0.09 | 0.45 | 23.13 | 23.11 | 23.25 | … | … | … | DRG | |
| BX1434 | 12:37:16.80 | 62:14:38.8 | … | 1.994 | GAL | 24.49 | 0.26 | 0.51 | 23.62 | 23.21 | 23.14 | 23.18 | … | … | … | |
| BX1439 | 12:36:53.66 | 62:17:24.3 | 2.191 | 2.186 | GAL | 23.90 | 0.26 | 0.79 | 22.78 | 21.54 | 21.91 | 21.82 | 21.82 | 22.05 | 85.3 | |
| BX1443 | 12:36:44.87 | 62:18:37.9 | … | 1.684 | GAL | 23.33 | 0.31 | 0.57 | … | … | 20.85 | 20.67 | 20.81 | 20.93 | 194.0 | |
| BX1446 | 12:36:43.42 | 62:18:55.3 | 2.326 | 2.315 | GAL | 24.21 | 0.16 | 0.71 | … | … | 23.08 | 23.00 | … | … | … | |
| BX1451 | 12:37:13.22 | 62:15:31.7 | … | 2.245 | GAL | 24.58 | 0.40 | 0.86 | 23.54 | 22.84 | 22.37 | 22.23 | 22.36 | 22.47 | 36.0 | |
| BX1458 | 12:37:26.95 | 62:14:03.6 | … | 1.864 | GAL | 24.84 | 0.35 | 0.68 | 23.19 | 23.05 | 22.63 | 22.78 | … | … | 52.4 | |
| BX1460 | 12:36:56.80 | 62:17:25.5 | 3.137 | 3.131 | GAL | 24.70 | 0.41 | 1.30 | 24.39 | 23.68 | 23.30 | 23.72 | 23.18 | … | … | |
| BX1461 | 12:36:49.54 | 62:18:33.2 | 2.107 | 2.107 | GAL | 24.77 | 0.23 | 0.63 | … | … | 23.54 | 23.48 | … | 23.77 | … | |
| BX1476 | 12:37:19.55 | 62:15:20.8 | 1.930 | 1.927 | GAL | 25.19 | 0.15 | 0.37 | 22.46 | 23.04 | … | … | … | |||
| BX1479 | 12:37:15.42 | 62:16:03.9 | 2.383 | 2.371 | GAL | 24.39 | 0.16 | 0.79 | 23.77 | 23.12 | 23.03 | 23.08 | 22.68 | … | 10.9 | |
| BX1480 | 12:37:25.43 | 62:14:56.2 | … | 2.545 | GAL | 24.28 | 0.53 | 1.13 | 24.06 | 23.32 | 22.65 | 22.54 | 22.52 | 22.80 | 18.3 | |
| BX1485 | 12:37:28.12 | 62:14:39.9 | … | 2.548 | GAL | 23.29 | 0.35 | 0.96 | 22.96 | 22.02 | 21.36 | 21.32 | 21.19 | 21.30 | 315.9 | |
| BX1495 | 12:37:24.88 | 62:15:22.4 | 2.251 | 2.244 | GAL | 24.98 | 0.20 | 0.73 | 23.32 | 23.48 | 23.40 | … | … | … | DRG | |
| BX1501 | 12:37:41.58 | 62:13:22.2 | 1.879 | 1.875 | GAL | 23.78 | 0.16 | 0.46 | … | … | 22.19 | 22.16 | 22.28 | 22.74 | 43.3 | |
| BX1504 | 12:37:41.90 | 62:13:33.7 | 2.869 | 2.858 | GAL | 24.34 | 0.52 | 1.42 | … | … | 23.75 | 23.71 | 23.55 | … | … | |
| BX1505 | 12:36:59.12 | 62:18:35.8 | 1.012 | … | GAL | 24.49 | 0.11 | 0.34 | … | … | 22.93 | 22.94 | 22.57 | 22.00 | 256.2 | |
| BX1510 | 12:37:27.13 | 62:15:28.3 | … | :2.072 | GAL | 24.90 | 0.15 | 0.57 | 23.54 | 23.98 | 23.52 | 23.50 | … | … | … | |
| BX1514 | 12:37:14.93 | 62:16:59.8 | … | 2.135 | GAL | 24.90 | 0.29 | 0.56 | 23.48 | 22.68 | 22.51 | 22.96 | 22.80 | 22.2 | ||
| BX1525 | 12:37:24.15 | 62:16:11.6 | 1.689 | 1.689 | GAL | 24.15 | 0.28 | 0.56 | 22.44 | 21.56 | 21.59 | 21.41 | 21.55 | 21.60 | 120.4 | |
| BX1529 | 12:37:01.68 | 62:18:48.6 | 0.232 | … | GAL | 24.31 | 0.27 | 0.51 | … | … | … | … | … | … | … | |
| BX1530 | 12:37:22.85 | 62:16:27.6 | … | 2.421 | GAL | 24.40 | 0.25 | 0.84 | 24.18 | 23.19 | 23.41 | 23.33 | … | 22.83 | … | |
| BX1535 | 12:37:07.18 | 62:18:30.1 | … | 2.299 | GAL | 24.31 | 0.33 | 0.97 | … | … | 23.18 | 23.17 | 23.27 | 23.46 | … | |
| BX1542 | 12:36:55.06 | 62:20:05.2 | 1.018 | … | GAL | 24.72 | 0.11 | 0.31 | … | … | 23.34 | 23.70 | … | … | … | |
| BX1544 | 12:37:14.85 | 62:17:47.3 | … | :2.486 | GAL | 24.27 | 0.24 | 1.13 | … | … | … | … | … | … | … | |
| BX1548 | 12:37:00.49 | 62:19:30.3 | 0.223 | … | GAL | 23.79 | 0.46 | 0.89 | … | … | 23.95 | 24.71 | … | … | … | |
| BX1557 | 12:37:27.17 | 62:16:31.7 | … | 1.776 | GAL | 23.74 | 0.31 | 0.80 | 22.99 | 23.00 | 21.64 | 21.73 | 21.29 | 22.85 | 167.9 | |
| BX1559 | 12:37:29.41 | 62:15:40.1 | … | 2.408 | GAL | 24.19 | 0.07 | 0.59 | 23.84 | 23.53 | 23.10 | 23.08 | … | … | 85.8 | |
| BX1564 | 12:37:23.47 | 62:17:20.0 | … | 2.218 | GAL | 23.28 | 0.27 | 1.01 | 22.21 | 21.44 | 21.77 | 21.69 | 21.57 | 21.98 | 74.8 | |
| BX1567 | 12:37:23.17 | 62:17:23.9 | … | 2.225 | GAL | 23.50 | 0.18 | 1.05 | 22.31 | 22.00 | 21.96 | 21.86 | 21.79 | 22.03 | 34.1 | DLA |
| BX1568 | 12:36:54.06 | 62:20:48.1 | … | 1.787 | GAL | 23.46 | 0.08 | 0.44 | … | … | 22.68 | 22.63 | 22.68 | 23.30 | 25.5 | |
| BX1572 | 12:36:58.51 | 62:20:29.3 | … | 1.782 | GAL | 24.32 | 0.25 | 0.59 | … | … | 23.43 | 23.47 | 23.63 | … | … | |
| BX1574 | 12:37:25.95 | 62:17:10.1 | … | 1.808 | GAL | 24.24 | 0.22 | 0.66 | 22.66 | 22.33 | 22.00 | 21.90 | 22.08 | 22.12 | 55.3 | |
| BX1579 | 12:37:38.93 | 62:15:41.0 | 0.190 | … | GAL | 22.98 | 0.38 | 0.62 | … | … | 23.65 | 24.17 | … | … | 58.1 | |
| BX1586 | 12:37:24.91 | 62:17:40.8 | … | :1.901 | GAL | 24.44 | 0.41 | 0.82 | 23.54 | 23.10 | 23.02 | 23.02 | … | … | 22.5 | |
| BX1588 | 12:37:02.54 | 62:20:20.9 | … | 2.221 | GAL | 23.22 | 0.30 | 1.17 | 21.58 | 21.48 | 21.24 | 21.52 | 129.7 | |||
| BX1591 | 12:37:28.21 | 62:17:22.6 | 2.050 | 2.048 | GAL | 24.45 | 0.21 | 0.52 | 23.03 | 22.97 | 23.17 | 23.24 | 23.49 | … | 10.0 | |
| BX1605 | 12:37:21.51 | 62:18:30.6 | 1.977 | 1.970 | GAL | 23.89 | -0.07 | 0.19 | … | … | 23.29 | 23.36 | … | … | … | |
| BX1616 | 12:37:32.75 | 62:17:27.6 | … | 2.205 | GAL | 25.29 | 0.13 | 0.35 | … | … | 23.79 | … | … | … | … | |
| BX1617 | 12:37:04.16 | 62:20:50.8 | 2.323 | 2.317 | GAL | 25.15 | 0.15 | 0.68 | … | … | 23.96 | 23.99 | … | 23.37 | … | |
| BX1630 | 12:37:25.95 | 62:18:32.5 | 2.222 | 2.217 | GAL | 24.35 | 0.03 | 0.52 | … | … | 23.40 | 23.49 | … | 23.54 | … | |
| BX1636 | 12:37:20.03 | 62:19:23.1 | 2.306 | 2.295 | GAL | 24.08 | 0.44 | 1.16 | … | … | 21.93 | 21.82 | 21.66 | 21.82 | 71.2 | |
| BX1637 | 12:37:04.82 | 62:21:11.5 | 2.487 | … | AGN | 24.92 | -0.01 | 0.81 | … | … | 23.38 | 22.76 | 21.84 | 20.93 | 109.4 | |
| BX1641 | 12:37:08.89 | 62:20:44.7 | 1.433 | … | GAL | 24.20 | 0.01 | 0.26 | … | … | 23.79 | 23.93 | … | … | … | |
| BX1642 | 12:37:32.40 | 62:17:50.8 | 2.010 | 2.004 | GAL | 24.29 | 0.25 | 0.46 | … | … | 22.97 | 22.95 | … | … | … | |
| BX1650 | 12:37:24.11 | 62:19:04.7 | 2.100 | 2.094 | GAL | 23.24 | 0.18 | 0.74 | … | … | 22.10 | 22.05 | 21.95 | 22.42 | 37.5 | |
| BX1655 | 12:37:32.30 | 62:18:16.3 | 0.157 | … | GAL | 24.37 | 0.41 | 1.21 | … | … | 24.55 | 24.92 | … | … | … | |
| BX1669 | 12:37:48.40 | 62:16:34.8 | 0.118 | … | GAL | 23.24 | 0.35 | 0.96 | … | … | 23.22 | 23.41 | … | 23.44 | … | |
| BX1676 | 12:37:36.68 | 62:18:02.1 | 0.188 | … | GAL | 23.49 | 0.42 | 0.80 | … | … | 23.58 | 23.81 | … | … | 51.0 | |
| BX1694 | 12:37:33.82 | 62:18:46.3 | 2.009 | 2.005 | GAL | 23.66 | 0.11 | 0.53 | … | … | 22.50 | 22.58 | 22.28 | … | 13.8 | |
| BX1708 | 12:37:32.65 | 62:19:10.6 | … | 1.987 | GAL | 24.50 | 0.45 | 1.00 | … | … | 21.46 | 21.23 | 21.03 | 21.34 | 208.3 | |
| BX1782 | 12:36:57.46 | 62:08:38.0 | 0.177 | 0.177 | GAL | 22.27 | 0.43 | 0.75 | … | … | 22.64 | 23.17 | … | … | 30.3 | |
| BX1790 | 12:36:59.31 | 62:09:31.2 | … | 2.990 | GAL | 23.81 | 0.62 | 1.17 | 22.58 | 23.20 | 23.20 | 23.09 | … | … | … | |
| BX1796 | 12:36:27.51 | 62:14:18.8 | 0.089 | … | GAL | 22.70 | 0.49 | 0.70 | 22.43 | 22.15 | 22.43 | 22.93 | 22.71 | … | … | |
| BX1805 | 12:36:38.64 | 62:14:21.8 | 0.306 | 0.306 | GAL | 22.80 | 0.48 | 0.80 | 21.66 | 21.10 | 21.99 | 22.37 | 22.67 | 22.59 | 95.2 | |
| BX1808 | 12:36:59.54 | 62:12:14.2 | … | :1.943 | GAL | 24.09 | 0.43 | 0.68 | 23.33 | 23.38 | 23.01 | 23.29 | … | … | … | |
| BX1815 | 12:37:15.22 | 62:11:02.6 | 0.000 | 0.000 | STAR | 19.64 | 0.54 | 1.08 | 19.48 | 19.87 | 21.13 | 21.68 | 22.08 | 22.81 | … | |
| BX1816 | 12:36:44.13 | 62:14:50.7 | … | :2.095 | GAL | 24.25 | 0.53 | 0.87 | 23.16 | 22.00 | 21.42 | 21.26 | 21.25 | 21.62 | … | |
| BX1817 | 12:36:23.27 | 62:16:43.2 | 1.862 | 1.858 | GAL | 24.54 | 0.46 | 0.76 | 23.66 | 22.69 | 21.65 | 21.77 | 21.75 | … | 43.4 | |
| BX1820 | 12:37:19.43 | 62:11:13.8 | … | 2.457 | GAL | 24.11 | 0.65 | 1.35 | 23.07 | 22.07 | 21.64 | 21.49 | 21.27 | 21.32 | 105.6 | |
| BX1821 | 12:37:12.63 | 62:12:10.4 | … | 2.590 | GAL | 24.79 | 0.60 | 1.11 | 23.93 | 23.54 | 23.28 | 23.44 | 22.87 | … | 15.1 | |
| BX1822 | 12:37:05.74 | 62:13:03.2 | 0.109 | … | GAL | 22.05 | 0.59 | 1.14 | 22.03 | 21.91 | 22.78 | 23.24 | 23.03 | … | … | |
| BX1823 | 12:37:15.40 | 62:12:17.9 | … | 1.818 | GAL | 24.65 | 0.49 | 0.78 | 22.24 | 21.33 | 20.88 | 20.76 | 20.78 | 21.02 | 127.4 | |
| BX1826 | 12:37:17.38 | 62:12:46.8 | … | 2.929 | GAL | 24.67 | 0.52 | 1.02 | 23.99 | 23.78 | 23.49 | 23.52 | … | … | 32.0 | |
| BX1827 | 12:36:56.63 | 62:15:19.0 | 1.988 | … | GAL | 24.84 | 0.56 | 1.12 | 24.48 | 23.28 | 23.42 | 23.46 | … | … | … | |
| BX1828 | 12:37:16.22 | 62:13:24.3 | … | :2.967 | GAL | 24.09 | 0.66 | 1.40 | 23.35 | 23.45 | 24.06 | 24.75 | … | … | … | |
| BX1833 | 12:37:11.13 | 62:14:33.8 | 0.000 | 0.000 | STAR | 22.12 | 0.59 | 1.02 | 22.30 | 22.01 | 22.56 | 22.91 | … | … | … | |
| BX1841 | 12:37:02.63 | 62:16:33.9 | … | 2.373 | GAL | 24.70 | 0.47 | 1.04 | 23.46 | 23.12 | 22.57 | 22.81 | 22.80 | … | … | |
| BX1848 | 12:37:25.86 | 62:14:42.4 | 2.648 | … | GAL | 25.05 | 0.45 | 0.81 | 23.93 | 24.32 | … | … | 12.4 | |||
| BX1851 | 12:37:29.99 | 62:15:59.5 | 0.215 | … | GAL | 22.96 | 0.48 | 0.72 | 22.31 | 22.07 | 22.44 | 22.60 | … | … | … | |
| BX1856 | 12:37:22.40 | 62:17:18.0 | 0.232 | … | GAL | 23.03 | 0.51 | 0.82 | 22.51 | 22.34 | 23.49 | 23.87 | 23.82 | 23.30 | … | |
| BX1860 | 12:37:30.81 | 62:16:54.7 | … | :2.504 | GAL | 24.80 | 0.51 | 0.85 | 23.71 | 22.73 | 22.75 | 22.57 | … | 29.6 | ||
| BX28 | 12:37:17.78 | 62:09:37.8 | 0.229 | … | GAL | 23.74 | 0.61 | 0.78 | 23.54 | 23.11 | … | … | 22.71 | 22.45 | … | |
| BX82 | 12:37:05.37 | 62:10:45.3 | 1.023 | … | GAL | 24.41 | 0.58 | 0.19 | 23.29 | 22.94 | 23.30 | 23.55 | … | … | … | |
| BX84 | 12:37:13.74 | 62:10:42.0 | 2.166 | 2.161 | GAL | 24.15 | 0.22 | 0.80 | 22.08 | 21.98 | 21.88 | 22.30 | 79.0 | |||
| BX150 | 12:37:14.98 | 62:12:07.9 | 2.281 | 2.273 | GAL | 24.64 | 0.54 | 0.53 | 22.34 | 22.12 | 21.87 | … | 46.9 | |||
| BX160 | 12:37:20.07 | 62:12:23.0 | 2.462 | 2.458 | AGN | 24.02 | 0.74 | 0.92 | 22.83 | 21.87 | 21.52 | 21.32 | 20.98 | 20.95 | 142.2 | |
| BX184 | 12:37:19.28 | 62:13:00.6 | 1.998 | … | GAL | 24.22 | 0.70 | 0.99 | 23.42 | 23.46 | 22.80 | 22.95 | … | … | … | |
| BX274 | 12:36:53.60 | 62:15:25.0 | 0.000 | 0.000 | STAR | 18.57 | 0.33 | 0.96 | 18.48 | 18.96 | 20.07 | 20.58 | 21.05 | 21.76 | … | |
| BX283 | 12:37:24.35 | 62:15:58.3 | 0.129 | … | GAL | 23.41 | 0.44 | 0.84 | 24.55 | 24.75 | … | … | … | |||
| BX289 | 12:37:00.47 | 62:16:04.9 | 0.941 | … | GAL | 24.49 | 0.69 | 0.22 | 23.39 | 23.25 | 23.35 | 23.87 | … | … | 106.6 | |
| BX305 | 12:36:37.13 | 62:16:28.7 | … | 2.482 | GAL | 24.28 | 0.79 | 1.30 | 23.63 | 21.96 | 22.03 | 22.00 | 21.90 | 21.71 | 69.4 | DRG |
| BX308 | 12:37:02.66 | 62:16:34.0 | … | 2.376 | GAL | 24.87 | 0.46 | 0.95 | 22.53 | 22.75 | 22.79 | … | … | |||
| BX313 | 12:36:29.66 | 62:16:45.1 | … | 2.323 | GAL | 24.34 | 0.42 | 0.60 | 22.65 | 22.58 | 22.36 | 22.55 | 48.8 | |||
| BX341 | 12:36:22.26 | 62:17:30.9 | 2.117 | 2.117 | GAL | 23.56 | 0.71 | 0.27 | 23.77 | 22.73 | 22.47 | 22.58 | … | 22.91 | … | |
| BM1008 | 12:35:47.95 | 62:12:52.3 | 1.801 | 1.798 | GAL | 23.58 | 0.24 | 0.25 | … | … | 22.68 | 22.60 | 23.20 | 22.90 | 27.5 | |
| BM1010 | 12:36:08.08 | 62:10:44.7 | … | 1.346 | GAL | 24.03 | 0.16 | 0.18 | … | … | 22.69 | 22.88 | … | … | 37.4 | |
| BM1011 | 12:35:51.57 | 62:12:42.0 | 1.677 | 1.677 | GAL | 23.90 | 0.28 | 0.33 | … | … | 22.21 | 22.25 | 22.40 | 23.06 | 20.9 | |
| BM1017 | 12:36:11.72 | 62:10:39.3 | … | :2.371 | GAL | 24.58 | 0.17 | 0.20 | … | … | 22.99 | 22.91 | … | … | 20.6 | |
| BM1030 | 12:35:55.26 | 62:14:01.2 | 1.143 | 1.142 | GAL | 24.29 | 0.20 | 0.37 | … | … | 22.23 | 22.34 | 22.25 | … | 24.5 | |
| BM1048 | 12:36:11.63 | 62:13:18.3 | 1.381 | 1.379 | GAL | 23.50 | 0.23 | 0.23 | … | … | 22.10 | 22.22 | 22.47 | 22.65 | 21.7 | |
| BM1053 | 12:36:18.48 | 62:12:45.9 | 1.460 | 1.457 | GAL | 24.99 | 0.09 | -0.02 | … | … | 24.02 | 24.32 | … | … | 15.7 | |
| BM1061 | 12:36:15.82 | 62:13:26.0 | 2.089 | … | GAL | 25.37 | 0.02 | -0.05 | … | … | 23.77 | 23.96 | … | … | … | |
| BM1063 | 12:36:21.37 | 62:12:52.9 | … | 2.087 | GAL | 24.46 | 0.20 | 0.39 | 23.14 | 22.84 | 22.53 | 22.54 | 22.46 | … | 36.9 | |
| BM1064 | 12:36:32.06 | 62:11:40.0 | … | 1.524 | GAL | 23.57 | 0.18 | 0.28 | 22.54 | 22.55 | 22.48 | 22.57 | 23.00 | … | 25.2 | |
| BM1069 | 12:36:11.63 | 62:14:16.5 | … | 2.028 | GAL | 24.43 | 0.27 | 0.36 | … | … | 21.72 | 21.67 | 21.56 | 22.05 | 91.1 | |
| BM1072 | 12:36:04.15 | 62:15:21.0 | 1.143 | … | GAL | 23.48 | 0.10 | 0.29 | … | … | 22.36 | 22.69 | 23.32 | … | … | |
| BM1074 | 12:36:28.77 | 62:12:39.4 | 0.880 | … | GAL | 24.32 | 0.11 | 0.00 | 23.63 | 23.42 | 23.33 | 23.99 | 23.26 | … | 72.0 | |
| BM1083 | 12:36:06.67 | 62:15:50.7 | 2.414 | … | QSO | 23.34 | 0.25 | 0.26 | … | … | 21.59 | 21.34 | 20.73 | 20.47 | 112.9 | B03-77 |
| BM1092 | 12:36:13.42 | 62:15:17.7 | 1.479 | … | GAL | 24.07 | 0.12 | 0.31 | … | … | 22.84 | 22.86 | 23.03 | 23.54 | … | |
| BM1095 | 12:36:24.64 | 62:14:18.6 | 1.450 | 1.445 | GAL | 24.31 | -0.01 | 0.15 | 23.17 | 23.66 | 23.37 | 23.67 | … | … | … | |
| BM1098 | 12:36:51.16 | 62:11:28.0 | … | 1.671 | GAL | 23.76 | 0.20 | 0.37 | 22.77 | 22.47 | 22.09 | 22.01 | 22.45 | 22.63 | 30.2 | |
| BM1099 | 12:37:03.45 | 62:10:09.1 | … | :1.662 | GAL | 24.67 | 0.23 | 0.35 | 23.73 | 23.16 | 23.08 | 23.15 | … | … | 21.1 | |
| BM1119 | 12:37:03.70 | 62:11:22.6 | … | 1.717 | GAL | 23.29 | 0.28 | 0.32 | 22.30 | 21.74 | 21.60 | 21.50 | 21.32 | 21.56 | 152.6 | B03-327 |
| BM1121 | 12:36:58.38 | 62:12:13.9 | 1.020 | 1.020 | GAL | 23.11 | 0.26 | 0.22 | 22.52 | 22.15 | 22.46 | … | … | … | 21.5 | |
| BM1122 | 12:37:02.62 | 62:11:56.7 | 1.994 | 1.986 | GAL | 23.96 | 0.17 | 0.33 | 24.18 | 24.00 | 23.27 | 23.30 | … | … | … | |
| BM1132 | 12:36:53.07 | 62:13:44.3 | … | :1.901 | GAL | 23.76 | 0.26 | 0.40 | 23.13 | 22.63 | 22.98 | 23.06 | 23.08 | 23.27 | … | |
| BM1135 | 12:36:49.76 | 62:14:14.9 | … | 1.872 | GAL | 23.57 | 0.29 | 0.43 | 22.44 | 21.76 | 21.63 | 21.57 | 21.49 | 21.96 | 111.4 | |
| BM1136 | 12:36:52.75 | 62:13:54.8 | 1.355 | … | GAL | 22.15 | 0.16 | 0.23 | 21.53 | 21.36 | 21.15 | 21.11 | 21.37 | 21.16 | 99.5 | B03-272 |
| BM1139 | 12:37:22.12 | 62:10:46.6 | 1.919 | … | GAL | 24.10 | 0.25 | 0.18 | 24.37 | 23.17 | 22.46 | 22.61 | … | … | 220.8 | |
| BM1144 | 12:36:43.72 | 62:15:46.2 | … | :1.660 | GAL | 25.09 | 0.22 | 0.40 | 23.47 | 22.92 | 22.73 | 22.70 | 22.91 | … | … | |
| BM1146 | 12:37:10.65 | 62:12:56.2 | … | :1.926 | GAL | 24.30 | 0.09 | 0.06 | 23.88 | 23.29 | 23.20 | 23.55 | … | … | … | |
| BM1148 | 12:36:46.15 | 62:15:51.1 | 2.053 | 2.045 | GAL | 23.38 | 0.20 | 0.29 | 24.43 | 23.08 | 23.11 | 23.24 | … | 23.08 | 14.5 | |
| BM1149 | 12:36:34.79 | 62:17:10.1 | 1.631 | 1.629 | GAL | 24.58 | 0.02 | 0.16 | 24.15 | … | … | … | … | |||
| BM1153 | 12:36:48.46 | 62:15:59.5 | 2.450 | 2.439 | GAL | 24.64 | 0.32 | 0.47 | 23.83 | 22.85 | 21.65 | 21.43 | 21.42 | 21.54 | 123.0 | |
| BM1155 | 12:37:23.98 | 62:12:12.1 | 2.024 | 2.015 | GAL | 23.99 | 0.08 | 0.15 | 23.25 | 23.50 | 23.21 | 23.28 | … | … | … | |
| BM1156 | 12:37:04.34 | 62:14:46.3 | 2.211 | … | AGN | 24.62 | -0.01 | -0.21 | 22.94 | 22.15 | 22.10 | 21.94 | 21.18 | 19.97 | 324.4 | S03-oMD49 |
| BM1158 | 12:37:18.58 | 62:13:15.0 | … | 1.521 | GAL | 23.35 | 0.28 | 0.48 | 22.19 | 21.94 | 21.75 | 21.72 | 21.96 | 21.67 | 64.8 | |
| BM1159 | 12:37:13.32 | 62:13:56.4 | … | 1.016 | GAL | 22.87 | 0.10 | 0.08 | 22.13 | 22.03 | 21.97 | 22.41 | 22.79 | 22.62 | 22.1 | |
| BM1160 | 12:36:55.63 | 62:16:01.9 | 1.364 | … | GAL | 24.36 | 0.28 | 0.36 | 23.43 | 23.41 | 22.93 | 23.01 | 23.70 | … | 19.8 | |
| BM1161 | 12:37:08.76 | 62:14:31.5 | 2.045 | … | GAL | 24.94 | 0.15 | 0.04 | 23.68 | 23.97 | … | … | … | … | ||
| BM1163 | 12:37:26.98 | 62:12:24.5 | 1.876 | 1.872 | GAL | 24.72 | 0.23 | 0.43 | 23.80 | 23.56 | 23.18 | … | 22.74 | … | … | |
| BM1171 | 12:36:40.34 | 62:18:53.8 | … | 2.082 | GAL | 24.71 | 0.28 | 0.36 | … | … | 23.45 | 23.69 | … | … | … | |
| BM1172 | 12:37:02.84 | 62:16:20.5 | 1.866 | 1.862 | GAL | 24.23 | 0.13 | 0.15 | 23.55 | 23.49 | 23.60 | 23.53 | … | … | … | |
| BM1174 | 12:36:56.40 | 62:17:09.8 | … | :1.670 | GAL | 24.97 | 0.11 | 0.14 | 22.70 | 22.95 | 23.38 | 23.38 | … | |||
| BM1175 | 12:37:26.35 | 62:13:38.5 | 1.778 | 1.767 | GAL | 23.94 | 0.25 | 0.30 | 23.28 | 23.02 | 22.53 | 22.55 | … | … | 14.6 | |
| BM1180 | 12:37:27.22 | 62:13:52.9 | … | 1.598 | GAL | 23.55 | 0.20 | 0.28 | 22.21 | 21.84 | 22.02 | 21.95 | 21.97 | … | … | |
| BM1181 | 12:37:01.75 | 62:16:53.0 | 1.747 | 1.740 | GAL | 22.56 | 0.25 | 0.35 | 22.03 | 22.26 | 22.47 | 22.51 | 22.87 | 23.31 | 15.4 | |
| BM1190 | 12:37:06.87 | 62:17:02.1 | 1.020 | … | QSO | 19.81 | 0.15 | -0.02 | 19.37 | 19.06 | 18.63 | 18.37 | 18.10 | 17.79 | 866.4 | B03-344 |
| BM1193 | 12:37:19.33 | 62:15:59.1 | … | :1.564 | GAL | 24.36 | 0.20 | 0.17 | 22.93 | 23.30 | … | … | … | … | … | |
| BM1195 | 12:37:35.59 | 62:14:05.9 | … | 1.289 | GAL | 23.97 | 0.28 | 0.37 | … | … | 21.84 | 21.82 | 21.99 | … | 50.4 | |
| BM1196 | 12:37:18.75 | 62:16:15.0 | 1.863 | … | — | 24.62 | -0.07 | 0.00 | 24.12 | 24.22 | … | … | … | |||
| BM1197 | 12:37:19.39 | 62:16:21.0 | … | 1.566 | GAL | 23.76 | 0.20 | 0.34 | 22.61 | 22.38 | 22.32 | 22.28 | 22.77 | 22.90 | 18.8 | |
| BM1198 | 12:37:24.06 | 62:16:05.8 | … | 1.780 | GAL | 23.65 | 0.24 | 0.43 | 23.21 | 22.73 | 22.38 | 22.34 | 22.41 | 23.05 | 39.5 | |
| BM1200 | 12:37:30.85 | 62:15:29.6 | … | 2.078 | GAL | 23.79 | 0.26 | 0.41 | 23.86 | 22.45 | 22.85 | 22.89 | 22.99 | … | 16.7 | DRG |
| BM1201 | 12:37:21.09 | 62:16:41.9 | 1.001 | … | GAL | 24.24 | 0.09 | 0.00 | 23.12 | 23.26 | 23.54 | 24.00 | … | … | … | |
| BM1204 | 12:37:18.29 | 62:17:09.1 | … | 1.489 | GAL | 23.64 | 0.08 | 0.19 | 22.79 | 22.65 | 22.53 | 22.60 | 22.96 | … | 22.4 | |
| BM1205 | 12:37:42.45 | 62:14:19.5 | 1.711 | 1.711 | GAL | 24.44 | 0.11 | -0.05 | … | … | 22.70 | 22.54 | 22.58 | 22.58 | 9.4 | |
| BM1207 | 12:37:16.19 | 62:17:30.3 | 1.083 | … | GAL | 23.95 | 0.23 | 0.26 | 23.19 | 23.18 | 22.47 | 23.63 | … | … | 171.3 | |
| BM1209 | 12:37:30.87 | 62:15:55.1 | … | 1.775 | GAL | 23.44 | 0.29 | 0.40 | 22.46 | 22.28 | 22.49 | 22.34 | … | 15.5 | DRG | |
| BM1211 | 12:37:43.19 | 62:14:49.6 | 0.960 | … | GAL | 24.47 | 0.21 | 0.15 | … | … | 23.53 | 23.84 | … | … | … | |
| BM1212 | 12:37:24.28 | 62:17:20.8 | … | :1.379 | GAL | 23.65 | 0.10 | 0.26 | 22.83 | 23.36 | 22.77 | 22.74 | … | … | 18.4 | |
| BM1226 | 12:37:11.63 | 62:19:58.2 | 1.355 | … | GAL | 24.32 | 0.28 | 0.39 | … | … | 23.12 | 23.15 | … | … | … | |
| BM1289 | 12:37:00.02 | 62:07:46.2 | 2.380 | … | GAL | 24.34 | 0.45 | 0.59 | … | … | 24.13 | 24.38 | … | … | 20.2 | |
| BM1293 | 12:36:58.59 | 62:08:28.2 | :2.300 | … | GAL | 24.91 | 0.50 | 0.66 | … | … | 22.51 | 23.01 | … | … | 18.3 | |
| BM1299 | 12:37:01.33 | 62:08:44.6 | … | 1.595 | GAL | 23.31 | 0.44 | 0.51 | … | … | 20.91 | 21.04 | 21.10 | 21.27 | … | |
| BM1303 | 12:36:39.51 | 62:11:40.4 | … | 1.721 | GAL | 24.75 | 0.46 | 0.45 | 23.56 | 22.43 | 22.23 | 22.03 | 22.06 | 22.35 | 134.7 | |
| BM1324 | 12:36:16.00 | 62:15:58.2 | 0.322 | 0.322 | GAL | 22.80 | 0.36 | 0.52 | … | … | 22.45 | 22.66 | 22.50 | … | 12.7 | |
| BM1326 | 12:36:53.46 | 62:11:40.0 | … | 1.268 | GAL | 22.31 | 0.28 | 0.19 | 21.46 | 20.47 | 20.38 | 20.29 | 20.48 | 20.02 | 303.2 | B03-277 |
| BM1334 | 12:37:12.15 | 62:10:29.6 | … | 1.893 | GAL | 23.74 | 0.43 | 0.58 | 22.47 | 21.96 | 21.97 | 21.89 | 22.10 | 22.36 | 15.3 | |
| BM1335 | 12:37:07.82 | 62:10:57.6 | … | 1.489 | GAL | 23.16 | 0.51 | 0.55 | 22.02 | 21.47 | 21.15 | 21.05 | 21.19 | … | … | |
| BM1339 | 12:37:09.12 | 62:11:28.5 | … | 1.338 | GAL | 23.17 | 0.36 | 0.31 | 22.40 | 22.00 | 21.93 | 22.01 | 22.37 | 22.56 | 38.0 | |
| BM1345 | 12:37:17.39 | 62:10:46.7 | 0.202 | … | GAL | 22.54 | 0.37 | 0.53 | 21.57 | 20.87 | 21.72 | 21.96 | 21.89 | 22.15 | … | |
| BM1358 | 12:37:01.24 | 62:15:20.5 | … | 1.807 | GAL | 24.07 | 0.46 | 0.64 | 22.33 | 21.17 | 21.11 | 20.97 | 20.91 | 21.22 | 202.8 | |
| BM1362 | 12:37:07.09 | 62:14:56.0 | … | :1.711 | GAL | 23.24 | 0.48 | 0.64 | 22.32 | 21.87 | 22.10 | 22.07 | 22.21 | 22.74 | 33.9 | |
| BM1369 | 12:37:07.79 | 62:15:25.0 | … | 1.879 | GAL | 24.56 | 0.43 | 0.61 | 23.21 | 23.59 | 23.83 | … | … | 167.9 | DRG | |
| BM1375 | 12:36:58.58 | 62:17:15.3 | 2.113 | 2.106 | GAL | 23.91 | 0.30 | 0.31 | 22.92 | 22.75 | 21.88 | 22.09 | 22.29 | 22.23 | … | |
| BM1376 | 12:37:13.85 | 62:15:38.3 | … | :1.278 | GAL | 23.35 | 0.46 | 0.40 | 22.30 | 22.12 | 23.69 | … | … | … | … | |
| BM1384 | 12:37:23.15 | 62:15:38.0 | 2.243 | … | AGN | 23.98 | 0.49 | 0.45 | 22.79 | 21.69 | 21.91 | 21.63 | 21.27 | 20.75 | 63.8 | B03-409 |
| BM1396 | 12:37:38.38 | 62:15:09.0 | 1.743 | 1.743 | GAL | 23.66 | 0.45 | 0.52 | … | … | 21.48 | 21.39 | 21.54 | 21.81 | 69.2 | |
| BM1413 | 12:37:41.39 | 62:16:45.9 | … | :1.391 | GAL | 22.93 | 0.42 | 0.35 | … | … | 22.39 | 22.73 | 22.62 | … | … | |
| BM35 | 12:37:00.80 | 62:11:34.0 | … | 1.875 | GAL | 23.49 | 0.43 | 0.17 | 22.70 | 22.68 | 22.66 | 22.96 | … | … | … | |
| BM63 | 12:37:13.75 | 62:14:09.0 | :1.912 | … | GAL | 24.48 | 0.30 | 0.21 | 23.87 | 23.55 | 23.56 | … | … | … | ||
| BM69 | 12:37:17.68 | 62:14:35.9 | :1.991 | :1.991 | GAL | 25.12 | 0.31 | 0.27 | … | … | … | … | 32.7 | |||
| BM70 | 12:37:20.05 | 62:14:57.1 | 1.997 | 1.994 | GAL | 24.05 | 0.37 | 0.15 | 23.11 | 23.33 | 23.24 | 23.69 | … | … | … | |
| BM72 | 12:37:22.00 | 62:15:03.3 | … | 1.571 | GAL | 24.72 | 0.34 | 0.18 | 23.27 | 23.33 | 22.24 | … | … | … | … | |
| C2 | 12:35:59.42 | 62:11:19.9 | … | 2.991 | GAL | 25.24 | 0.80 | … | … | 23.35 | 23.39 | … | … | … | ||
| C11 | 12:36:47.88 | 62:10:31.9 | … | 2.990 | GAL | 24.59 | 0.86 | 23.46 | 23.72 | 23.86 | 23.25 | … | … | S03-M7; DRG | ||
| C12 | 12:36:51.54 | 62:10:41.7 | … | 2.975 | GAL | 24.41 | 1.14 | 24.2 | 23.18 | 22.63 | 22.54 | … | … | 23.8 | S03-M9 | |
| C14 | 12:36:54.95 | 62:11:43.8 | … | 2.973 | GAL | 25.30 | 1.07 | 23.79 | 23.19 | 23.16 | … | … | … | |||
| C16 | 12:36:44.07 | 62:13:11.0 | … | 2.929 | GAL | 23.99 | 1.14 | 23.26 | 22.25 | 22.04 | 21.93 | 21.68 | 21.47 | 88.8 | S03-M18 | |
| C17 | 12:37:09.73 | 62:10:16.6 | … | 3.384 | GAL | 24.75 | 1.16 | … | … | … | … | … | ||||
| C18 | 12:36:23.89 | 62:15:48.8 | 3.230 | … | GAL | 25.15 | 0.56 | 23.96 | 23.36 | 23.83 | 23.92 | … | … | … | ||
| C20 | 12:36:24.29 | 62:15:51.7 | 2.981 | … | GAL | 25.28 | 0.93 | … | … | … | … | … | ||||
| C29 | 12:36:48.86 | 62:15:02.6 | 3.115 | 3.105 | GAL | 24.72 | 0.73 | 23.13 | 23.25 | 23.36 | 23.61 | 23.25 | 43.9 | S03-oC38; DRG | ||
| C30 | 12:36:51.87 | 62:15:15.4 | 3.334 | 3.321 | GAL | 24.32 | 0.79 | 23.56 | 23.80 | 23.81 | … | … | … | S03-C24; DRG | ||
| C33 | 12:36:49.01 | 62:15:42.5 | 3.136 | 3.125 | GAL | 23.77 | 0.45 | 23.68 | 23.65 | 23.20 | 23.28 | 23.22 | … | 19.0 | S03-D15 | |
| C35 | 12:36:43.09 | 62:16:36.0 | … | 3.363 | GAL | 24.71 | 0.91 | 23.53 | 23.09 | 23.06 | … | … | 32.8 | S03-M32; DRG | ||
| C40 | 12:37:06.19 | 62:15:10.1 | 3.246 | 3.239 | GAL | 24.53 | 0.85 | 23.95 | 23.28 | 23.68 | 23.69 | … | … | … | S03-M27 | |
| C41 | 12:37:21.63 | 62:13:50.4 | 3.148 | … | GAL | 25.14 | 0.29 | 23.87 | 23.08 | … | … | … | … | S03-C18 | ||
| C42 | 12:36:51.29 | 62:18:15.0 | … | 3.411 | GAL | 24.46 | 1.06 | … | … | 23.56 | 23.39 | … | … | … | ||
| C48 | 12:36:51.81 | 62:19:06.0 | … | 3.206 | GAL | 24.89 | 0.99 | … | … | 23.73 | 23.87 | … | … | … | ||
| C53 | 12:37:23.38 | 62:16:23.9 | 3.103 | … | GAL | 25.04 | 0.94 | 24.07 | 23.98 | … | … | 13.8 | ||||
| C54 | 12:37:05.98 | 62:19:04.0 | 3.217 | … | GAL | 25.34 | 0.41 | … | … | 24.44 | 24.61 | … | … | … | ||
| S03-C5 | 12:36:23.88 | 62:09:43.0 | … | :2.664 | GAL | 24.65 | 0.71 | 0.89 | 24.10 | 23.54 | 23.11 | 23.40 | … | … | 29.9 | S03-C5 |
| S03-C7 | 12:36:37.64 | 62:10:47.4 | … | 2.658 | GAL | 24.36 | 0.95 | 1.23 | 24.41 | 23.09 | 24.25 | 24.56 | … | … | 20.3 | S03-C7 |
| S03-C8 | 12:36:26.95 | 62:11:27.0 | 2.993 | 2.983 | GAL | 24.38 | 0.85 | 1.81 | 23.59 | 23.96 | 23.41 | 23.49 | … | … | 13.3 | S03-C8 |
| S03-C17 | 12:36:51.17 | 62:13:48.9 | 3.163 | … | GAL | 24.84 | 0.60 | 0.92 | 23.91 | 23.72 | … | … | … | 28.4 | S03-C17 | |
| S03-C26 | 12:37:03.26 | 62:16:35.0 | … | 3.239 | GAL | 23.95 | 1.31 | 2.85 | 23.58 | 22.66 | 20.86 | 21.30 | 21.50 | 21.61 | 43.2 | S03-C26 |
| S03-oC14 | 12:36:50.36 | 62:10:55.3 | 2.928 | … | GAL | 25.61 | 0.36 | 1.21 | … | … | … | … | … | … | 53.3 | S03-oC14 |
| S03-oC26 | 12:36:34.83 | 62:12:53.6 | 3.182 | … | GAL | 25.63 | 0.40 | 1.66 | … | … | … | … | … | … | … | S03-oC26 |
| S03-oC29 | 12:36:45.35 | 62:13:46.7 | 3.161 | … | GAL | 25.49 | 0.64 | 1.59 | … | … | … | … | … | … | … | S03-oC29 |
| S03-oC34 | 12:36:33.49 | 62:14:17.9 | 3.413 | … | QSO | 25.32 | 1.05 | 1.58 | 24.21 | 22.92 | 22.65 | 22.42 | 22.21 | 21.91 | 19.3 | S03-oC34; B03-176 |
| D8 | 12:35:59.84 | 62:12:08.7 | 3.300 | … | GAL | 25.10 | 0.93 | 2.80 | … | … | … | … | … | … | … | |
| D14 | 12:36:45.02 | 62:09:40.6 | 2.983 | 2.975 | GAL | 24.97 | 0.37 | 1.92 | 24.69 | 23.97 | … | … | … | … | … | S03-MD10 |
| D16 | 12:36:17.49 | 62:13:10.1 | 2.930 | … | GAL | 25.06 | -0.01 | 1.76 | … | … | 24.42 | 24.79 | … | … | 9.7 | S03-D11 |
| D19 | 12:36:41.84 | 62:11:07.1 | 3.199 | 3.187 | GAL | 24.45 | 0.68 | 3.23 | 24.03 | 23.33 | 24.07 | 23.94 | … | … | … | S03-MD22 |
| D20 | 12:36:49.46 | 62:10:18.5 | 3.247 | … | GAL | 25.26 | 0.76 | 2.74 | 24.45 | 23.22 | 24.43 | 24.71 | … | … | 13.0 | |
| D23 | 12:36:19.37 | 62:15:01.9 | 3.128 | 3.123 | GAL | 23.78 | 0.62 | 2.45 | 23.47 | 22.96 | … | … | … | … | … | S03-C22 |
| D25 | 12:36:46.94 | 62:12:26.2 | 2.970 | … | GAL | 24.25 | 0.14 | 1.94 | 24.86 | 25.13 | … | … | … | S03-D10 | ||
| D26 | 12:36:14.69 | 62:16:22.9 | 2.975 | … | GAL | 25.48 | 0.29 | 1.79 | … | … | 24.07 | 23.97 | … | … | 18.5 | |
| D28 | 12:36:47.79 | 62:12:55.7 | … | 2.932 | GAL | 24.02 | 0.95 | 2.55 | 23.38 | 22.35 | 22.36 | 22.30 | 22.16 | 22.06 | 40.1 | S03-M17 |
| D29 | 12:37:16.91 | 62:10:02.1 | 3.451 | … | GAL | 24.09 | 0.82 | 3.37 | 24.06 | 23.66 | 24.04 | … | … | … | 75.0 | S03-C6 |
| D32 | 12:36:42.39 | 62:14:49.0 | 2.962 | … | GAL | 24.87 | 0.18 | 2.38 | 24.11 | 24.17 | … | … | 13.0 | S03-D14 | ||
| D34 | 12:36:37.14 | 62:15:48.0 | 2.975 | 2.970 | GAL | 25.46 | 0.62 | 2.22 | 24.21 | 23.42 | 23.65 | 23.62 | … | … | S03-C25 | |
| D35 | 12:36:53.62 | 62:14:10.3 | 3.196 | … | GAL | 24.88 | 1.00 | 2.76 | 24.04 | 23.50 | 23.72 | 23.82 | … | … | 8.9 | S03-M22 |
| D38 | 12:36:39.27 | 62:17:13.1 | 2.944 | 2.936 | GAL | 24.48 | 0.71 | 2.35 | 23.92 | 23.32 | 23.07 | 23.01 | 22.72 | 22.69 | … | S03-C27 |
| D39 | 12:37:00.54 | 62:14:41.9 | … | 2.987 | GAL | 24.82 | 0.61 | 2.14 | 24.60 | 24.36 | … | … | … | … | ||
| D41 | 12:36:43.42 | 62:17:51.8 | 3.228 | … | GAL | 24.77 | 0.84 | 3.20 | 24.19 | 23.46 | 23.86 | 23.84 | … | 23.92 | … | |
| D45 | 12:36:58.98 | 62:17:14.2 | 3.134 | 3.127 | GAL | 23.58 | 1.05 | 3.09 | 21.86 | 20.92 | 20.93 | 21.22 | 21.43 | 21.44 | … | S03-C28 |
| D47 | 12:37:24.37 | 62:14:31.9 | 3.193 | 3.188 | GAL | 25.16 | 0.44 | 3.23 | 24.35 | 24.21 | … | … | … | |||
| D55 | 12:36:55.29 | 62:19:47.9 | 3.251 | 3.239 | GAL | 23.92 | 1.14 | 2.86 | … | … | 23.27 | 23.22 | 23.35 | 23.04 | … | |
| S03-D3 | 12:36:47.70 | 62:10:53.2 | … | 2.943 | GAL | 24.18 | 0.81 | 1.47 | 23.68 | 23.60 | … | … | … | … | … | S03-D3 |
| S03-D6 | 12:37:12.27 | 62:11:37.8 | 2.925 | … | GAL | 25.40 | 0.14 | 2.00 | … | … | … | … | … | … | 35.7 | S03-D6 |
| S03-oD3 | 12:36:48.31 | 62:09:51.7 | 2.729 | 2.720 | GAL | 24.52 | 0.68 | 0.62 | 24.13 | 23.86 | … | … | … | 15.4 | S03-oD3 | |
| S03-oD12 | 12:36:20.51 | 62:14:17.8 | 2.418 | … | GAL | 24.59 | 0.58 | 0.74 | 24.18 | 23.67 | 23.16 | 23.10 | … | … | 96.5 | S03-oD12 |
| MD4 | 12:35:56.54 | 62:11:26.1 | 2.867 | … | GAL | 25.22 | 0.38 | 1.55 | … | … | 23.97 | … | … | … | … | |
| MD6 | 12:36:02.68 | 62:10:59.8 | 3.246 | 3.241 | GAL | 24.38 | 0.87 | 2.00 | … | … | 22.70 | 22.57 | … | 22.68 | 114.6 | |
| MD13 | 12:35:59.63 | 62:12:00.6 | … | 2.974 | GAL | 24.01 | 0.91 | 2.31 | … | … | 22.37 | 22.57 | … | … | … | |
| MD27 | 12:36:42.96 | 62:09:58.1 | 3.661 | … | GAL | 25.48 | 1.00 | 2.46 | 22.86 | 21.04 | 20.59 | 20.50 | 20.33 | 20.76 | 21.0 | DRG |
| MD31 | 12:36:22.58 | 62:13:06.5 | 2.981 | … | GAL | 24.92 | 0.53 | 1.69 | 24.57 | 23.13 | 22.03 | 21.95 | 21.70 | 21.83 | 13.4 | S03-C14; B03-133; DRG |
| MD33 | 12:36:25.56 | 62:13:50.5 | … | 2.932 | GAL | 24.40 | 0.68 | 1.88 | 23.42 | 23.38 | 22.94 | 23.03 | 22.94 | 23.42 | … | |
| MD34 | 12:36:41.25 | 62:12:03.1 | 3.222 | 3.214 | GAL | 24.26 | 0.91 | 2.39 | 24.17 | 22.78 | 23.79 | 23.78 | 23.97 | … | 97.3 | S03-C11; DRG |
| MD39 | 12:36:22.94 | 62:15:26.7 | 2.583 | … | QSO | 20.48 | -0.23 | 0.78 | 20.19 | 20.07 | 20.04 | 19.98 | 19.45 | 18.82 | 487.9 | B03-137 |
| MD43 | 12:36:40.87 | 62:13:58.5 | … | 3.087 | GAL | 24.04 | 0.66 | 2.02 | 23.01 | 22.42 | 22.25 | 22.48 | 22.55 | 22.95 | 38.6 | S03-D13 |
| MD48 | 12:37:06.64 | 62:14:00.2 | … | 2.926 | GAL | 24.89 | 0.69 | 1.79 | 24.01 | 23.36 | 22.74 | 22.62 | 22.67 | 22.46 | 34.5 | S03-M21 |
| MD49 | 12:37:25.45 | 62:12:00.9 | … | 2.850 | GAL | 23.95 | 0.62 | 1.75 | 24.01 | 22.96 | 23.13 | 23.15 | 23.13 | 23.05 | 15.6 | |
| MD50 | 12:36:51.43 | 62:16:08.3 | 3.238 | 3.234 | GAL | 24.77 | 0.99 | 2.04 | 24.09 | 24.04 | … | … | … | |||
| MD54 | 12:37:32.35 | 62:13:11.2 | 2.939 | … | GAL | 25.10 | 0.54 | 1.99 | … | … | 23.15 | 23.03 | … | … | … | |
| MD55 | 12:37:16.11 | 62:15:26.5 | … | 2.956 | GAL | 24.86 | 0.69 | 2.13 | 23.54 | 23.52 | … | … | 12.8 | |||
| MD74 | 12:37:01.27 | 62:21:32.6 | 2.635 | … | GAL | 24.45 | 0.45 | 1.58 | … | … | 21.99 | 21.73 | 21.34 | 20.78 | 123.4 | |
| MD75 | 12:37:37.09 | 62:17:04.6 | … | 2.790 | GAL | 24.03 | 1.08 | 2.30 | … | … | 22.19 | 22.63 | 22.70 | 22.73 | 25.4 | |
| MD78 | 12:37:07.72 | 62:21:00.3 | 2.812 | … | GAL | 24.83 | 0.27 | 1.51 | … | … | … | … | … | … | … | |
| MD79 | 12:37:10.91 | 62:20:44.7 | … | :2.291 | GAL | 24.44 | 0.35 | 1.58 | … | … | 22.92 | 22.82 | 22.62 | 23.01 | 23.2 | |
| MD83 | 12:37:21.57 | 62:20:11.0 | … | 3.213 | GAL | 24.35 | 0.62 | 1.77 | … | … | 23.95 | 24.26 | … | … | 9.7 | |
| S03-MD3 | 12:36:33.05 | 62:09:03.3 | 2.898 | … | GAL | 23.94 | 0.87 | 1.48 | … | … | 20.65 | 21.13 | 21.46 | 22.00 | 22.4 | S03-MD3 |
| S03-MD12 | 12:37:19.86 | 62:09:54.9 | 2.647 | … | AGN | 24.36 | 0.72 | 0.92 | 23.41 | 22.11 | 21.59 | 21.20 | 20.48 | 19.85 | 139.7 | S03-MD12; B03-398 |
| S03-MD45 | 12:37:14.18 | 62:16:28.6 | :2.345 | … | GAL | 23.63 | 0.57 | 0.82 | 22.00 | 21.50 | 21.07 | 20.91 | 20.97 | 21.23 | 178.1 | S03-MD45 |
| S03-oMD19 | 12:36:37.00 | 62:10:43.8 | … | 3.241 | GAL | 24.04 | 0.68 | 1.48 | 23.75 | 22.72 | 23.31 | 23.25 | 23.23 | 22.90 | 18.5 | S03-oMD19 |
| S03-oMD56 | 12:36:38.40 | 62:15:39.5 | 0.000 | 0.000 | STAR | 23.24 | 0.82 | 1.45 | 23.40 | 23.75 | 23.73 | 24.13 | 23.79 | … | … | S03-oMD56 |
| S03-M16 | 12:37:17.38 | 62:12:46.8 | … | 2.939 | GAL | 24.67 | 0.52 | 1.02 | 23.99 | 23.78 | 23.49 | 23.52 | … | … | 32.0 | S03-M16 |
| S03-M23 | 12:37:02.68 | 62:14:25.9 | … | 3.214 | GAL | 24.61 | 1.09 | 2.43 | … | … | 20.83 | 20.88 | 21.04 | 21.08 | … | S03-M23 |
| S03-M25 | 12:36:50.80 | 62:14:44.5 | … | 3.106 | GAL | 24.70 | 0.82 | 1.69 | 23.85 | 24.32 | … | … | … | … | S03-M25 | |
| S03-M35 | 12:36:45.18 | 62:16:52.1 | … | 3.229 | GAL | 24.05 | 1.24 | 3.12 | 23.34 | 22.57 | 22.76 | 22.65 | 22.35 | 22.47 | 23.5 | S03-M35 |
| Age∞ | SFR∞ | M | bbBest-fit star formation history decay timescale in Myr. In some cases, a model with constant star formation () provided the best-fit. | Ageτ | SFRτ | M | |||||
|---|---|---|---|---|---|---|---|---|---|---|---|
| NameaaWe did not fit the stellar populations of galaxies that had no data longward of -band, had uncertain redshifts, or are identified as AGN/QSO from their optical spectra. We also do not present SED parameters for those galaxies with optical and IRAC photometry inconsistent with a simple stellar population (these sources had large or those sources with m or m excesses. | (Myr) | () | ( M⊙) | (Myr) | (Myr) | () | ( M⊙) | Notes ccObjects with large -band residuals are indicated (i.e., those sources whose -band measurement lies more than away from the best-fit stellar population). MD31 is the only directly-detected X-ray source which shows no optical signatures of an AGN, has a relatively faint m flux, and has photometry that is consistent with a stellar population. The IRAC photometry for BX1267 may suffer from a deblending problem and these (IRAC) data were not used in the SED fit. | |||
| BX1035 | 2.236 | 0.24 | 20 | 234 | 0.466 | 20 | 0.24 | 15 | 185 | 0.419 | |
| BX1040 | 2.468 | 0.09 | 2100 | 14 | 3.030 | 200 | 0.03 | 571 | 7 | 2.220 | |
| BX1042 | 2.607 | 0.18 | 509 | 36 | 1.820 | 200 | 0.15 | 321 | 23 | 1.810 | |
| BX1050 | 2.322 | 0.27 | 15 | 118 | 0.179 | 50 | 0.26 | 15 | 98 | 0.173 | |
| BX1051 | 2.098 | 0.12 | 404 | 24 | 0.963 | 100 | 0.02 | 286 | 7 | 1.100 | |
| BX1055 | 2.491 | 0.12 | 255 | 37 | 0.956 | 100 | 0.04 | 227 | 14 | 1.210 | |
| BX1060 | 2.081 | 0.24 | 806 | 64 | 5.150 | 100 | 0.01 | 509 | 4 | 5.810 | |
| BX1064 | 2.086 | 0.14 | 509 | 22 | 1.100 | 100 | 0.02 | 321 | 5 | 1.230 | |
| BX1065 | 2.701 | 0.08 | 1434 | 35 | 5.040 | 100 | 0.00 | 360 | 10 | 3.570 | |
| BX1071 | 1.996 | 0.21 | 161 | 43 | 0.690 | 10 | 0.14 | 55 | 2 | 0.600 | |
| BX1074 | 1.750 | 0.20 | 1139 | 26 | 2.970 | 100 | 0.09 | 360 | 7 | 2.490 | |
| BX1075 | 2.221 | 0.25 | 128 | 91 | 1.160 | 50 | 0.09 | 203 | 8 | 2.270 | |
| BX1080 | 2.390 | 0.25 | 203 | 78 | 1.590 | 50 | 0.11 | 203 | 9 | 2.430 | |
| BX1081 | 1.801 | 0.24 | 286 | 46 | 1.310 | 50 | 0.06 | 255 | 2 | 2.030 | |
| BX1084 | 2.437 | 0.12 | 227 | 82 | 1.860 | 100 | 0.05 | 227 | 29 | 2.570 | |
| BX1085 | 2.236 | 0.30 | 10 | 201 | 0.201 | 20 | 0.08 | 90 | 3 | 0.602 | |
| BX1086 | 2.444 | 0.28 | 20 | 139 | 0.277 | 50 | 0.06 | 203 | 4 | 1.250 | |
| BX1089 | 2.049 | 0.17 | 1609 | 33 | 5.360 | 100 | 0.06 | 404 | 7 | 4.160 | |
| BX1100 | 2.079 | 0.14 | 255 | 68 | 1.720 | 50 | 0.10 | 114 | 34 | 1.510 | |
| BX1104 | 2.441 | 0.11 | 286 | 37 | 1.050 | 100 | 0.05 | 227 | 15 | 1.280 | |
| BX1106 | 2.917 | 0.10 | 905 | 29 | 2.670 | 100 | 0.01 | 321 | 9 | 2.160 | |
| BX1116 | 2.048 | 0.13 | 571 | 29 | 1.650 | 100 | 0.00 | 360 | 5 | 1.900 | |
| BX1121 | 1.878 | 0.17 | 806 | 45 | 3.640 | 100 | 0.02 | 404 | 7 | 3.850 | |
| BX1125 | 2.222 | 0.15 | 203 | 15 | 0.304 | 50 | 0.01 | 203 | 2 | 0.456 | |
| BX1129 | 1.973 | 0.17 | 203 | 122 | 2.480 | 50 | 0.10 | 143 | 37 | 3.110 | |
| BX1140 | 1.487 | 0.18 | 806 | 13 | 1.070 | 100 | 0.01 | 454 | 1 | 1.240 | |
| BX1145 | 2.325 | 0.07 | 806 | 7 | 0.562 | 200 | 0.02 | 454 | 3 | 0.571 | |
| BX1157 | 2.081 | 0.08 | 3000 | 22 | 6.720 | 500 | 0.02 | 1278 | 10 | 5.740 | |
| BX1161 | 1.891 | 0.24 | 203 | 86 | 1.740 | 20 | 0.17 | 90 | 11 | 1.930 | |
| BX1164 | 2.593 | 0.15 | 15 | 67 | 0.101 | 0.15 | 15 | 67 | 0.101 | ||
| BX1166 | 1.334 | 0.14 | 1139 | 6 | 0.649 | 100 | 0.00 | 404 | 1 | 0.544 | |
| BX1169 | 1.871 | 0.17 | 454 | 33 | 1.490 | 100 | 0.07 | 286 | 10 | 1.680 | |
| BX1170 | 2.443 | 0.20 | 806 | 49 | 3.950 | 100 | 0.04 | 404 | 7 | 3.710 | |
| BX1172 | 2.806 | 0.20 | 10 | 127 | 0.127 | 50 | 0.00 | 161 | 5 | 0.571 | |
| BX1174 | 2.349 | 0.07 | 719 | 18 | 1.300 | 5000 | 0.07 | 719 | 18 | 1.360 | |
| BX1185 | 2.205 | 0.26 | 719 | 39 | 2.820 | 200 | 0.21 | 404 | 22 | 2.820 | |
| BX1186 | 2.079 | 0.22 | 10 | 52 | 0.052 | 10 | 0.20 | 10 | 26 | 0.045 | |
| BX1192 | 1.996 | 0.18 | 2600 | 36 | 9.450 | 100 | 0.10 | 404 | 11 | 5.980 | |
| BX1197 | 2.593 | 0.06 | 1434 | 23 | 3.350 | 500 | 0.04 | 719 | 19 | 2.990 | |
| BX1201 | 2.000 | 0.15 | 203 | 33 | 0.671 | 20 | 0.04 | 102 | 3 | 0.797 | |
| BX1204 | 2.205 | 0.21 | 640 | 36 | 2.330 | 50 | 0.05 | 255 | 3 | 2.250 | |
| BX1208 | 2.589 | 0.20 | 15 | 104 | 0.157 | 100 | 0.01 | 255 | 7 | 0.786 | |
| BX1222 | 2.442 | 0.21 | 9 | 102 | 0.093 | 10 | 0.20 | 8 | 69 | 0.090 | |
| BX1228 | 1.997 | 0.35 | 8 | 375 | 0.312 | 20 | 0.34 | 8 | 276 | 0.284 | |
| BX1229 | 1.343 | 0.26 | 50 | 50 | 0.251 | 10 | 0.24 | 20 | 25 | 0.162 | |
| BX1233 | 2.856 | 0.07 | 2200 | 26 | 5.780 | 1000 | 0.00 | 2100 | 10 | 7.240 | |
| BX1238 | 2.261 | 0.14 | 640 | 25 | 1.590 | 200 | 0.09 | 404 | 13 | 1.640 | |
| BX1240 | 2.282 | 0.14 | 114 | 44 | 0.507 | 10 | 0.05 | 50 | 3 | 0.460 | |
| BX1244 | 1.012 | 0.28 | 20 | 50 | 0.100 | 20 | 0.28 | 15 | 40 | 0.090 | |
| BX1245 | 2.093 | 0.01 | 1015 | 15 | 1.540 | 500 | 0.00 | 571 | 13 | 1.390 | |
| BX1250 | 1.855 | 0.15 | 640 | 18 | 1.150 | 100 | 0.07 | 286 | 7 | 1.110 | |
| BX1252 | 2.931 | 0.07 | 255 | 36 | 0.917 | 50 | 0.00 | 161 | 9 | 1.050 | |
| BX1253 | 1.933 | 0.13 | 1139 | 19 | 2.190 | 200 | 0.05 | 571 | 7 | 2.240 | |
| BX1264 | 2.942 | 0.00 | 2100 | 10 | 2.140 | 5000 | 0.00 | 2100 | 10 | 2.640 | |
| BX1265 | 2.434 | 0.12 | 255 | 34 | 0.873 | 50 | 0.01 | 180 | 6 | 1.060 | |
| BX1267 | 1.996 | 0.11 | 1900 | 22 | 4.100 | 5000 | 0.10 | 2500 | 25 | 8.120 | IRAC |
| BX1269 | 2.275 | 0.24 | 255 | 127 | 3.250 | 50 | 0.17 | 143 | 41 | 3.440 | |
| BX1274 | 2.596 | 0.10 | 640 | 32 | 2.050 | 0.10 | 640 | 32 | 2.050 | ||
| BX1277 | 2.268 | 0.09 | 454 | 25 | 1.110 | 100 | 0.00 | 286 | 7 | 1.200 | |
| BX1281 | 2.410 | 0.13 | 509 | 14 | 0.694 | 100 | 0.00 | 360 | 2 | 0.809 | |
| BX1283 | 2.427 | 0.10 | 2600 | 17 | 4.340 | 200 | 0.00 | 719 | 5 | 3.260 | |
| BX1284 | 2.273 | 0.07 | 1139 | 14 | 1.540 | 100 | 0.00 | 321 | 5 | 1.150 | |
| BX1287 | 1.675 | 0.28 | 9 | 305 | 0.278 | 10 | 0.00 | 90 | 0 | 0.921 | |
| BX1288 | 2.301 | 0.08 | 509 | 21 | 1.060 | 100 | 0.00 | 286 | 7 | 1.110 | |
| BX1289 | 2.488 | 0.17 | 404 | 46 | 1.850 | 50 | 0.06 | 203 | 7 | 2.000 | |
| BX1290 | 2.980 | 0.00 | 905 | 11 | 1.020 | 0.00 | 905 | 11 | 1.020 | ||
| BX1291 | 2.052 | 0.31 | 7 | 469 | 0.339 | 100 | 0.31 | 7 | 448 | 0.336 | |
| BX1296 | 1.988 | 0.23 | 3250 | 56 | 18.300 | 5000 | 0.20 | 3250 | 43 | 19.900 | |
| BX1297 | 2.274 | 0.24 | 2750 | 37 | 10.200 | 200 | 0.06 | 806 | 7 | 7.550 | |
| BX1303 | 2.305 | 0.10 | 1700 | 11 | 1.800 | 100 | 0.01 | 360 | 3 | 1.190 | |
| BX1305 | 2.234 | 0.15 | 2100 | 17 | 3.480 | 200 | 0.01 | 719 | 4 | 2.780 | |
| BX1307 | 2.002 | 0.20 | 404 | 92 | 3.720 | 10 | 0.18 | 50 | 12 | 1.810 | |
| BX1311 | 2.484 | 0.10 | 286 | 58 | 1.660 | 50 | 0.00 | 180 | 11 | 1.890 | |
| BX1313 | 2.635 | 0.20 | 15 | 121 | 0.183 | 1000 | 0.20 | 15 | 120 | 0.183 | |
| BX1315 | 1.671 | 0.22 | 571 | 46 | 2.620 | 100 | 0.17 | 255 | 22 | 2.560 | |
| BX1316 | 2.088 | 0.13 | 3000 | 23 | 6.980 | 1000 | 0.10 | 1434 | 18 | 5.670 | |
| BX1317 | 1.789 | 0.18 | 321 | 46 | 1.480 | 20 | 0.09 | 102 | 4 | 1.410 | |
| BX1324 | 1.818 | 0.34 | 509 | 65 | 3.320 | 10 | 0.26 | 90 | 0 | 2.710 | |
| BX1326 | 2.984 | 0.00 | 806 | 13 | 1.040 | 0.00 | 806 | 13 | 1.040 | ||
| BX1327 | 2.209 | 0.07 | 1139 | 16 | 1.870 | 200 | 0.01 | 509 | 7 | 1.750 | |
| BX1330 | 2.363 | 0.06 | 571 | 27 | 1.520 | 100 | 0.01 | 255 | 12 | 1.410 | |
| BX1332 | 2.214 | 0.29 | 15 | 282 | 0.427 | 20 | 0.09 | 90 | 8 | 1.400 | |
| BX1334 | 3.371 | 0.00 | 1800 | 9 | 1.700 | 500 | 0.00 | 1609 | 9 | 10.500 | |
| BX1339 | 1.988 | 0.09 | 1139 | 13 | 1.450 | 100 | 0.01 | 321 | 5 | 1.090 | |
| BX1343 | 2.268 | 0.13 | 1015 | 31 | 3.170 | 100 | 0.02 | 360 | 7 | 2.650 | |
| BX1348 | 1.921 | 0.09 | 509 | 9 | 0.468 | 100 | 0.01 | 255 | 4 | 0.426 | |
| BX1349 | 1.873 | 0.33 | 509 | 87 | 4.440 | 0.33 | 509 | 87 | 4.440 | ||
| BX1354 | 2.088 | 0.03 | 321 | 6 | 0.199 | 100 | 0.00 | 180 | 4 | 0.189 | |
| BX1358 | 2.943 | 0.04 | 641 | 12 | 0.753 | 100 | 0.00 | 255 | 6 | 0.660 | |
| BX1362 | 1.664 | 0.14 | 1609 | 16 | 2.580 | 200 | 0.10 | 509 | 9 | 2.160 | |
| BX1363 | 2.297 | 0.16 | 719 | 37 | 2.630 | 100 | 0.00 | 404 | 5 | 2.760 | |
| BX1364 | 2.183 | 0.15 | 719 | 29 | 2.110 | 100 | 0.06 | 321 | 8 | 1.980 | |
| BX1368 | 2.443 | 0.16 | 454 | 61 | 2.790 | 100 | 0.07 | 286 | 18 | 3.000 | |
| BX1376 | 2.430 | 0.07 | 255 | 16 | 0.416 | 50 | 0.00 | 143 | 5 | 0.426 | |
| BX1378 | 1.971 | 0.21 | 203 | 56 | 1.130 | 20 | 0.14 | 81 | 10 | 1.100 | |
| BX1387 | 2.324 | 0.11 | 640 | 14 | 0.929 | 200 | 0.07 | 360 | 9 | 0.897 | |
| BX1388 | 2.032 | 0.29 | 3000 | 43 | 13.000 | 500 | 0.21 | 1139 | 24 | 10.400 | |
| BX1391 | 1.906 | 0.22 | 203 | 50 | 1.010 | 20 | 0.14 | 90 | 6 | 1.120 | |
| BX1397 | 2.133 | 0.15 | 1015 | 30 | 3.080 | 100 | 0.04 | 360 | 7 | 2.650 | |
| BX1399 | 2.033 | 0.18 | 1800 | 15 | 2.670 | 200 | 0.14 | 509 | 9 | 2.050 | |
| BX1401 | 2.481 | 0.18 | 1139 | 85 | 9.650 | 100 | 0.01 | 454 | 9 | 8.580 | |
| BX1408 | 2.482 | 0.28 | 640 | 57 | 3.680 | 100 | 0.15 | 360 | 11 | 3.880 | |
| BX1409 | 2.237 | 0.29 | 2000 | 34 | 6.740 | 100 | 0.14 | 454 | 5 | 4.810 | |
| BX1420 | 2.133 | 0.24 | 255 | 87 | 2.210 | 50 | 0.12 | 180 | 15 | 2.720 | |
| BX1425 | 1.864 | 0.10 | 905 | 10 | 0.903 | 100 | 0.00 | 321 | 3 | 0.769 | |
| BX1427 | 2.548 | 0.13 | 719 | 29 | 2.070 | 100 | 0.01 | 360 | 6 | 2.050 | |
| BX1431 | 2.001 | 0.11 | 321 | 24 | 0.770 | 100 | 0.02 | 255 | 8 | 0.918 | |
| BX1434 | 1.994 | 0.15 | 454 | 21 | 0.956 | 200 | 0.13 | 286 | 15 | 0.931 | |
| BX1439 | 2.188 | 0.18 | 2750 | 34 | 9.270 | 200 | 0.05 | 719 | 9 | 6.590 | |
| BX1443 | 1.684 | 0.30 | 571 | 135 | 7.730 | 0.30 | 571 | 135 | 7.730 | ||
| BX1446 | 2.320 | 0.12 | 321 | 32 | 1.040 | 100 | 0.05 | 255 | 11 | 1.290 | |
| BX1451 | 2.245 | 0.21 | 905 | 41 | 3.740 | 200 | 0.18 | 404 | 25 | 3.330 | |
| BX1458 | 1.864 | 0.28 | 509 | 31 | 1.570 | 50 | 0.13 | 227 | 3 | 1.560 | |
| BX1460 | 3.134 | 0.00 | 2000 | 14 | 2.870 | 2000 | 0.00 | 1700 | 12 | 3.170 | |
| BX1461 | 2.107 | 0.15 | 255 | 20 | 0.514 | 200 | 0.14 | 203 | 15 | 0.535 | |
| BX1479 | 2.377 | 0.10 | 905 | 22 | 1.950 | 100 | 0.03 | 321 | 7 | 1.600 | |
| BX1480 | 2.545 | 0.21 | 203 | 80 | 1.630 | 5000 | 0.21 | 203 | 79 | 1.640 | |
| BX1485 | 2.548 | 0.14 | 1139 | 105 | 11.900 | 0.14 | 1139 | 105 | 11.900 | ||
| BX1495 | 2.247 | 0.13 | 1139 | 13 | 1.470 | 100 | 0.00 | 404 | 2 | 1.210 | |
| BX1501 | 1.877 | 0.18 | 321 | 50 | 1.600 | 100 | 0.06 | 321 | 10 | 2.350 | |
| BX1504 | 2.864 | 0.09 | 255 | 29 | 0.743 | 50 | 0.00 | 161 | 7 | 0.827 | |
| BX1514 | 2.135 | 0.17 | 1900 | 18 | 3.450 | 200 | 0.06 | 640 | 6 | 2.870 | |
| BX1525 | 1.689 | 0.29 | 1609 | 39 | 6.310 | 200 | 0.24 | 509 | 23 | 5.350 | |
| BX1530 | 2.421 | 0.14 | 360 | 29 | 1.030 | 500 | 0.14 | 286 | 26 | 1.010 | |
| BX1535 | 2.299 | 0.27 | 15 | 159 | 0.241 | 20 | 0.09 | 90 | 4 | 0.797 | |
| BX1542 | 1.018 | 0.31 | 15 | 25 | 0.038 | 200 | 0.31 | 15 | 24 | 0.038 | |
| BX1559 | 2.408 | 0.06 | 719 | 21 | 1.480 | 0.06 | 719 | 21 | 1.480 | ||
| BX1567 | 2.225 | 0.19 | 571 | 73 | 4.150 | 50 | 0.05 | 227 | 9 | 4.030 | |
| BX1568 | 1.787 | 0.23 | 15 | 145 | 0.220 | 10 | 0.00 | 102 | 0 | 0.997 | |
| BX1572 | 1.782 | 0.34 | 8 | 199 | 0.165 | 0.34 | 8 | 199 | 0.165 | ||
| BX1574 | 1.808 | 0.26 | 806 | 41 | 3.270 | 50 | 0.14 | 227 | 6 | 2.840 | |
| BX1588 | 2.221 | 0.25 | 143 | 207 | 2.960 | 10 | 0.15 | 64 | 5 | 3.220 | |
| BX1605 | 1.974 | 0.01 | 571 | 13 | 0.723 | 1000 | 0.00 | 454 | 12 | 0.689 | |
| BX1616 | 2.205 | 0.04 | 2500 | 5 | 1.250 | 500 | 0.01 | 905 | 4 | 0.967 | |
| BX1617 | 2.320 | 0.12 | 321 | 13 | 0.419 | 0.12 | 404 | 13 | 0.516 | ||
| BX1630 | 2.220 | 0.07 | 456 | 16 | 0.727 | 100 | 0.01 | 255 | 7 | 0.771 | |
| BX1636 | 2.300 | 0.28 | 255 | 129 | 3.300 | 10 | 0.24 | 45 | 20 | 1.770 | |
| BX1641 | 1.433 | 0.22 | 10 | 54 | 0.055 | 50 | 0.22 | 10 | 48 | 0.053 | |
| BX1642 | 2.007 | 0.14 | 360 | 25 | 0.914 | 0.14 | 360 | 25 | 0.914 | ||
| BX1650 | 2.097 | 0.17 | 203 | 85 | 1.730 | 50 | 0.07 | 161 | 19 | 2.270 | |
| BX1694 | 2.007 | 0.12 | 360 | 38 | 1.370 | 100 | 0.05 | 255 | 14 | 1.650 | |
| BX1708 | 1.987 | 0.34 | 1278 | 78 | 9.940 | 10 | 0.41 | 30 | 84 | 1.600 | |
| BX1817 | 1.860 | 0.37 | 114 | 109 | 1.240 | 50 | 0.36 | 72 | 74 | 1.180 | |
| BX1820 | 2.457 | 0.34 | 360 | 191 | 6.870 | 0.34 | 360 | 191 | 6.870 | ||
| BX1821 | 2.590 | 0.20 | 286 | 41 | 1.180 | 100 | 0.10 | 286 | 10 | 1.610 | |
| BX1823 | 1.818 | 0.40 | 2750 | 69 | 18.900 | 200 | 0.26 | 719 | 20 | 14.300 | |
| BX1826 | 2.929 | 0.01 | 2100 | 12 | 2.540 | 200 | 0.00 | 509 | 8 | 1.810 | |
| BX1827 | 1.988 | 0.46 | 7 | 392 | 0.284 | 0.46 | 7 | 392 | 0.284 | ||
| BX1848 | 2.648 | 0.07 | 571 | 12 | 0.700 | 100 | 0.00 | 321 | 3 | 0.792 | |
| BX82 | 1.023 | 0.20 | 404 | 6 | 0.225 | 10 | 0.01 | 227 | 0 | 0.310 | |
| BX84 | 2.163 | 0.16 | 1278 | 38 | 4.860 | 0.16 | 1278 | 38 | 4.860 | ||
| BX150 | 2.277 | 0.16 | 2400 | 26 | 6.290 | 100 | 0.06 | 321 | 10 | 2.350 | |
| BX184 | 1.998 | 0.45 | 7 | 676 | 0.489 | 0.45 | 7 | 676 | 0.489 | ||
| BX305 | 2.482 | 0.29 | 719 | 88 | 6.300 | 100 | 0.17 | 360 | 18 | 6.290 | |
| BX308 | 2.376 | 0.21 | 719 | 38 | 2.730 | 100 | 0.03 | 454 | 3 | 3.040 | |
| BX313 | 2.323 | 0.15 | 905 | 32 | 2.880 | 0.15 | 905 | 32 | 2.880 | ||
| BX341 | 2.117 | 0.05 | 905 | 25 | 2.280 | 0.05 | 905 | 25 | 2.280 | ||
| BM1008 | 1.799 | 0.24 | 15 | 149 | 0.226 | 200 | 0.24 | 15 | 142 | 0.223 | |
| BM1011 | 1.677 | 0.23 | 161 | 53 | 0.846 | 20 | 0.14 | 102 | 4 | 1.230 | |
| BM1030 | 1.142 | 0.35 | 35 | 51 | 0.177 | 10 | 0.33 | 20 | 22 | 0.138 | |
| BM1048 | 1.380 | 0.17 | 255 | 32 | 0.806 | 10 | 0.13 | 55 | 2 | 0.570 | |
| BM1053 | 1.459 | 0.04 | 640 | 3 | 0.219 | 200 | 0.02 | 321 | 2 | 0.197 | |
| BM1061 | 2.089 | 0.00 | 3000 | 4 | 1.070 | 0.00 | 3000 | 4 | 1.070 | ||
| BM1063 | 2.087 | 0.10 | 3000 | 14 | 4.150 | 200 | 0.01 | 640 | 6 | 2.740 | |
| BM1064 | 1.524 | 0.17 | 255 | 28 | 0.708 | 10 | 0.04 | 114 | 0 | 0.971 | |
| BM1069 | 2.028 | 0.14 | 3000 | 29 | 8.650 | 500 | 0.06 | 1434 | 9 | 7.850 | |
| BM1072 | 1.143 | 0.27 | 15 | 74 | 0.112 | 10 | 0.28 | 10 | 61 | 0.105 | |
| BM1092 | 1.479 | 0.26 | 20 | 66 | 0.131 | 20 | 0.00 | 180 | 0 | 0.759 | |
| BM1095 | 1.447 | 0.07 | 571 | 7 | 0.387 | 50 | 0.00 | 203 | 1 | 0.382 | |
| BM1098 | 1.671 | 0.22 | 255 | 51 | 1.290 | 10 | 0.14 | 72 | 1 | 1.220 | |
| BM1122 | 1.990 | 0.16 | 30 | 57 | 0.172 | 20 | 0.15 | 20 | 43 | 0.147 | |
| BM1135 | 1.872 | 0.20 | 905 | 55 | 4.990 | 1000 | 0.20 | 640 | 52 | 4.660 | |
| BM1139 | 1.919 | 0.07 | 1139 | 18 | 2.040 | 0.07 | 1139 | 18 | 2.040 | ||
| BM1148 | 2.049 | 0.13 | 20 | 89 | 0.178 | 20 | 0.12 | 15 | 70 | 0.159 | |
| BM1149 | 1.630 | 0.17 | 15 | 30 | 0.045 | 0.17 | 15 | 30 | 0.045 | ||
| BM1153 | 2.444 | 0.12 | 2600 | 50 | 13.100 | 1000 | 0.04 | 2600 | 14 | 17.800 | |
| BM1155 | 2.020 | 0.01 | 905 | 11 | 1.030 | 2000 | 0.00 | 806 | 10 | 1.040 | |
| BM1159 | 1.016 | 0.12 | 286 | 19 | 0.533 | 100 | 0.10 | 180 | 11 | 0.568 | |
| BM1160 | 1.364 | 0.23 | 128 | 20 | 0.255 | 10 | 0.10 | 90 | 0 | 0.440 | |
| BM1161 | 2.045 | 0.00 | 2750 | 4 | 1.190 | 0.00 | 2750 | 4 | 1.190 | ||
| BM1163 | 1.874 | 0.20 | 286 | 23 | 0.669 | 100 | 0.18 | 161 | 16 | 0.632 | |
| BM1171 | 2.082 | 0.07 | 806 | 10 | 0.831 | 0.07 | 806 | 10 | 0.831 | ||
| BM1172 | 1.864 | 0.08 | 321 | 13 | 0.423 | 1000 | 0.07 | 286 | 13 | 0.416 | |
| BM1175 | 1.773 | 0.21 | 114 | 53 | 0.605 | 0.21 | 114 | 53 | 0.605 | ||
| BM1180 | 1.598 | 0.18 | 806 | 32 | 2.580 | 100 | 0.10 | 321 | 10 | 2.320 | |
| BM1181 | 1.743 | 0.30 | 7 | 645 | 0.467 | 0.30 | 7 | 645 | 0.467 | ||
| BM1195 | 1.289 | 0.24 | 640 | 25 | 1.610 | 10 | 0.28 | 30 | 18 | 0.336 | |
| BM1196 | 1.863 | 0.00 | 404 | 6 | 0.238 | 0.00 | 404 | 6 | 0.238 | ||
| BM1197 | 1.566 | 0.20 | 360 | 30 | 1.090 | 10 | 0.09 | 114 | 0 | 1.280 | |
| BM1198 | 1.780 | 0.30 | 15 | 203 | 0.307 | 10 | 0.31 | 10 | 169 | 0.290 | |
| BM1200 | 2.078 | 0.09 | 640 | 23 | 1.490 | 1000 | 0.08 | 571 | 20 | 1.550 | |
| BM1201 | 1.001 | 0.04 | 806 | 2 | 0.200 | 100 | 0.00 | 286 | 1 | 0.178 | |
| BM1204 | 1.489 | 0.12 | 360 | 21 | 0.742 | 20 | 0.02 | 128 | 1 | 0.821 | |
| BM1205 | 1.711 | 0.04 | 3500 | 8 | 2.720 | 1000 | 0.03 | 1434 | 7 | 2.090 | |
| BM1207 | 1.083 | 0.31 | 15 | 57 | 0.087 | 50 | 0.35 | 10 | 88 | 0.098 | |
| BM1209 | 1.775 | 0.34 | 10 | 365 | 0.365 | 10 | 0.32 | 9 | 222 | 0.331 | |
| BM1226 | 1.355 | 0.35 | 10 | 104 | 0.104 | 50 | 0.34 | 10 | 90 | 0.099 | |
| BM1289 | 2.380 | 0.23 | 8 | 139 | 0.115 | 10 | 0.23 | 7 | 108 | 0.114 | |
| BM1299 | 1.595 | 0.35 | 114 | 203 | 2.320 | 5000 | 0.35 | 114 | 202 | 2.330 | |
| BM1303 | 1.721 | 0.30 | 719 | 34 | 2.470 | 0.30 | 719 | 34 | 2.470 | ||
| BM1334 | 1.893 | 0.24 | 509 | 58 | 2.930 | 100 | 0.17 | 255 | 25 | 2.900 | |
| BM1335 | 1.489 | 0.51 | 10 | 1061 | 1.060 | 50 | 0.51 | 10 | 914 | 1.010 | |
| BM1339 | 1.338 | 0.37 | 10 | 309 | 0.309 | 10 | 0.12 | 81 | 0 | 1.030 | |
| BM1358 | 1.807 | 0.34 | 1278 | 81 | 10.400 | 500 | 0.32 | 719 | 63 | 10.100 | |
| BM1369 | 1.879 | 0.41 | 7 | 277 | 0.200 | 50 | 0.44 | 6 | 394 | 0.253 | |
| BM1375 | 2.109 | 0.07 | 2500 | 23 | 5.720 | 500 | 0.04 | 905 | 18 | 4.520 | |
| BM1396 | 1.743 | 0.33 | 128 | 143 | 1.830 | 20 | 0.26 | 81 | 22 | 2.400 | |
| BM72 | 1.571 | 0.19 | 1139 | 14 | 1.580 | 200 | 0.13 | 454 | 7 | 1.190 | |
| C2 | 2.991 | 0.20 | 454 | 40 | 1.830 | 1000 | 0.34 | 40 | 163 | 0.666 | |
| C11 | 2.990 | 0.31 | 9 | 326 | 0.297 | 20 | 0.01 | 114 | 2 | 0.895 | |
| C12 | 2.975 | 0.39 | 10 | 891 | 0.891 | 10 | 0.12 | 81 | 1 | 2.520 | |
| C14 | 2.973 | 0.46 | 8 | 779 | 0.648 | 50 | 0.46 | 8 | 694 | 0.628 | |
| C16 | 2.929 | 0.46 | 9 | 2025 | 1.850 | 0.46 | 9 | 2025 | 1.850 | ||
| C29 | 3.110 | 0.11 | 1015 | 26 | 2.690 | 100 | 0.00 | 360 | 6 | 2.160 | |
| C30 | 3.328 | 0.04 | 454 | 25 | 1.140 | 200 | 0.00 | 321 | 15 | 1.160 | |
| C33 | 3.130 | 0.03 | 454 | 36 | 1.650 | 5000 | 0.02 | 454 | 35 | 1.660 | |
| C35 | 3.363 | 0.07 | 1680 | 28 | 4.660 | 500 | 0.04 | 806 | 20 | 3.970 | |
| C41 | 3.148 | 0.04 | 2000 | 15 | 3.030 | 1000 | 0.00 | 2000 | 8 | 5.340 | |
| C42 | 3.411 | 0.12 | 227 | 55 | 1.260 | 2000 | 0.12 | 227 | 53 | 1.260 | |
| C48 | 3.206 | 0.26 | 15 | 179 | 0.270 | 50 | 0.02 | 180 | 6 | 1.050 | |
| C53 | 3.103 | 0.30 | 9 | 249 | 0.227 | 200 | 0.30 | 9 | 243 | 0.227 | |
| S03-C7 | 2.658 | 0.34 | 5 | 546 | 0.274 | 10 | 0.34 | 5 | 397 | 0.258 | |
| S03-C8 | 2.988 | 0.12 | 255 | 45 | 1.140 | 50 | 0.00 | 203 | 5 | 1.460 | |
| S03-C17 | 3.163 | 0.00 | 1900 | 11 | 2.140 | 5000 | 0.00 | 1900 | 11 | 2.470 | |
| D14 | 2.979 | 0.04 | 2000 | 13 | 2.580 | 1000 | 0.04 | 1015 | 11 | 1.990 | |
| D16 | 2.930 | 0.00 | 719 | 8 | 0.558 | 0.00 | 719 | 8 | 0.558 | ||
| D23 | 3.125 | 0.06 | 1015 | 47 | 4.750 | 200 | 0.00 | 454 | 23 | 3.910 | |
| D25 | 2.970 | 0.07 | 10 | 55 | 0.056 | 50 | 0.06 | 10 | 49 | 0.054 | |
| D26 | 2.975 | 0.03 | 2100 | 7 | 1.500 | 2000 | 0.01 | 1800 | 6 | 1.630 | |
| D28 | 2.932 | 0.41 | 9 | 1343 | 1.230 | 50 | 0.10 | 203 | 16 | 4.620 | |
| D29 | 3.451 | 0.04 | 203 | 34 | 0.697 | 100 | 0.01 | 143 | 21 | 0.675 | |
| D32 | 2.962 | 0.00 | 1015 | 9 | 0.944 | 0.00 | 1015 | 9 | 0.944 | ||
| D34 | 2.972 | 0.14 | 1139 | 19 | 2.190 | 200 | 0.04 | 571 | 6 | 2.040 | |
| D35 | 3.196 | 0.38 | 6 | 787 | 0.474 | 10 | 0.37 | 6 | 522 | 0.432 | |
| D38 | 2.940 | 0.23 | 128 | 102 | 1.300 | 50 | 0.18 | 102 | 44 | 1.470 | |
| D39 | 2.987 | 0.23 | 10 | 135 | 0.135 | 0.23 | 10 | 135 | 0.135 | ||
| D47 | 3.191 | 0.00 | 1278 | 8 | 1.050 | 0.00 | 1278 | 8 | 1.050 | ||
| D55 | 3.245 | 0.26 | 9 | 521 | 0.475 | 0.26 | 9 | 521 | 0.475 | ||
| S03-oD3 | 2.725 | 0.00 | 806 | 11 | 0.906 | 500 | 0.00 | 509 | 10 | 0.882 | |
| S03-oD12 | 2.418 | 0.28 | 25 | 129 | 0.324 | 10 | 0.27 | 15 | 74 | 0.262 | |
| MD4 | 2.867 | 0.07 | 905 | 12 | 1.120 | 500 | 0.06 | 571 | 10 | 1.060 | |
| MD6 | 3.243 | 0.05 | 1900 | 34 | 6.460 | 200 | 0.00 | 571 | 15 | 4.910 | |
| MD13 | 2.974 | 0.19 | 321 | 112 | 3.600 | 50 | 0.04 | 227 | 9 | 4.190 | |
| MD33 | 2.932 | 0.34 | 8 | 706 | 0.587 | 50 | 0.00 | 227 | 5 | 2.150 | |
| MD48 | 2.926 | 0.16 | 1434 | 37 | 5.280 | 200 | 0.11 | 509 | 19 | 4.410 | |
| MD49 | 2.850 | 0.29 | 9 | 485 | 0.442 | 50 | 0.00 | 203 | 6 | 1.780 | |
| MD50 | 3.236 | 0.00 | 905 | 12 | 1.090 | 100 | 0.00 | 255 | 7 | 0.874 | |
| MD54 | 2.939 | 0.12 | 1900 | 21 | 4.070 | 500 | 0.10 | 806 | 17 | 3.330 | |
| MD55 | 2.956 | 0.20 | 128 | 60 | 0.761 | 50 | 0.08 | 161 | 10 | 1.160 | |
| MD75 | 2.790 | 0.55 | 4 | 7037 | 2.800 | 50 | 0.55 | 4 | 6701 | 2.780 | |
| MD83 | 3.213 | 0.00 | 404 | 18 | 0.717 | 0.00 | 404 | 18 | 0.717 | ||
| S03-M16 | 2.939 | 0.01 | 2100 | 12 | 2.470 | 200 | 0.00 | 509 | 8 | 1.780 | |
| S03-M25 | 3.106 | 0.00 | 1015 | 11 | 1.120 | 200 | 0.00 | 360 | 9 | 0.904 | |
| S03-M35 | 3.229 | 0.35 | 10 | 910 | 0.910 | 10 | 0.34 | 9 | 558 | 0.830 |
| Sample | aaNumber of galaxies for which we derived best-fit SED parameters (including stellar mass), regardless of whether the galaxies were imaged at . The parentheses indicate the number of galaxies with measured , or . | bbMedian stellar mass assuming a constant star formation (CSF) history. Numbers in parentheses give the median stellar mass for those galaxies with , or . | ccMean and dispersion of stellar mass distribution assuming a CSF history. Numbers in parentheses give the mean stellar mass and dispersion for those galaxies with , or . |
|---|---|---|---|
| BM | 51 (3) | 9.87 (10.70) | () |
| BX | 157 (7) | 10.20 (10.98) | () |
| LBG | 46 (0) | 10.05 (…) | (…) |
| Total | 254 (10) | 10.10 (10.98) | () |
| Name | z | X-ray?aaIndicates if the source lies within of an X-ray counterpart in the Ms data (Alexander et al., 2003). | Optical?bbIndicates if the source shows high ionization optical emission lines indicative of AGN/QSO. | m?ccIndicates if the source has a significant m excess compared with the flux at shorter wavelengths, larger than would be expected from a single stellar population. | m?ddIndicates if the source has a m flux Jy. | Notesee magnitudes are indicated for AGN with , or . |
|---|---|---|---|---|---|---|
| BX1637 | 2.487 | no | yes (AGN) | yes | yes | ACS point source |
| BX160 | 2.460 | no | yes (AGN) | yes | yes | |
| BM1083 | 2.414 | yes | yes (QSO) | yes | yes | |
| BM1119 | 1.717 | yes | no | yes | yes | |
| BM1156 | 2.211 | noffBM1156 is not included in the Chandra 2 Ms catalogs, but further refinements to the X-ray data reduction procedure yielded a very weak detection (N. Brandt, private communication). | yes (AGN) | yes | yes | very weak X-ray source |
| BM1384 | 2.243 | yes | yes (AGN) | yes | no | |
| MD31 | 2.981 | yes | no | no | no | ACS point source |
| MD39 | 2.583 | yes | yes (QSO) | yes | yes | |
| MD74 | 2.635 | no | no | yes | yes | |
| S03-oC34 | 3.413 | yes | yes (QS0) | no | no | |
| S03-MD12 | 2.647 | yes | yes (AGN) | yes | yes |