The Chrysalis Opens? Photometry from the Eta Carinae HST Treasury Project, 2002–200611affiliation: This research was conducted as part of the Eta Carinae Hubble Space Telescope Treasury project via grant no. GO-9973 from the Space Telescope Science Institute. The HST is operated by the Association of Universities for Research in Astronomy, Inc., under NASA contract NAS5-26555. 22affiliation: Some of the data presented in this paper were obtained from the Multi-mission Archive at the Space Telescope Science Institute (MAST). STScI is operated by the Association of Universities for Research in Astronomy, Inc., under NASA contract NAS5-26555. Support for MAST for non-HST data is provided by the NASA Office of Space Science via grant NAG5-7584 and by other grants and contracts.
Abstract
During the past decade Car has brightened markedly, possibly indicating a change of state. Here we summarize photometry gathered by the Hubble Space Telescope as part of the HST Treasury Project on this object. Our data include STIS/CCD acquisition images, ACS/HRC images in four filters, and synthetic photometry in flux-calibrated STIS spectra. The HST’s spatial resolution allows us to examine the central star separate from the bright circumstellar ejecta. Its apparent brightness continued to increase briskly during 2002–06, especially after the mid-2003 spectroscopic event. If this trend continues, the central star will soon become brighter than its ejecta, quite different from the state that existed only a few years ago. One precedent may be the rapid change observed in 1938–1953. We conjecture that the star’s mass-loss rate has been decreasing throughout the past century.
1 Introduction
Eta Carinae’s photometric record is unparalleled among well-studied objects, especially since it has been near or exceeded the classical Eddington limit during the past two or three centuries. From 1700 to 1800 it gradually brightened from 4th to 2nd magnitude, and then experienced its famous Great Eruption or “supernova impostor event” beginning about 1837. For twenty years it was one of the brightest stars in the sky, rapidly fluctuating between magnitudes 1.5 and 0.0, briefly attaining . After 1858 it faded below 7th magnitude, presumably enshrouded in the nascent Homunculus nebula. Subsequent behavior, however, has been more complex than one might have expected. A mysterious secondary eruption occurred in 1887–1900; then the apparent brightness leveled off around for about 40 years, followed by a rapid increase in 1938–53; after that it brightened at a fairly constant rate for another 40-year interval, and most recently the rate accelerated in the 1990’s. Some, but not all, of the secular brightening can be attributed to decreasing obscuration as the Homunculus nebula expands. However, in truth this is more complex than it appears. The star’s physical structure has been changing in a decidedly non-trivial way which is, at best, only dimly understood. For historical and observational details see Davidson & Humphreys (1997); Frew (2005); de Vaucouleurs & Eggen (1952); O’Connell (1956); Feinstein (1967); Feinstein & Marraco (1974); Mattei & Foster (1998); Davidson et al. (1999a, b); van Genderen et al. (1999); Sterken et al. (1999); Martin & Koppelman (2004).
Spectroscopic changes have occurred along with the brightness variations. The 5.5-year spectroscopic/photometric cycle (Gaviola, 1953; Zanella et al., 1984; Whitelock et al., 1994, 2004; Damineli, 1996; Martin & Koppelman, 2004) is not apparent in data obtained before the 1940’s (Feast et al., 2001; Humphreys & Koppelman, 2005). Brief “spectroscopic events” marking the cycle are most likely mass-ejection or wind-disturbance episodes, probably regulated by a companion star (Zanella et al., 1984; Davidson, 1999; Smith et al., 2003; Martin et al., 2006a). At visual wavelengths, the associated ephemeral brightness changes represent mainly emission lines in the stellar wind, while the longer-term secular brightening trend involves the continuum (Martin & Koppelman, 2004; Martin, 2005). Humphreys & Koppelman (2005), Davidson et al. (2005), and Davidson (2005) have speculated that the four obvious disruptions in the photometric record – c. 1843, 1893, 1948, and 2000 – might indicate a quasi-periodicity of the order of 50 years.111 So far as we know, this idea was first voiced by Humphreys at two meetings in 2002, but it did not appear in the published proceedings In any case the star has not yet recovered from its Great Eruption seen 160 years ago.
The Hubble Space Telescope (HST) Treasury Program for Car was planned specifically to study the 2003.5 spectroscopic event. We employed the Space Telescope Imaging Spectrograph (STIS) and Advanced Camera for Surveys (ACS), following earlier STIS observations that began in 1998 (Davidson, 2004). Fortuitously, the STIS data almost coincide with a rapid secular brightening which began shortly before 1998 (see Section 4 below). Those and the ACS images are of unique photometric value for at least two reasons:
-
1.
At visual wavelengths, normal ground-based observations have been dominated by the surrounding Homunculus ejecta-nebula, which, until recently, appeared much brighter than the central star and which has structure at all size scales from 0.1 to 8 arcseconds. So far, only the HST has provided well-defined measurements of just the central star.222 At least this is true for visual and UV wavelengths. The near-infrared photometry reported by Whitelock et al. (1994) and Whitelock et al. (2004) may be strongly dominated by the central star. Those observations probably represent free-free emission in the wind at larger radii than the visual wavelength data. They show both the spectroscopic events and the brightening trend better than other ground-based measurements. The Homunculus is primarily a reflection nebula, but the Homunculus/star brightness ratio has changed substantially. During 1998-99, for instance, the star nearly tripled in apparent brightness while ground-based observations showed only about a 0.3-magnitude brightening of Homunculus plus star (Davidson et al., 1999b). This rather mysterious development is known from HST/STIS and HST/ACS data.
-
2.
Numerous strong emission lines perturb the results for standard photometric systems. H and H emission, for example, have equivalent widths of about 800 and 180 Å respectively in spectra of Car. Broad-band , , , and magnitudes, and most medium-band systems as well, are therefore poorly defined for this object. Photometry around 5500 Å, e.g. broad-band , is relatively free of strong emission lines, but transformations from instrumental magnitudes to a standard system require the other filters (Davidson et al., 1999b; Sterken et al., 2001; van Genderen, et al., 2003). This difficulty is somewhat lessened for HST observations restricted to the central star, whose spectrum has fewer emission lines than the bright ejecta; and some of the HST/ACS filters are fairly well-adapted to the case. At any rate the STIS and ACS data appear to be stable and internally consistent. Detector and filter systems used in most ground-based work, on the other hand, require fluctuating instrumental and atmospheric corrections, and do not give any major advantage for this object.
In this paper we present the complete set of photometric data gathered for the Car HST Treasury Project. The central star has brightened, especially in the UV, since the HST results described by Martin & Koppelman (2004). We report three types of later measurements:
-
1.
The star’s brightness in acquisition images made with STIS before that instrument’s failure in early 2004. These images represent a broad, non-standard wavelength range from 6500 to 9000 Å.
-
2.
The star’s brightness in ACS/HRC images made in four filters (F220W, F250W, F330W, & F550M) from October 2002 to the present.
-
3.
Synthetic photometry in flux-calibrated STIS spectra.
After presenting the data below, we briefly discuss the observed trends and what they bode for the near future of Car. Our principal reason for reporting these data now is that the Treasury Program observations have been completed; future HST/ACS observations are possible but not assured. These last Treasury Program observations are essential for demonstrating the secular trend in brightness (see Section 4), that these brightness changes suggest a fundamental change in the state of the star (see Section 5) and what the near future may hold for Carinae (5.4).
2 Data
2.1 STIS Acquisition Images
Each set of STIS observations included a pair of acquisition images, which are 100 x 100 pixel sub-frames () centered on the middle row and column of the CCD (Clampin et al., 1996; Downes et al., 1997; Kim Quijano et al., 2003). The STIS acquisition images were taken with a neutral density filter (F25ND3) which, combined with the CCD response, covered the wavelength range 2000–11000 Å. Since the star’s apparent color is moderately red, these images were dominated by fluxes at wavelengths 6500–9000 Å. Fig. 1 shows that although most of the measured flux comes from the continuum, several prominent emission features including H contributed to the measured brightness. We measure the star’s brightness with in radius in the following manner: If denotes the flux level in an image where the star was centered at , , we integrate the product of , where is a radially symmetric weighting function of the form ,. In effect is a “parabolic virtual field aperture.” For the STIS acquisition images we chose (6 pixels). A detailed discussion of these reduction procedures, including a non-standard bias level correction which we applied, is given in Martin & Koppelman (2004).
Initially we expected to add a few more points of acquisition photometry after 2004.5, but the failure of the STIS in August 2004 curtailed our observing plans. Thus we have only two additional STIS data points to report (Table 1) beyond those given in Martin & Koppelman (2004). They are useful, however, concerning the end of the post-event recovery (see Sections 4 and 5 below).
2.2 HST ACS
HST ACS/HRC observations of Car were obtained for the Treasury Project beginning in October 2002. We have also examined publicly available data from HST proposal 9721333“The Kinematics and Dynamics of the Material Surrounding Eta Carinae,” B. Dorland, principal investigator and HST proposal 10844444“Following Eta Carinae’s Change of State,” K. Davidson, principal investigator. The bias-corrected, dark-subtracted, and flat-fielded data were obtained from the Space Telescope Science Institute via the Multi-Mission Archive (MAST) (Sirianni et al., 2005).555http://archive.stsci.edu
Treasury Program ACS/HRC images were taken in four filters that cover near-UV to visual wavelengths (Fig. 1):
- •
-
•
HRC/F330W: This filter includes the Balmer continuum in emission, supplemented by various emission lines. It also attained the best spatial resolution among the observations reported here.
-
•
HRC/F550M: With a medium-width (not broad) bandpass, this filter samples the visual-wavelength continuum flux with only minor contamination by emission features.
The brightness of the central star was measured using the same 0.3 ( 10 ACS/HRC pixels) weighted virtual aperture used for the STIS acquisition images. CCD flux values were converted to the STMAG system (Koornneef et al., 1986) using the keywords provided in the MAST archive’s FITS headers. An aperture correction à la Sirianni et al. (2005), calculated from observations of the white dwarf GD 71 in each of the filters (Table 2), was applied to the measurements (Table 3). ACS fluxes and magnitudes measured prior to MJD 52958 (2003.87) can be found in our first paper (Martin & Koppelman, 2004). Caveat: We did not apply the aperture corrections to the magnitudes in that paper, but we have done so in the plots shown here.
The F220W and F250W filters have known red leaks (Gonzaga et al., 2001) that can affect photometry of red sources. We convolved extracted STIS spectra (see Sec. 2.3) with the response function for those filters and the ACS/HRC. In the case of the central star of Car, the flux redward of 4000Å in the F220W and F250W filters contributed only about 0.25% and 0.06% respectively, insignificant compared to other sources of error.
2.3 STIS Synthetic Photometry
Originally the ACS/HRC images were meant to supplement the STIS spectra. After the untimely demise of the STIS, however, the ACS/HRC became the most suitable mode for observing Car with HST. This presented a problem of continuous monitoring in the same band passes over the entire program, since there were no ACS/HRC images prior to 2002.78 while the STIS data ended at 2004.18.
ACS photometry can be synthesized from the flux calibrated STIS data, since nearly every grating tilt was observed during each STIS visit (Table 4). The spectra were extracted with a weighted parabolic cross dispersion profile similar to the virtual aperture used to measure the ACS/HRC images, convolved with the published filter functions (Fig 1), and integrated. Because STMAG is computed from flux density, the integrated fluxes were divided by the effective band passes of each filter (see Table 2).
The effective aperture for the extracted STIS spectral data is not a rotated parabola but a parabolic cylinder having the width of the slit (0.1″). To correct for the difference in aperture as well as the difference in instrumental PSF, slit throughput, and the extraction height, we converted the STIS spectral fluxes to the ACS/HRC flux scale using suitable correction factors (Table 2). Those factors were computed by comparing the results from ACS/HRC images and photometry synthesized from STIS data obtained at time MJD 52683. The resulting synthetic ACS/HRC photometry is given in Table 5.
3 Distribution of Surface Brightness in the Homunculus
Since HST and ground-based photometry have shown different rates of change for different-sized areas, it is useful to view the spatial distribution of the brightness. For this purpose we have used three ACS images made with filter F550M at 2004.93, 2005.53, and 2005.85. Together these give a reasonably valid picture of the average visual-wavelength appearance during 2005.
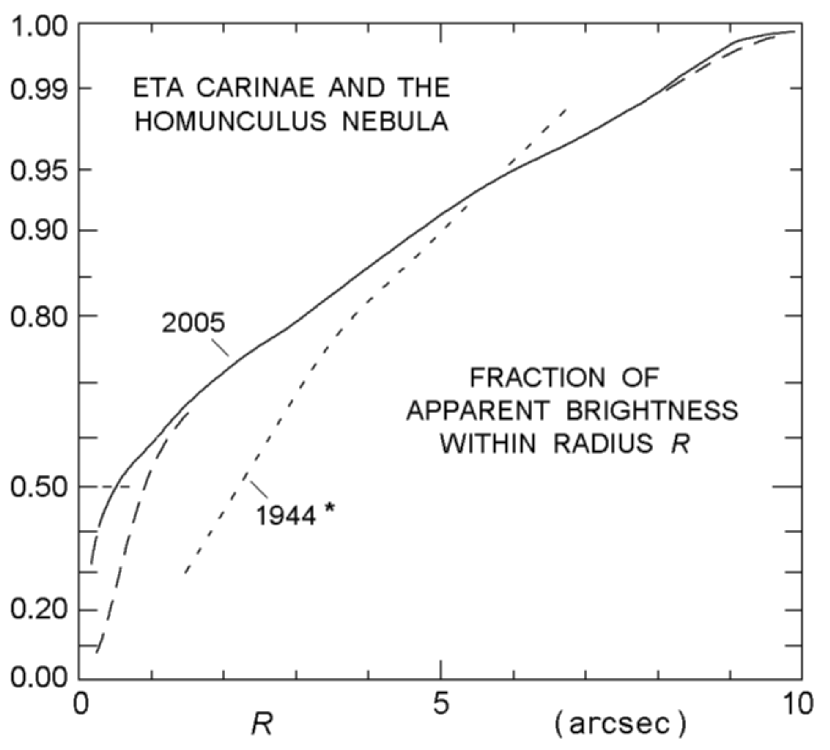
Fig. 2 shows the fraction of apparent brightness within projected radius measured from the central star. The solid curve represents the HST data, while a companion dashed curve incorporates Gaussian blurring with FWHM = 0.8″, simulating ground-based photometry with fairly good atmospheric conditions. Half the total light originates within – which is very different from Car’s appearance a few decades ago (Gaviola, 1950; Thackeray, 1953; Gehrz & Ney, 1972; Davidson & Ruiz, 1975; van Genderen & Thé, 1984). Fig. 2 also shows a curve based on photographs that Gaviola obtained in 1944 (Gaviola, 1950; Davidson & Ruiz, 1975), with a magnified spatial scale to compensate for subsequent expansion; even allowing for mediocre “seeing” and other uncertainties, the degree of central condensation was obviously less then. Before 1980 the central star accounted for less than 10% of the total apparent brightness; now its fraction has grown to about 40% and continues to increase.
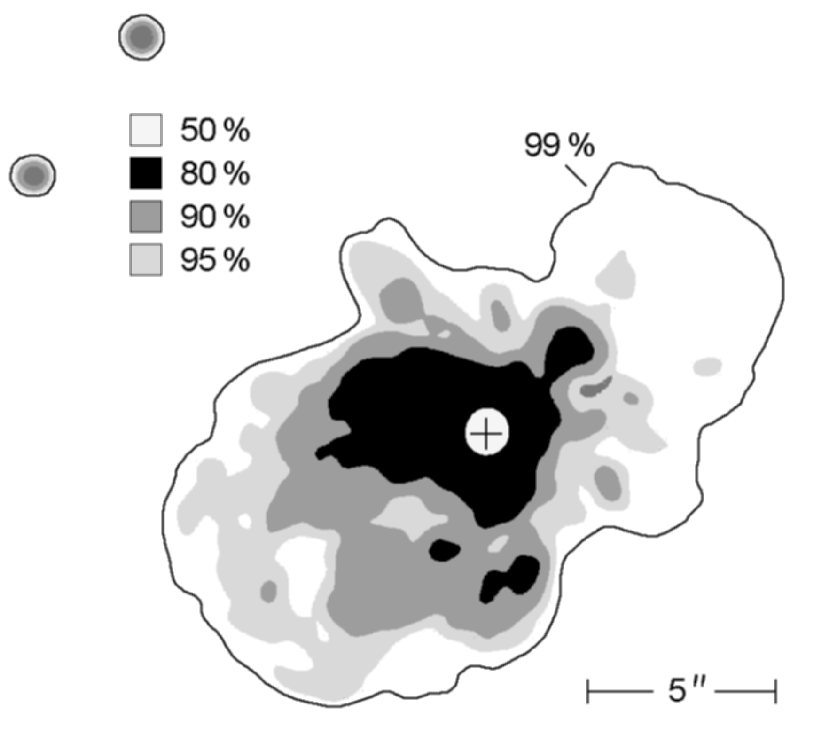
Fig. 3 is a map of the surface brightness, based on the HST/ACS F550M data mentioned above. In order to produce simple well-defined isophotes, we have Gaussian-blurred the image using FWHM 0.5″. Apart from the central star and nearby compact ejecta, most of the light comes from a comma- or crescent-shaped region about 5″ across, marked by the 80% isophote in the figure. Presumably the high intensity in this area results from strong forward scattering by dust grains in that part of the southeast Homunculus lobe. Surface brightnesses in the outer lobe regions, on the other hand, are fainter than the 50% contour by factors typically between 100 and 200. About half of the projected area of the Homunculus provides only 5% of the total visual-wavelength brightness.
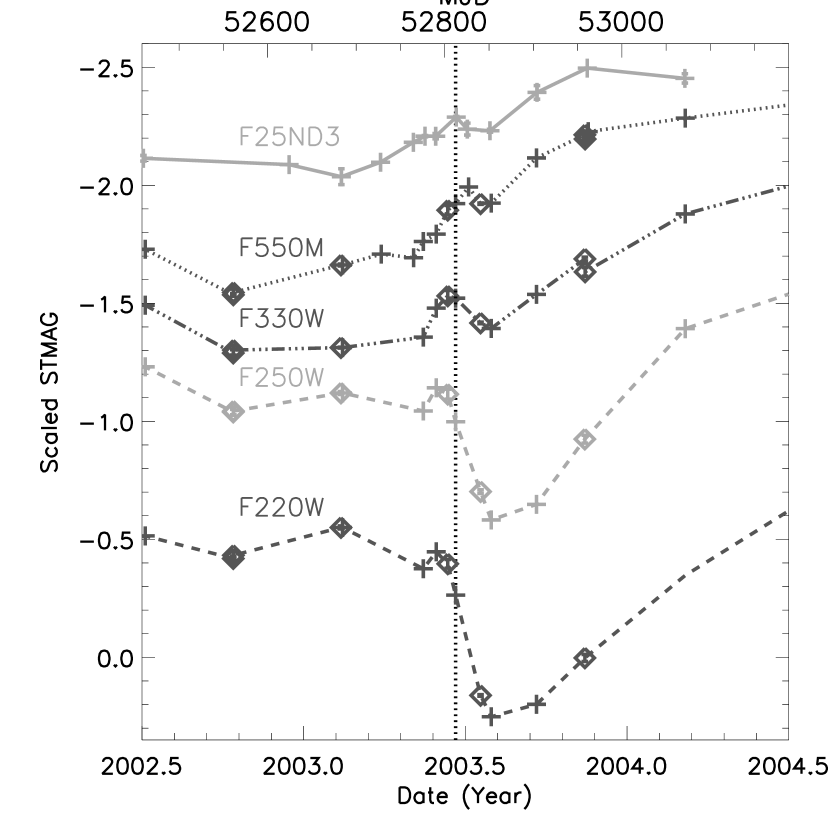
4 The Eight-year Trend
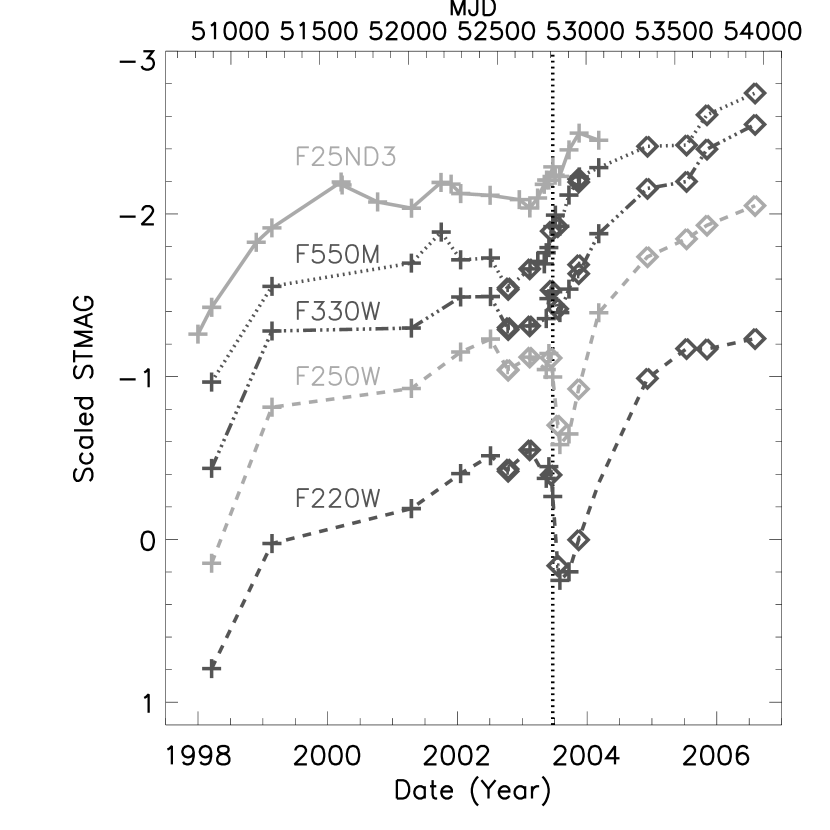
Fig. 4 shows the main HST photometric data on the central star; the most significant result is a secular brightening trend superimposed on the 5.5-year pattern of spectroscopic events. The latest observations are essential in this regard, because the data reported earlier by Martin & Koppelman (2004) ended before the star had emerged from the 2003.5 event and we could not be sure of the long term trend. From 1999 to 2006 the average trend was about 0.15 magnitude per year at visual wavelengths and 0.19 mag yr-1 at 2200 Å – much faster than the rate of 0.025 mag yr-1 recorded for the Homunculus plus star from 1955 to 1995 (Davidson et al., 1999b; Martin, 2005).
The Weigelt condensations northwest of the central star Weigelt & Ebersberger (1986) have not brightened rapidly. Located in the equatorial plane only about 800 AU from the star666 For conversions between apparent and linear size scales we assume that Car’s distance is 2300 pc (Davidson & Humphreys, 1997). , their light is intrinsic emission with some reflection (Davidson et al., 1995). Fig. 5 shows the brightness of “Weigelt D,” measured in the same way as the star but centering the virtual aperture at offset location , position angle 336∘. The absence of a strong secular trend is significant in the following way. Extrapolating the recent trend of the star/ejecta brightness ratio back to the mid-1980’s, one would expect that the star should have been fainter than each of the Weigelt blobs at that time. But this is contradicted by early speckle observations (Weigelt & Ebersberger, 1986; Hofmann & Weigelt, 1988); therefore the star cannot have brightened at the present-day rate through the entire 20-year interval. Moreover, the earliest HST/FOS spectroscopy in 1991 (Davidson et al., 1995) and the ultraviolet spectra of the star plus inner ejecta obtained with the International Ultraviolet Explorer (IUE) from 1979 to 1990 show absolute fluxes which, though uncertain, appear comparable to both the speckle observations and the 1998 STIS results. These facts imply that the central star’s brightening rate was relatively modest from 1980 until sometime in the 1990’s. We suspect that the present-day rate began in 1994–97, when ground-based photometry showed unusual behavior (see, e.g., Fig. 2 in Davidson et al. (1999b)).
5 Discussion
The observed brightening of Car is not easy to explain. It cannot signify a major increase in the star’s luminosity, because that would exceed the Eddington limit, producing a giant eruption. It cannot be a standard LBV-like eruption; in that case the energy distribution should have shifted to longer wavelengths, the Balmer emission lines should have decreased, and the spectrum should have begun to resemble an A- or F-type supergiant (Humphreys & Davidson, 1994). In fact, qualitatively the star’s spectrum has changed little in the past decade, and it has become bluer, not redder.777 The change in color is modest, however, too small to confidently quote here. Dust near Car has long been known to have an abnormally small reddening/extinction ratio, see Davidson & Humphreys (1997), Davidson et al. (1995), and refs. cited therein.
The most obvious remaining explanation involves a change in the circumstellar extinction, which, in turn, probably requires a subtle change in the stellar wind. Mere “clearing of the dust” – i.e., motion of a localized concentration of dusty ejecta – cannot occur fast enough (Davidson et al., 1999b). Therefore one must consider either destruction of dust grains, or a decrease in the formation of new dust, or both; and, if these account for the observations, why should they happen now?
5.1 Dust Near the Star
The hypothetical decreasing extinction probably occurs within 2000 AU ( 1″) of the star, and preferably closer, because:
-
1.
In various observations between 1980 and 1995, the star did not appear as bright as expected relative to the Weigelt blobs; the discrepancy was a factor of the order of 10, based on simple theoretical arguments (Davidson & Humphreys, 1986; Davidson et al., 1995). Evidently, then, our line of sight to the star had substantially larger extinction at visual wavelengths, even though its projected separation from the blobs was less than 0.3″. The required extra extinction was of the order of 3 magnitudes. Since then the star has brightened far more than the Weigelt objects have; therefore, if this involves localized extinction, its size scale must be a fraction of an arcsec, only a few hundred AU.
-
2.
No known process seems likely to destroy dust more than 2000 AU from the star in a timescale of only a few years.
- 3.
Dust grains should condense in Car’s wind at a distance of 200–600 AU, 2 to 10 years after the material has been ejected.888 Here, lacking a specific dust-formation model for the unusual case of Car, we suppose that appreciable grain condensation begins in the outward flowing material at the location where the equilibrium grain temperature is around 1000 K. This is a fairly conventional assumption and the precise choice of temperature has little effect on our reasoning. The quoted time-after-ejection assumes typical ejecta speeds of 200–700 km s-1. Since newly-formed dust moves outward in a timescale of several years, the circumstellar extinction seen at any time depends partly on the current dust formation rate. This, in turn, depends on local wind density, radiation density, etc., and newly formed hot grains ( K) are susceptible to destruction. The dust column density can thus be sensitive to small changes in the stellar parameters. Moreover, the wind is latitude-dependent and our line of sight is close to the critical latitude where wind parameters can vary rapidly (Smith et al., 2003). All these factors appear suitable for the proposed explanation.
On the other hand, near-infrared observations imply that extinction within AU has been quite small along most paths outward from the star. In Fig. 3 of Cox et al. (1995), for instance, the 2–6 m flux indicates the high end of the dust temperature distribution. Modeling this in a conventional way, we find that less than 5% of the total luminosity was absorbed and re-emitted by inner dust with K during the years 1973 to 1990 when those observations were made.999 The measured flux was approximately a power law at wavelengths around 4 m. Assuming a typical emission efficiency dependence , the observed spectral slope can be explained by a grain temperature distribution . The result noted in the text is obtained by normalizing this to match the observed flux around 4 or 5 m and then integrating the total emitted flux at all wavelengths due to grains above 500 K. Therefore, our line of sight must be abnormal in order to have a large amount of extinction near the star. In principle one might view this as an argument against our proposed scenario, but no plausible alternative has been suggested to explain the apparent faintness of the central star before 1999 and its ratio to the Weigelt blobs (Weigelt & Ebersberger, 1986; Davidson & Humphreys, 1986; Hofmann & Weigelt, 1988; Davidson et al., 1995, 1999b),
The spatial distribution of dust is probably quite inhomogeneous near the star. The Homunculus lobes have a conspicuously “granular” appearance; the equatorial ejecta are clumpy, including the Weigelt knots; and stars near and above the Eddington limit tend to produce clumpy outflows (Shaviv, 2005). Consequently the radiative transfer problem includes macroscopic effects which have not yet been modeled. If the grain albedo is sufficient, light may escape mainly by scattering through interstices between condensations. In that case, high-extinction lines of sight may be fairly common in the inner region even though most of the light escapes along other paths, not necessarily radial.
Incidentally, the near-infrared photometric trends reported by Whitelock et al. (1994, 2004) are not straightforward to interpret. The fairly-constant 3.5 m flux, for instance, represents a complicated mixture of dust formation parameters and does not necessarily indicate a constant amount of dust; see comments by Davidson et al. (1999b).
5.2 The Role of the Stellar Parameters
If the observed brightening represents a decrease in circumstellar extinction, the likeliest reason for this to occur is through some change in the star – no one has yet proposed a suitable alternative. The most relevant stellar parameters are the radius, current luminosity, and surface rotation rate, which together determine the wind’s velocity, density, and latitude structure. All of these may still be changing today, 160 years after the Great Eruption; thermal and rotational equilibrium in particular are likely to be poor assumptions for the star’s internal structure (Smith et al., 2003; Davidson, 2005).
As a working hypothesis to explain Car’s photometric and spectroscopic record in the past 100 years, let us tentatively suppose that the mass-loss rate is gradually decreasing, while the surface rotation rate may be increasing. Historical considerations include:
-
1.
High-excitation He I emission, now observed at most times, was consistently absent before 1920 (Feast et al., 2001) and probably before 1940 (Humphreys & Koppelman, 2005). If a hot companion star is present as most authors suppose, then the most obvious way to hide or suppress its helium ionization is to immerse the entire system in an extremely dense wind – i.e., the primary star’s mass-loss rate must have been larger then. This idea is far from straightforward (Davidson, 1999), but so far as we know it is the only qualitative explanation yet proposed. Informally, based on Zanstra-style arguments (i.e., assessing the volume emission measure needed to absorb all the photons above 25 eV), we estimate that a rate of the order of 10 times the present value, i.e. y-1, would have been required early in the twentieth century in order to suppress the helium recombination emission.
-
2.
Twenty years ago the amount of fresh dust, indicated by the near-infrared flux, appeared consistent with a mass-loss rate somewhat above yr-1 (Davidson et al., 1986). This absorbed only a small fraction of the luminosity (Section 5.1 above), but the substantially higher mass-loss rate suspected for earlier times would have produced enough hot inner dust to absorb a non-negligible fraction.
-
3.
The brightness observed between 1900 and 1940 is rather mysterious. Judging from its mass and present-day optical thickness, around 1920 the Homunculus (then only half as large as it is today) should have had at least 5 magnitudes of visual-wavelength extinction; in a simple model the object should have been fainter than 10th magnitude instead of as was observed. No doubt the inhomogeneities mentioned earlier played a role, but no model has been calculated. Moreover, why did the brightness remain fairly constant even though the Homunculus expanded by about 70% in 1900–1940? This interesting problem has received practically no theoretical attention.
-
4.
He I emission first appeared, and Car’s brightness suddenly increased, between 1938 and 1953 as we mentioned in Section 1. This might conceivably be explained by a decrease in the wind density; but Davidson (2005) and Davidson et al. (2005) have conjectured that 1940–1950 may have been the time when rotation became fast enough to produce latitude structure in the wind. If so, a higher-excitation, lower-density zone then developed at low latitudes (Smith et al., 2003).
The above points inspire two hypotheses that may explain the rapid brightening trend shown in Fig. 4. First, if the mass-loss rate has been decreasing, this tends to reduce the column density of recently-formed dust along our line of sight. Meanwhile (or alternatively), perhaps the wind’s latitude structure is continuing to evolve so that its dense zone is now moving out of the line of sight. HST data suggest that our line of sight has been fairly close to the critical boundary latitude separating the two phases (Smith et al., 2003). A small increase in surface rotation rate, or some other parameter change, might conceivably move the dense zone to higher latitudes, decreasing the amount of dust that forms along our line of sight. This idea is appealing because it suggests a way in which the effective extinction may be very sensitive to the stellar parameters.
This problem obviously requires detailed models far beyond the scope of this paper, combining the star’s changing structure, its wind, dust formation, and possibly dust destruction.
5.3 Concerning the 5.5-year Cycle
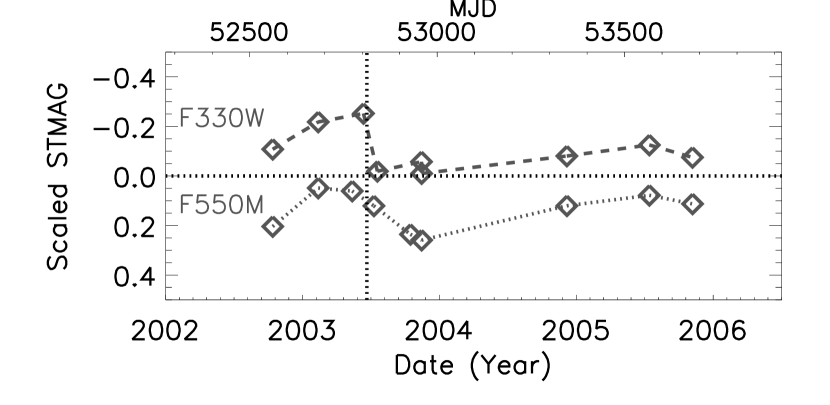
Figs. 4 and 6 reveal no major surprises about the 2003.5 spectroscopic event, but several comments are worthwhile. First, the sharp drop in UV brightness (filters F220W and F250W) is qualitatively understood and does not involve circumstellar dust. During both the 1998 and the 2003 events, STIS data showed very heavy ultraviolet blanketing by ionized metal lines; indeed the star became quite dark at some wavelengths between 2000 and 3000 Å (Gull et al., 2000). We further note that just before the spectroscopic event, a slight increase occurred at wavelengths below 4000 Å (filters F220W, F250W, F330W), but not at visual and far-red wavelengths (F550M and F25ND3). Ground-based visual-wavelength and near-IR photometry showed a qualitatively similar effect (van Genderen, et al., 2003; Whitelock et al., 2004; Fernandez Lajus et al., 2003). The brightening is particularly prominent in J, H, and K which are dominated by free-free emission (Whitelock et al., 2004). The ACS F550M and STIS F25ND3 data primarily measure the continuum brightness, while the other HST filters are heavily influenced by strong emission or absorption lines. At about the same time He I emission in the central star also went through a similar increase in brightness (Martin, 2005). The minor pre-event brightening thus appears to represent an increase in some emission features implying a temporary increase in ionizing flux. The primary star may provide additional UV photons or the hypothetical hot companion star may excite the primary wind more than usual at that time (just before periastron), but no quantitative model has been attempted.
Figs. 4 and 6 contain interesting hints about the timescale for the star’s post-event recovery. Four months after the 2003.5 event, for instance, the 2–10 keV X-ray flux had increased almost to a normal level (Corcoran, 2005). The HST/ACS F220W and F250W brightnesses, however, were still quite low at that time, and they required about eight months to recover. This timescale must be explained in any valid model for the spectroscopic events.
Davidson et al. (2005) noted serious differences between STIS spectra of the 1998.0 and 2003.5 events, and interpreted them as evidence for a rapid secular physical change in Car. Damineli et al. (1999) had earlier found that He I emission became progressively weaker after each of the last few spectroscopic events. These clues are obviously pertinent to our comments in Section 5.2 above.
Fluctuations between spectroscopic events have received little attention in the past. For instance, Fig. 4 shows a brief 0.2-magnitude brightening at 2001.3; measured by the STIS in both imaging and spectroscopic mode. It was correlated with the behavior of a strange unidentified emission line near 6307 Å, and with other subtle changes in the spectrum (Martin et al., 2006). This is interesting because mid-cycle events have not been predicted in any of the competing scenarios for the 5.5-year cycle. Perhaps the effects seen in 2001 indicate the level of basic, LBV-like fluctuations in Car.
5.4 Eta Carinae in the Near Future
The appearance of Car and the Homunculus nebula has changed dramatically. Twenty years ago the entire object could have been described as “a bright, compact nebula having an indistinct eighth-magnitude central core;” but a few years in the future, if recent trends continue, it will be seen instead as “a fifth- or even fourth-magnitude star accompanied by some visible nebulosity.” Meanwhile the color is gradually becoming bluer. This overall development has long been expected (Davidson, 1987), but now appears to be occurring 20 years ahead of schedule. If it signals an irregularity in the star’s recovery from the Great Eruption, then this may be a highly unusual clue to the highly abnormal internal structure. Unsteady diffusion of either the thermal or the rotational parameters would be significant for stellar astrophysics in general.
There are several practical implications for future observations of this object. Valid ground-based spectroscopy of the star (strictly speaking its wind) is becoming feasible for the first time, as its increased brightness overwhelms the emission-line contamination by inner ejecta. Unfortunately this implies that the inner ejecta – particularly the mysterious Weigelt knots – are becoming difficult to observe. In fact, since the HST/STIS is no longer available, they are now practically impossible to observe. When some new high-spatial-resolution spectrograph becomes available in the future, the inner ejecta will probably be much fainter than the star.
The expected future of the larger-scale Homunculus nebula is also interesting. At present it is essentially a reflection nebula. However, based on the presence of high-excitation emission lines such as [Ne III] close to the star, the system almost certainly contains a source of hydrogen-ionizing photons with energies above 13.6, and helium-ionizing photons above 25 eV. (See, e.g., Zanella et al. (1984); most recent authors assume that this source is a hot companion star.) Eventually, when circumstellar extinction has decreased sufficiently due to expansion and other effects, the UV source will begin to photoionize the Homunculus. This is especially true if the primary stellar wind is weakening as we conjectured above. First the inner “Little Homunculus” will become a bright compact H II region, and then the bipolar Homunculus lobes. The time when that will occur is not obvious, but it may be within the next few decades if current trends continue.
6 Acknowledgments
This research was conducted as part of the HST Treasury Project on Carinae via grant no. GO-9973 from the Space Telescope Science Institute. We are grateful to T.R. Gull and Beth Perriello for assisting with the HST observing plans. We also especially thank Roberta Humphreys, J.T. Olds, and Matt Gray at the University of Minnesota for discussions and helping with non-routine steps in the data preparation and analysis.
References
- Altamore et al. (1986) Altamore, A., Baratta, G. B., Cassatella, A., Rossi, L., & Viotti, R. 1986, New Insights in Astrophysics: Eight Years of UV Astronomy with IUE, 303
- Cassatella, Giangrande, & Viotti (1979) Cassatella, A., Giangrande, A., & Viotti, R. 1979, A&A, 71, L9
- Clampin et al. (1996) Clampin, M., Hartig, G., Baum, S., Kraemer, S. Kinney, E. Kutina, R., Pitts, R., & Balzano, V. 1996, STIS Instrument Science Report 96-030, (Baltimore: STSci)
- Corcoran (2005) Corcoran, M. F. 2005, AJ, 129, 2018
- Cox et al. (1995) Cox, P., Mezger, P. G., Sievers, A., Najarro, F., Bronfman, L., Kreysa, E., & Haslam, G. 1995, A&A, 297, 168
- Damineli (1996) Damineli, A. 1996, ApJ, 460, L49
- Damineli et al. (1999) Damineli, A., Stahl, O., Wolf, B., Kaufer, A., & Jablonski, F. J. 1999, ASP Conf. Ser. 179: Eta Carinae at The Millennium, 179, 221
- Davidson (1987) Davidson, K. 1987, ASSL Vol. 136: Instabilities in Luminous Early Type Stars, 127
- Davidson (1999) Davidson, K. 1999, ASP Conf. Ser. 179: Eta Carinae at The Millennium, 179, 304
- Davidson (2004) Davidson, K. 2004, STScI Newsletter, Spring 2004, 1
- Davidson (2005) Davidson, K. 2005, ASP Conf. Ser. 332: The Fate of the Most Massive Stars, 332, 103
- Davidson et al. (1986) Davidson, K., Dufour, R. J., Walborn, N. R., & Gull, T. R. 1986, ApJ, 305, 867
- Davidson et al. (1995) Davidson, K., Ebbets, D., Weigelt, G., Humphreys, R. M., Hajian, A. R., Walborn, N. R., & Rosa, M. 1995, AJ, 109, 1784
- Davidson & Humphreys (1986) Davidson, K., & Humphreys, R. M. 1986, A&A, 164, L7
- Davidson et al. (1995) Davidson, K., Ebbets, D., Weigelt, G., Humphreys, R. M., Hajian, A. R., Walborn, N. R., & Rosa, M. 1995, AJ, 109, 1784
- Davidson & Humphreys (1997) Davidson, K., & Humphreys, R. M. 1997, ARA&A, 35, 1
- Davidson et al. (1999a) Davidson, K., Humphreys, R. M., Ishibashi, K., Gull, T. R., Hamuy, M., Berdnikov, L., & Whitelock, P. 1999a, IAU Circ., 7146, 1
- Davidson et al. (1999b) Davidson, K., Gull, T. R., Humphreys, R. M., Ishibashi, K., Whitelock, P., Berdnikov, L., McGregor, P. J., Metcalfe, T. S., Polomski, E., & Hamuy, M. 1999b, AJ, 118, 1777
- Davidson et al. (1999c) Davidson, K., Ishibashi, K., Gull, T. R., & Humphreys, R. M. 1999c, ASP Conf. Ser. 179: Eta Carinae at The Millennium, 179, 227
- Davidson et al. (2005) Davidson, K., Martin, J., Humphreys, R. M., Ishibashi, K., Gull, T. R., Stahl, O., Weis, K., Hillier, D. J., Damineli, A., Corcoran, M., & Hamann, F. 2005, AJ, 129, 900
- Davidson & Ruiz (1975) Davidson, K., & Ruiz, M.-T. 1975, ApJ, 202, 421
- de Vaucouleurs & Eggen (1952) de Vaucouleurs, G., & Eggen, O. J. 1952, PASP, 64, 185
- Downes et al. (1997) Downes, R., Clampin, M., Shaw, R., Baum, S., Kinney, E. & McGrath, M. 1997,STIS Instrument Science Report 97-03B, (Baltimore: STSci)
- Feast et al. (2001) Feast, M., Whitelock, P., & Marang, F. 2001, MNRAS, 322, 741
- Feinstein & Marraco (1974) Feinstein, A., & Marraco, H. G. 1974, A&A, 30, 271
- Feinstein (1967) Feinstein, A. 1967, The Observatory, 87, 287
- Fernandez Lajus et al. (2003) Fernandez Lajus, E., Gamen, R., Schwartz, M., Salerno, N., Llinares, C., Farina, C., Amorín, R., & Niemela, V. 2003, Informational Bulletin on Variable Stars, 5477, 1 101010http://lilen.fcaglp.unlp.edu.ar/EtaCar/
- Frew (2005) Frew, D. J. 2005, ASP Conf. Ser. 332: The Fate of the Most Massive Stars, 332, 158
- Gaviola (1950) Gaviola, E. 1950, ApJ, 111, 408
- Gaviola (1953) Gaviola, E. 1953, ApJ, 118, 234
- Gehrz & Ney (1972) Gehrz, R.D., & Ney, E.P. 1972, Sky & Tel., 44, 4
- Gonzaga et al. (2001) Gonzaga, S., et al. 2005,ACS Instrument Handbook, Version 6.0 (Baltimore: STScI)
- Gull et al. (2000) Gull, T. R., Davidson, K., & Ishibashi, K. 2000, American Institute of Physics Conference Series, 522, 439
- Hofmann & Weigelt (1988) Hofmann, K.-H., & Weigelt, G. 1988, A&A, 203, L21
- Humphreys & Davidson (1994) Humphreys, R. M., & Davidson, K. 1994, PASP, 106, 1025
- Humphreys & Koppelman (2005) Humphreys, R. M., & Koppelman, M. 2005, ASP Conf. Ser. 332: The Fate of the Most Massive Stars, 332, 159
- Kim Quijano et al. (2003) Kim Quijano, J., et al. 2003, STIS Instrument Handbook, Version 7.0 (Baltimore: STScI)
- Koornneef et al. (1986) Koornneef, J., Bohlin, R., Buser, R., Horne, K., & Turnshek, D. 1986, Highlights of Astronomy, 7, 833
- Mattei & Foster (1998) Mattei, J. & Foster, G. 1998, IAPPP Comm., 72, 53
- Martin & Koppelman (2004) Martin, J. C., & Koppelman, M. D. 2004, AJ, 127, 2352
- Martin (2005) Martin, J. C. 2005, ASP Conf. Ser. 332: The Fate of the Most Massive Stars, 332, 111
- Martin et al. (2006a) Martin, J. C., Davidson, K., Humphreys, R. M., Hillier, D. J., & Ishibashi, K. 2006a, ApJ, 640, 474
- Martin et al. (2006) Martin, J. C., Davidson, K., Hamann, F., Stahl, O., & Weis, K. 2006, PASP, 118, 697
- O’Connell (1956) O’Connell, D. J. K. 1956, Vistas in Astronomy, 2, 1165
- Shaviv (2005) Shaviv, N. J. 2005, ASP Conf. Ser. 332: The Fate of the Most Massive Stars, 332, 180
- Sirianni et al. (2005) Sirianni, M., et al. 2005, PASP, 117, 1049
- Smith et al. (2003) Smith, N., Davidson, K., Gull, T. R., Ishibashi, K., & Hillier, D. J. 2003, ApJ, 586, 432
- Sterken et al. (1999) Sterken, C., Freyhammer, L., Arentoft, T., & van Genderen, A. M. 1999, A&A, 346, L33
- Sterken et al. (2001) Sterken, C., et al. 2001, ASP Conf. Ser. 233: P Cygni 2000: 400 Years of Progress, 233, 71
- Thackeray (1953) Thackeray, A. D. 1953, MNRAS, 113, 237
- van Genderen & Thé (1984) van Genderen, A. M., & Thé, P. S. 1984, Space Sci. Rev., 39, 317
- van Genderen et al. (1999) van Genderen, A. M., Sterken, C., de Groot, M., & Burki, G. 1999, A&A, 343, 847
- van Genderen, et al. (2003) van Genderen, A. M., Sterken, C., & Allen, W. H. 2003, A&A, 405, 1057
- Viotti et al. (1989) Viotti, R., Rossi, L., Cassatella, A., Altamore, A., & Baratta, G. B. 1989, ApJS, 71, 983
- Weigelt & Ebersberger (1986) Weigelt, G., & Ebersberger, J. 1986, A&A, 163, L5
- Whitelock et al. (1994) Whitelock, P. A., Feast, M. W., Koen, C., Roberts, G., & Carter, B. S. 1994, MNRAS, 270, 364
- Whitelock et al. (2004) Whitelock, P. A., Feast, M. W., Marang, F., & Breedt, E. 2004, MNRAS, 352, 447
- Zanella et al. (1984) Zanella, R., Wolf, B., & Stahl, O. 1984, A&A, 137, 79

| Dataset | MJD | Year | FluxccBrightness measured in F25ND3 filter given as STIS flux units (erg/cm2/s/Å). | MagnitudeaaRelative STIS magnitude in the F25ND3 filter zeroed on 1999.140 | AveragebbThe average and sigma of individual measurements within one day of each other. These values are plotted in Fig. 4. | bbThe average and sigma of individual measurements within one day of each other. These values are plotted in Fig. 4. | |
|---|---|---|---|---|---|---|---|
| o8ma93xjq | 53070.199 | 2004.177 | 9.753E-12 | -0.56 | -0.54 | 0.02 | |
| o8ma93hjq | 53071.230 | 2004.180 | 9.403E-12 | -0.52 |
| F220W | F250W | F330W | F550M | |
|---|---|---|---|---|
| ACS/HRC Aperture CorrectionaaRatio of the ACS/HRC of flux observed in 0.3 weighted aperture to flux with an infinite aperture. | 0.5930.014 | 0.5940.013 | 0.6250.001 | 0.6190.022 |
| ACS/HRC Effective BandwidthbbÅ, includes the ACS/HRC CCD response. | 187.29 | 239.41 | 173.75 | 165.20 |
| STIS Throughput CorrectionccThe ratio of expected throughput for the aperture used to measure the ACS/HRC photometry to the actual integrated throughput of the STIS slit in the same filter. | 1.6318 | 1.2903 | 0.6003 | 0.5601 |
| Exp Time | Flux | |||||
|---|---|---|---|---|---|---|
| Dataset | MJD | Year | (sec) | DensityccSTMAG flux units are 10-11 erg/cm2/s/Å. | MagnitudeaaMagnitude on the STMAG system. These aperture corrections given in Table 2 are applied to these magnitudes. | AveragebbThe average and sigma of individual measurements in a set of exposures taken within a day of each other. |
| HRC/F220W Filter | ||||||
| j8ma7ac7q | 53345.391 | 2004.931 | 5.0 | 0.392 | 7.417 | 7.4100.017 |
| j8ma7acbq | 53345.395 | 2004.931 | 5.0 | 0.391 | 7.418 | |
| j8ma7acfq | 53345.398 | 2004.931 | 5.0 | 0.389 | 7.424 | |
| j8ma7acrq | 53345.434 | 2004.931 | 5.0 | 0.405 | 7.382 | |
| j8ma8aorq | 53565.266 | 2005.534 | 5.0 | 0.462 | 7.239 | 7.2280.011 |
| j8ma8ap4q | 53565.301 | 2005.534 | 5.0 | 0.472 | 7.216 | |
| j8ma9aetq | 53680.328 | 2005.849 | 5.0 | 0.467 | 7.226 | 7.2300.006 |
| j8ma9af1q | 53680.344 | 2005.849 | 5.0 | 0.462 | 7.239 | |
| j8ma9afaq | 53680.355 | 2005.849 | 5.0 | 0.465 | 7.231 | |
| j8ma9afnq | 53680.371 | 2005.849 | 5.0 | 0.468 | 7.225 | |
| j9p602req | 53951.121 | 2006.591 | 4.0 | 0.496 | 7.162 | 7.1660.002 |
| j9p602rhq | 53951.125 | 2006.591 | 4.0 | 0.493 | 7.169 | |
| j9p602rkq | 53951.125 | 2006.591 | 4.0 | 0.494 | 7.165 | |
| j9p602rnq | 53951.129 | 2006.591 | 4.0 | 0.493 | 7.168 | |
| HRC/F250W Filter | ||||||
| j8ma7ac8q | 53345.391 | 2004.931 | 1.4 | 0.939 | 6.469 | 6.4630.016 |
| j8ma7accq | 53345.395 | 2004.931 | 1.4 | 0.941 | 6.466 | |
| j8ma7achq | 53345.402 | 2004.931 | 1.4 | 0.928 | 6.481 | |
| j8ma7actq | 53345.438 | 2004.931 | 1.4 | 0.967 | 6.437 | |
| j8ma8aouq | 53565.273 | 2005.534 | 1.4 | 1.029 | 6.369 | 6.3530.016 |
| j8ma8ap7q | 53565.309 | 2005.534 | 1.4 | 1.060 | 6.337 | |
| j8ma9aewq | 53680.336 | 2005.849 | 1.4 | 1.126 | 6.271 | 6.2700.007 |
| j8ma9af5q | 53680.348 | 2005.849 | 1.4 | 1.119 | 6.277 | |
| j8ma9afqq | 53680.348 | 2005.849 | 1.4 | 1.137 | 6.261 | |
| j9p601qnq | 53951.051 | 2006.591 | 1.0 | 1.261 | 6.148 | 6.1490.003 |
| j9p601qqq | 53951.055 | 2006.591 | 1.0 | 1.264 | 6.145 | |
| j9p601qtq | 53951.059 | 2006.591 | 1.0 | 1.258 | 6.151 | |
| j9p601qwq | 53951.063 | 2006.591 | 1.0 | 1.256 | 6.152 | |
| HRC/F330W Filter | ||||||
| j8ma7ac9q | 53345.391 | 2004.931 | 0.8 | 1.150 | 6.248 | 6.2430.019 |
| j8ma7acdq | 53345.395 | 2004.931 | 0.8 | 1.140 | 6.258 | |
| j8ma7aclq | 53345.406 | 2004.931 | 0.8 | 1.142 | 6.256 | |
| j8ma7acxq | 53345.441 | 2004.931 | 0.8 | 1.190 | 6.211 | |
| j8ma8aoyq | 53565.277 | 2005.534 | 0.8 | 1.190 | 6.211 | 6.2010.011 |
| j8ma8apbq | 53565.313 | 2005.534 | 0.8 | 1.213 | 6.190 | |
| j8ma9aezq | 53680.340 | 2005.849 | 0.8 | 1.440 | 6.004 | 6.0020.004 |
| j8ma9af8q | 53680.352 | 2005.849 | 0.8 | 1.440 | 6.004 | |
| j8ma9afhq | 53680.367 | 2005.849 | 0.8 | 1.441 | 6.003 | |
| j8ma9afuq | 53680.383 | 2005.849 | 0.8 | 1.452 | 5.995 | |
| j9p601qxq | 53951.066 | 2006.591 | 0.2 | 1.671 | 5.843 | 5.8500.010 |
| j9p601qzq | 53951.066 | 2006.591 | 0.2 | 1.688 | 5.831 | |
| j9p601r0q | 53951.066 | 2006.591 | 0.2 | 1.666 | 5.846 | |
| j9p602roq | 53951.129 | 2006.591 | 0.3 | 1.638 | 5.864 | |
| j9p602rpq | 53951.133 | 2006.591 | 0.3 | 1.656 | 5.852 | |
| j9p602rqq | 53951.133 | 2006.591 | 0.3 | 1.643 | 5.861 | |
| j9p602rrq | 53951.133 | 2006.591 | 0.3 | 1.653 | 5.854 | |
| HRC/F550M Filter | ||||||
| j8ma7acaq | 53345.395 | 2004.931 | 0.1 | 1.337 | 6.084 | 6.0850.016 |
| j8ma7aceq | 53345.398 | 2004.931 | 0.1 | 1.324 | 6.095 | |
| j8ma7acoq | 53345.410 | 2004.931 | 0.1 | 1.318 | 6.100 | |
| j8ma7ad0q | 53345.445 | 2004.931 | 0.1 | 1.370 | 6.059 | |
| j8ma8ap1q | 53565.281 | 2005.534 | 0.1 | 1.342 | 6.081 | 6.0770.004 |
| j8ma8apeq | 53565.281 | 2005.534 | 0.1 | 1.351 | 6.073 | |
| j8ma9af0q | 53680.340 | 2005.849 | 0.1 | 1.589 | 5.897 | 5.8910.009 |
| j8ma9af9q | 53680.355 | 2005.849 | 0.1 | 1.582 | 5.902 | |
| j8ma9afkq | 53680.371 | 2005.849 | 0.1 | 1.606 | 5.886 | |
| j8ma9afxq | 53680.387 | 2005.849 | 0.1 | 1.614 | 5.880 | |
| j9p602ryq | 53951.145 | 2006.591 | 0.1 | 1.812 | 5.755 | 5.7570.005 |
| j9p602s0q | 53951.145 | 2006.591 | 0.1 | 1.798 | 5.763 | |
| j9p602s2q | 53951.145 | 2006.591 | 0.1 | 1.819 | 5.750 | |
| j9p602s4q | 53951.148 | 2006.591 | 0.1 | 1.801 | 5.761 | |
| Root | Slit Angle | Central | Exp Length | ||
|---|---|---|---|---|---|
| Name | MJD | (deg)aaThe slit angle is measured from north through east. All slits are peaked up on the central star. The 52″x 0.1″slit was used for all these observations. | Grating | (Å) | (sec) |
| o4j8010y0 | 50891.6 | -28 | G230MB | 1854 | 456.0 |
| o4j8010o0 | 50891.6 | -28 | G230MB | 1995 | 360.0 |
| o4j8011b0 | 50891.7 | -28 | G230MB | 2135 | 180.0 |
| o4j8011c0 | 50891.7 | -28 | G230MB | 2276 | 180.0 |
| o4j8011a0 | 50891.7 | -28 | G230MB | 2416 | 240.0 |
| o4j801040 | 50891.4 | -28 | G230MB | 2557 | 300.0 |
| o4j8010e0 | 50891.5 | -28 | G230MB | 2697 | 290.0 |
| o4j801050 | 50891.4 | -28 | G230MB | 2836 | 330.0 |
| o4j8010f0 | 50891.5 | -28 | G230MB | 2976 | 348.0 |
| o4j8010g0 | 50891.5 | -28 | G230MB | 3115 | 336.0 |
| o4j8010h0 | 50891.5 | -28 | G430M | 3165 | 144.0 |
| o4j801170 | 50891.7 | -28 | G430M | 3423 | 60.0 |
| o4j801180 | 50891.7 | -28 | G430M | 3680 | 72.0 |
| o4j8010z0 | 50891.6 | -28 | G430M | 3936 | 72.0 |
| o4j801060 | 50891.4 | -28 | G430M | 4194 | 36.0 |
| o4j8010x0 | 50891.6 | -28 | G430M | 4961 | 36.0 |
| o4j8010i0 | 50891.5 | -28 | G430M | 5216 | 36.0 |
| o4j801190 | 50891.7 | -28 | G430M | 5471 | 36.0 |
| o4j8010d0 | 50891.5 | -28 | G750M | 5734 | 15.0 |
| o4j801120 | 50891.7 | -28 | G750M | 6252 | 9.4 |
| o556020t0 | 51230.6 | -28 | G230MB | 1854 | 380.0 |
| o556020k0 | 51230.5 | -28 | G230MB | 1995 | 278.0 |
| o55602110 | 51230.7 | -28 | G230MB | 2135 | 150.0 |
| o55602120 | 51230.7 | -28 | G230MB | 2276 | 150.0 |
| o55602100 | 51230.7 | -28 | G230MB | 2416 | 200.0 |
| o556020b0 | 51230.5 | -28 | G230MB | 2557 | 300.0 |
| o556020e0 | 51230.5 | -28 | G230MB | 2697 | 280.0 |
| o55602040 | 51230.5 | -28 | G230MB | 2836 | 307.0 |
| o556020z0 | 51230.6 | -28 | G230MB | 2976 | 360.0 |
| o556020c0 | 51230.5 | -28 | G230MB | 3115 | 280.0 |
| o556020v0 | 51230.6 | -28 | G430M | 3165 | 120.0 |
| o556020f0 | 51230.5 | -28 | G430M | 3423 | 50.0 |
| o556020d0 | 51230.5 | -28 | G430M | 3680 | 60.0 |
| o556020s0 | 51230.6 | -28 | G430M | 3936 | 60.0 |
| o556020y0 | 51230.6 | -28 | G430M | 4961 | 30.0 |
| o556020g0 | 51230.5 | -28 | G430M | 5216 | 30.0 |
| o556020w0 | 51230.6 | -28 | G430M | 5471 | 30.0 |
| o55602090 | 51230.5 | -28 | G750M | 5734 | 15.0 |
| o556020p0 | 51230.6 | -28 | G750M | 6252 | 8.0 |
| o62r010p0 | 52016.9 | 22 | G230MB | 1854 | 340.0 |
| o62r010i0 | 52016.8 | 22 | G230MB | 1995 | 300.0 |
| o62r010m0 | 52016.8 | 22 | G230MB | 2135 | 280.0 |
| o62r010x0 | 52016.9 | 22 | G230MB | 2276 | 300.0 |
| o62r010y0 | 52016.9 | 22 | G230MB | 2416 | 200.0 |
| o62r010a0 | 52016.8 | 22 | G230MB | 2557 | 420.0 |
| o62r010c0 | 52016.8 | 22 | G230MB | 2697 | 280.0 |
| o62r01040 | 52016.8 | 22 | G230MB | 2836 | 300.0 |
| o62r010t0 | 52016.9 | 22 | G230MB | 2976 | 360.0 |
| o62r01080 | 52016.8 | 22 | G230MB | 3115 | 350.0 |
| o62r010r0 | 52016.9 | 22 | G430M | 3165 | 100.0 |
| o62r010d0 | 52016.8 | 22 | G430M | 3423 | 70.0 |
| o62r010b0 | 52016.8 | 22 | G430M | 3680 | 60.0 |
| o62r010o0 | 52016.8 | 22 | G430M | 3936 | 32.0 |
| o62r01030 | 52016.7 | 22 | G430M | 4194 | 30.0 |
| o62r010v0 | 52016.9 | 22 | G430M | 4961 | 36.0 |
| o62r010e0 | 52016.8 | 22 | G430M | 5216 | 14.0 |
| o62r010s0 | 52016.9 | 22 | G430M | 5471 | 30.0 |
| o62r01090 | 52016.8 | 22 | G750M | 5734 | 8.0 |
| o62r010l0 | 52016.8 | 22 | G750M | 6252 | 10.0 |
| o6ex030e0 | 52183.2 | 165 | G430M | 4961 | 36.0 |
| o6ex030c0 | 52183.1 | 165 | G430M | 5216 | 36.0 |
| o6ex030b0 | 52183.1 | 165 | G750M | 5734 | 15.0 |
| o6ex02080 | 52294.0 | -82 | G230MB | 1854 | 800.0 |
| o6ex020i0 | 52294.1 | -82 | G230MB | 1995 | 600.0 |
| o6ex020m0 | 52294.1 | -82 | G230MB | 2135 | 600.0 |
| o6ex020x0 | 52294.2 | -82 | G230MB | 2276 | 600.0 |
| o6ex020y0 | 52294.2 | -82 | G230MB | 2416 | 320.0 |
| o6ex020a0 | 52294.0 | -82 | G230MB | 2557 | 1200.0 |
| o6ex020c0 | 52294.1 | -82 | G230MB | 2697 | 280.0 |
| o6ex02040 | 52294.0 | -82 | G230MB | 2836 | 300.0 |
| o6ex020t0 | 52294.1 | -82 | G230MB | 2976 | 340.0 |
| o6ex020p0 | 52294.1 | -82 | G230MB | 3115 | 300.0 |
| o6ex020r0 | 52294.1 | -82 | G430M | 3165 | 90.0 |
| o6ex020d0 | 52294.1 | -82 | G430M | 3423 | 90.0 |
| o6ex020b0 | 52294.1 | -82 | G430M | 3680 | 52.0 |
| o6ex020o0 | 52294.1 | -82 | G430M | 3936 | 26.0 |
| o6ex02030 | 52294.0 | -82 | G430M | 4194 | 18.0 |
| o6ex020v0 | 52294.2 | -82 | G430M | 4961 | 36.0 |
| o6ex020e0 | 52294.1 | -82 | G430M | 5216 | 16.0 |
| o6ex020s0 | 52294.1 | -82 | G430M | 5471 | 34.0 |
| o6ex02090 | 52294.0 | -82 | G750M | 5734 | 6.0 |
| o6ex020l0 | 52294.1 | -82 | G750M | 6252 | 8.0 |
| o6mo020a0 | 52459.5 | 69 | G230MB | 1854 | 400.0 |
| o6mo020x0 | 52459.6 | 69 | G230MB | 1995 | 300.0 |
| o6mo02120 | 52459.6 | 69 | G230MB | 2135 | 300.0 |
| o6mo021n0 | 52459.7 | 69 | G230MB | 2276 | 300.0 |
| o6mo021e0 | 52459.7 | 69 | G230MB | 2416 | 320.0 |
| o6mo020h0 | 52459.6 | 69 | G230MB | 2557 | 400.0 |
| o6mo020m0 | 52459.6 | 69 | G230MB | 2697 | 340.0 |
| o6mo02050 | 52459.5 | 69 | G230MB | 2836 | 300.0 |
| o6mo021i0 | 52459.7 | 69 | G230MB | 2976 | 320.0 |
| o6mo02190 | 52459.7 | 69 | G230MB | 3115 | 300.0 |
| o6mo021r0 | 52459.7 | 69 | G430M | 3165 | 90.0 |
| o6mo020p0 | 52459.6 | 69 | G430M | 3423 | 90.0 |
| o6mo020l0 | 52459.6 | 69 | G430M | 3680 | 52.0 |
| o6mo021a0 | 52459.7 | 69 | G430M | 3936 | 26.0 |
| o6mo02060 | 52459.5 | 69 | G430M | 4194 | 18.0 |
| o6mo021m0 | 52459.7 | 69 | G430M | 4961 | 36.0 |
| o6mo020q0 | 52459.6 | 69 | G430M | 5216 | 16.0 |
| o6mo021h0 | 52459.7 | 69 | G430M | 5471 | 34.0 |
| o6mo020i0 | 52459.6 | 69 | G750M | 5734 | 9.0 |
| o6mo02150 | 52459.7 | 69 | G750M | 6252 | 8.0 |
| o8gm12060 | 52682.9 | -57 | G230MB | 1854 | 600.0 |
| o8gm120h0 | 52683.0 | -57 | G230MB | 1995 | 600.0 |
| o8gm120l0 | 52683.0 | -57 | G230MB | 2135 | 600.0 |
| o8gm120w0 | 52683.0 | -57 | G230MB | 2276 | 600.0 |
| o8gm120r0 | 52683.0 | -57 | G230MB | 2416 | 320.0 |
| o8gm12090 | 52682.9 | -57 | G230MB | 2557 | 800.0 |
| o8gm120c0 | 52682.9 | -57 | G230MB | 2697 | 340.0 |
| o8gm12030 | 52682.9 | -57 | G230MB | 2836 | 300.0 |
| o8gm120t0 | 52683.0 | -57 | G230MB | 2976 | 340.0 |
| o8gm120o0 | 52683.0 | -57 | G230MB | 3115 | 300.0 |
| o8gm120n0 | 52683.0 | -57 | G430M | 3165 | 90.0 |
| o8gm120d0 | 52682.9 | -57 | G430M | 3423 | 90.0 |
| o8gm120b0 | 52682.9 | -57 | G430M | 3680 | 52.0 |
| o8gm120p0 | 52683.0 | -57 | G430M | 3936 | 26.0 |
| o8gm12040 | 52682.9 | -57 | G430M | 4194 | 18.0 |
| o8gm120v0 | 52683.0 | -57 | G430M | 4961 | 36.0 |
| o8gm120e0 | 52682.9 | -57 | G430M | 5216 | 16.0 |
| o8gm120s0 | 52683.0 | -57 | G430M | 5471 | 34.0 |
| o8gm120a0 | 52682.9 | -57 | G750M | 5734 | 6.0 |
| o8gm12050 | 52682.9 | -57 | G750M | 6252 | 8.0 |
| o8gm210g0 | 52727.3 | -28 | G430M | 4961 | 16.0 |
| o8gm210e0 | 52727.3 | -28 | G430M | 5216 | 16.0 |
| o8gm210b0 | 52727.3 | -28 | G430M | 5471 | 34.0 |
| o8gm210d0 | 52727.3 | -28 | G750M | 5734 | 9.0 |
| o8gm410g0 | 52764.4 | 27 | G430M | 4961 | 16.0 |
| o8gm410e0 | 52764.4 | 27 | G430M | 5216 | 16.0 |
| o8gm410b0 | 52764.3 | 27 | G430M | 5471 | 34.0 |
| o8gm410d0 | 52764.3 | 27 | G750M | 5734 | 9.0 |
| o8gm320a0 | 52778.5 | 38 | G230MB | 1854 | 400.0 |
| o8gm320x0 | 52778.9 | 38 | G230MB | 1995 | 300.0 |
| o8gm33020 | 52776.4 | 38 | G230MB | 2135 | 300.0 |
| o8gm330n0 | 52776.6 | 38 | G230MB | 2276 | 300.0 |
| o8gm330e0 | 52776.5 | 38 | G230MB | 2416 | 320.0 |
| o8gm320h0 | 52778.6 | 38 | G230MB | 2557 | 400.0 |
| o8gm320m0 | 52778.7 | 38 | G230MB | 2697 | 340.0 |
| o8gm32050 | 52778.5 | 38 | G230MB | 2836 | 300.0 |
| o8gm330i0 | 52776.5 | 38 | G230MB | 2976 | 320.0 |
| o8gm33090 | 52776.5 | 38 | G230MB | 3115 | 300.0 |
| o8gm33060 | 52776.4 | 38 | G430M | 3165 | 90.0 |
| o8gm320p0 | 52778.8 | 38 | G430M | 3423 | 90.0 |
| o8gm320l0 | 52778.7 | 38 | G430M | 3680 | 52.0 |
| o8gm330a0 | 52776.5 | 38 | G430M | 3936 | 26.0 |
| o8gm32060 | 52778.5 | 38 | G430M | 4194 | 18.0 |
| o8gm330m0 | 52776.6 | 38 | G430M | 4961 | 36.0 |
| o8gm320q0 | 52778.8 | 38 | G430M | 5216 | 16.0 |
| o8gm330h0 | 52776.5 | 38 | G430M | 5471 | 34.0 |
| o8gm320i0 | 52778.6 | 38 | G750M | 5734 | 9.0 |
| o8gm330r0 | 52776.6 | 38 | G750M | 6252 | 8.0 |
| o8gm520a0 | 52791.7 | 62 | G230MB | 1854 | 400.0 |
| o8gm520x0 | 52791.8 | 62 | G230MB | 1995 | 300.0 |
| o8gm52100 | 52791.9 | 62 | G230MB | 2135 | 400.0 |
| o8gm521o0 | 52792.0 | 62 | G230MB | 2276 | 300.0 |
| o8gm521f0 | 52791.9 | 62 | G230MB | 2416 | 320.0 |
| o8gm520h0 | 52791.8 | 62 | G230MB | 2557 | 400.0 |
| o8gm520m0 | 52791.8 | 62 | G230MB | 2697 | 340.0 |
| o8gm52050 | 52791.7 | 62 | G230MB | 2836 | 300.0 |
| o8gm521j0 | 52791.9 | 62 | G230MB | 2976 | 340.0 |
| o8gm52180 | 52791.9 | 62 | G230MB | 3115 | 300.0 |
| o8gm52170 | 52791.9 | 62 | G430M | 3165 | 90.0 |
| o8gm520p0 | 52791.8 | 62 | G430M | 3423 | 90.0 |
| o8gm520l0 | 52791.8 | 62 | G430M | 3680 | 52.0 |
| o8gm521b0 | 52791.9 | 62 | G430M | 3936 | 26.0 |
| o8gm52060 | 52791.7 | 62 | G430M | 4194 | 18.0 |
| o8gm521k0 | 52791.9 | 62 | G430M | 4961 | 36.0 |
| o8gm520q0 | 52791.8 | 62 | G430M | 5216 | 16.0 |
| o8gm521g0 | 52791.9 | 62 | G430M | 5471 | 34.0 |
| o8gm520i0 | 52791.8 | 62 | G750M | 5734 | 9.0 |
| o8gm521s0 | 52792.0 | 62 | G750M | 6252 | 8.0 |
| o8gm620a0 | 52813.8 | 70 | G230MB | 1854 | 400.0 |
| o8gm620x0 | 52814.2 | 70 | G230MB | 1995 | 300.0 |
| o8gm62100 | 52814.2 | 70 | G230MB | 2135 | 300.0 |
| o8gm630d0 | 52812.2 | 70 | G230MB | 2276 | 300.0 |
| o8gm63040 | 52812.1 | 70 | G230MB | 2416 | 350.0 |
| o8gm620h0 | 52814.0 | 70 | G230MB | 2557 | 400.0 |
| o8gm620m0 | 52814.1 | 70 | G230MB | 2697 | 340.0 |
| o8gm62050 | 52813.8 | 70 | G230MB | 2836 | 300.0 |
| o8gm63080 | 52812.2 | 70 | G230MB | 2976 | 320.0 |
| o8gm62170 | 52814.3 | 70 | G230MB | 3115 | 260.0 |
| o8gm62140 | 52814.3 | 70 | G430M | 3165 | 90.0 |
| o8gm620p0 | 52814.1 | 70 | G430M | 3423 | 90.0 |
| o8gm620l0 | 52814.1 | 70 | G430M | 3680 | 52.0 |
| o8gm62180 | 52814.3 | 70 | G430M | 3936 | 26.0 |
| o8gm62060 | 52813.8 | 70 | G430M | 4194 | 18.0 |
| o8gm630c0 | 52812.2 | 70 | G430M | 4961 | 36.0 |
| o8gm620q0 | 52814.1 | 70 | G430M | 5216 | 16.0 |
| o8gm63070 | 52812.1 | 70 | G430M | 5471 | 34.0 |
| o8gm620i0 | 52814.0 | 70 | G750M | 5734 | 9.0 |
| o8gm630h0 | 52812.2 | 70 | G750M | 6252 | 15.0 |
| o8ma720q0 | 52825.5 | 69 | G430M | 4961 | 16.0 |
| o8ma720p0 | 52825.5 | 69 | G430M | 5216 | 16.0 |
| o8ma720h0 | 52825.4 | 69 | G750M | 5734 | 9.0 |
| o8ma820b0 | 52852.0 | 105 | G230MB | 1854 | 400.0 |
| o8ma820y0 | 52852.2 | 105 | G230MB | 1995 | 300.0 |
| o8ma82110 | 52852.2 | 105 | G230MB | 2135 | 300.0 |
| o8ma821m0 | 52852.4 | 105 | G230MB | 2276 | 300.0 |
| o8ma821b0 | 52852.3 | 105 | G230MB | 2416 | 320.0 |
| o8ma820i0 | 52852.0 | 105 | G230MB | 2557 | 400.0 |
| o8ma820n0 | 52852.1 | 105 | G230MB | 2697 | 340.0 |
| o8ma82060 | 52851.9 | 105 | G230MB | 2836 | 300.0 |
| o8ma821i0 | 52852.4 | 105 | G230MB | 2976 | 300.0 |
| o8ma82160 | 52852.3 | 105 | G230MB | 3115 | 300.0 |
| o8ma821a0 | 52852.3 | 105 | G430M | 3165 | 90.0 |
| o8ma820q0 | 52852.1 | 105 | G430M | 3423 | 90.0 |
| o8ma820m0 | 52852.1 | 105 | G430M | 3680 | 52.0 |
| o8ma821e0 | 52852.3 | 105 | G430M | 3936 | 26.0 |
| o8ma82070 | 52851.9 | 105 | G430M | 4194 | 18.0 |
| o8ma821o0 | 52852.4 | 105 | G430M | 4961 | 32.0 |
| o8ma820r0 | 52852.1 | 105 | G430M | 5216 | 16.0 |
| o8ma821j0 | 52852.4 | 105 | G430M | 5471 | 34.0 |
| o8ma820j0 | 52852.1 | 105 | G750M | 5734 | 6.0 |
| o8ma820a0 | 52852.0 | 105 | G750M | 6252 | 8.0 |
| o8ma92070 | 52904.3 | 153 | G230MB | 1854 | 600.0 |
| o8ma920i0 | 52904.4 | 153 | G230MB | 1995 | 600.0 |
| o8ma920m0 | 52904.4 | 153 | G230MB | 2135 | 600.0 |
| o8ma920x0 | 52904.5 | 153 | G230MB | 2276 | 300.0 |
| o8ma920s0 | 52904.4 | 153 | G230MB | 2416 | 600.0 |
| o8ma920a0 | 52904.3 | 153 | G230MB | 2557 | 800.0 |
| o8ma920d0 | 52904.4 | 153 | G230MB | 2697 | 340.0 |
| o8ma92040 | 52904.3 | 153 | G230MB | 2836 | 300.0 |
| o8ma920u0 | 52904.5 | 153 | G230MB | 2976 | 340.0 |
| o8ma920p0 | 52904.4 | 153 | G230MB | 3115 | 300.0 |
| o8ma920o0 | 52904.4 | 153 | G430M | 3305 | 90.0 |
| o8ma920e0 | 52904.4 | 153 | G430M | 3423 | 90.0 |
| o8ma920c0 | 52904.4 | 153 | G430M | 3680 | 52.0 |
| o8ma920q0 | 52904.4 | 153 | G430M | 3936 | 26.0 |
| o8ma92050 | 52904.3 | 153 | G430M | 4194 | 18.0 |
| o8ma920w0 | 52904.5 | 153 | G430M | 4961 | 36.0 |
| o8ma920f0 | 52904.4 | 153 | G430M | 5216 | 16.0 |
| o8ma920t0 | 52904.5 | 153 | G430M | 5471 | 34.0 |
| o8ma920b0 | 52904.4 | 153 | G750M | 5734 | 6.0 |
| o8ma920z0 | 52904.5 | 153 | G750M | 6252 | 8.0 |
| o8ma830g0 | 52960.7 | -142 | G430M | 4961 | 18.0 |
| o8ma830e0 | 52960.6 | -142 | G430M | 5216 | 16.0 |
| o8ma830b0 | 52960.6 | -142 | G430M | 5471 | 32.0 |
| o8ma830d0 | 52960.6 | -142 | G750M | 5734 | 8.0 |
| o8ma940g0 | 53071.3 | -28 | G230MB | 1854 | 430.0 |
| o8ma940i0 | 53071.3 | -28 | G230MB | 2135 | 320.0 |
| o8ma940m0 | 53071.3 | -28 | G230MB | 2416 | 450.0 |
| o8ma94070 | 53071.3 | -28 | G230MB | 2557 | 410.0 |
| o8ma940e0 | 53071.3 | -28 | G230MB | 2697 | 323.0 |
| o8ma94020 | 53071.2 | -28 | G230MB | 2836 | 320.0 |
| o8ma940s0 | 53071.3 | -28 | G230MB | 2976 | 323.0 |
| o8ma940j0 | 53071.3 | -28 | G230MB | 3115 | 255.0 |
| o8ma940h0 | 53071.3 | -28 | G430M | 3165 | 90.0 |
| o8ma940a0 | 53071.3 | -28 | G430M | 3423 | 90.0 |
| o8ma94090 | 53071.3 | -28 | G430M | 3680 | 52.0 |
| o8ma940k0 | 53071.3 | -28 | G430M | 3936 | 26.0 |
| o8ma94030 | 53071.2 | -28 | G430M | 4194 | 18.0 |
| o8ma940p0 | 53071.3 | -28 | G430M | 4961 | 36.0 |
| o8ma940b0 | 53071.3 | -28 | G430M | 5216 | 16.0 |
| o8ma940n0 | 53071.3 | -28 | G430M | 5471 | 34.0 |
| o8ma94080 | 53071.3 | -28 | G750M | 5734 | 6.0 |
| o8ma940r0 | 53071.3 | -28 | G750M | 6252 | 10.0 |
| Flux | |||
|---|---|---|---|
| MJD | Year | DensityaaFlux density in units of 10-11 erg/cm2/s/Å. The flux density and STMAG are corrected using the factors given in Table 2. | STMAGaaFlux density in units of 10-11 erg/cm2/s/Å. The flux density and STMAG are corrected using the factors given in Table 2. |
| HRC/F220W Filter | |||
| 50891.7 | 1998.21 | 0.076 | 9.194 |
| 51230.6 | 1999.14 | 0.155 | 8.425 |
| 52016.9 | 2001.29 | 0.189 | 8.211 |
| 52294.2 | 2002.05 | 0.230 | 7.996 |
| 53459.7 | 2002.51 | 0.255 | 7.885 |
| 52683.0 | 2003.12 | 0.263 | 7.850 |
| 52777.6 | 2003.37 | 0.224 | 8.025 |
| 52791.9 | 2003.41 | 0.239 | 7.953 |
| 52813.1 | 2003.47 | 0.202 | 8.136 |
| 52852.2 | 2003.58 | 0.126 | 8.652 |
| 52904.4 | 2003.72 | 0.132 | 8.599 |
| 53071.3 | 2004.18 | 0.218 | 8.053 |
| HRC/F250W Filter | |||
| 50891.6 | 1998.21 | 0.167 | 8.346 |
| 51230.6 | 1999.14 | 0.403 | 7.387 |
| 52016.9 | 2001.29 | 0.448 | 7.273 |
| 52294.2 | 2002.05 | 0.550 | 7.048 |
| 53459.7 | 2002.51 | 0.592 | 6.969 |
| 52683.0 | 2003.12 | 0.535 | 7.080 |
| 52777.6 | 2003.37 | 0.498 | 7.156 |
| 52791.9 | 2003.41 | 0.546 | 7.058 |
| 52813.1 | 2003.47 | 0.478 | 7.202 |
| 52852.2 | 2003.58 | 0.326 | 7.618 |
| 52904.4 | 2003.72 | 0.346 | 7.552 |
| 53071.3 | 2004.18 | 0.687 | 6.807 |
| HRC/F330W Filter | |||
| 50891.6 | 1998.21 | 0.237 | 7.964 |
| 51230.6 | 1999.14 | 0.516 | 7.119 |
| 52016.9 | 2001.29 | 0.524 | 7.101 |
| 52294.1 | 2002.05 | 0.625 | 6.910 |
| 53459.7 | 2002.51 | 0.626 | 6.908 |
| 52683.0 | 2003.12 | 0.531 | 7.088 |
| 52777.6 | 2003.37 | 0.553 | 7.043 |
| 52791.9 | 2003.41 | 0.619 | 6.920 |
| 52813.1 | 2003.47 | 0.644 | 6.878 |
| 52852.2 | 2003.58 | 0.572 | 7.007 |
| 52904.4 | 2003.72 | 0.653 | 6.862 |
| 53071.3 | 2004.18 | 0.894 | 6.521 |
| HRC/F550M Filter | |||
| 50891.6 | 1998.21 | 0.352 | 7.533 |
| 51230.6 | 1999.14 | 0.605 | 6.945 |
| 52016.9 | 2001.29 | 0.691 | 6.802 |
| 52183.2 | 2001.75 | 0.823 | 6.611 |
| 52294.1 | 2002.05 | 0.703 | 6.782 |
| 53459.7 | 2002.51 | 0.711 | 6.771 |
| 52683.0 | 2003.12 | 0.668 | 6.838 |
| 52727.3 | 2003.24 | 0.697 | 6.792 |
| 52764.4 | 2003.34 | 0.688 | 6.807 |
| 52777.6 | 2003.37 | 0.732 | 6.738 |
| 52791.9 | 2003.41 | 0.754 | 6.707 |
| 52813.1 | 2003.47 | 0.849 | 6.578 |
| 52825.5 | 2003.51 | 0.906 | 6.507 |
| 52852.2 | 2003.58 | 0.851 | 6.575 |
| 52904.5 | 2003.72 | 1.015 | 6.384 |
| 52960.6 | 2003.88 | 1.124 | 6.273 |
| 53071.3 | 2004.18 | 1.185 | 6.215 |