–Mode contamination by synchrotron emission from 3-years WMAP data
Abstract
We study the contamination of the –mode of the Cosmic Microwave Background Polarization (CMBP) by Galactic synchrotron in the lowest emission regions of the sky. The 22.8-GHz polarization map of the 3-years WMAP data release is used to identify and analyse such regions. Two areas are selected with signal-to-noise ratio and , covering % and % fraction of the sky, respectively. The polarization power spectra of these two areas are dominated by the sky signal on large angular scales (multipoles ), while the noise prevails on degree scales. Angular extrapolations show that the synchrotron emission competes with the CMBP –mode signal for tensor-to-scalar perturbation power ratio – at 70-GHz in the 16% lowest emission sky ( area). These values worsen by a factor in the region. The novelty is that our estimates regard the whole lowest emission regions and outline a contamination better than that of the whole high Galactic latitude sky found by the WMAP team (). Such regions allow to be measured directly which approximately corresponds to the limit imposed by using a sky coverage of 15%. This opens interesting perspectives to investigate the inflationary model space in lowest emission regions.
keywords:
cosmology: cosmic microwave background – polarization – radio continuum: ISM – cosmology: diffuse radiation – radiation mechanisms: non-thermal.1 Introduction
The Cosmic Microwave Background Polarization (CMBP) allows the study of the first stages of the Universe and is one of the hot topics of cosmology. One of its components, the –mode, is sensitive to the primordial Gravitational Wave (GW) background left by inflation giving a way to investigate the physics of the very early Universe (e.g. Kamionkowski & Kosowsky 1998). In fact, its power spectrum on degree scales has a linear dependence on the tensor-to-scalar perturbation power ratio , which measures the amount of primordial GW (e.g. Boyle et al. 2006; Kinney et al. 2006). In combination with parameters measured by the CMB Temperature spectrum (the scalar perturbation spectral index and its running ), it allows us to distinguish among the numerous models of inflation.
The -mode signal is faint and only upper limits of have been set so far. Seljak et al. (2006) and Martin & Ringeval (2006), using different analyses, find consistent results of and (95% C.L.), respectively. On the other hand, the plethora of inflation models does not help constrain . This can vary by orders of magnitude and can be even smaller than , although Boyle et al. (2006) show that only models with high fine tuning degree can feature . Correspondingly, the peak -mode signal can vary from nK of the present upper limits down to values even smaller than nK for .
The weakness of the CMB -mode makes it easily contaminated by foreground emissions from both the Galaxy and extragalactic sources. The study of astrophysical foregrounds is thus crucial to set the capability of CMBP experiments to investigate the early Universe and help set which part of the inflationary model space is accessible.
At frequencies lower than 60–70 GHz, the most relevant contaminant is expected to be the Galactic synchrotron emission. Recent results based on 3-years Wilkinson Microwave Anisotropy Probe (WMAP) data at 22.8-GHz show that even the high Galactic latitudes are normally strongly contaminated (Page et al., 2006). These authors use about 75 percent of the sky (all high latitudes but strong large local structures like the Northern Galactic Spur) and find that at 60–70 GHz the synchrotron emission competes with the cosmic -mode signal even for models with –0.5, which are already disfavoured by the present upper limits. Similar results are obtained by La Porta et al. (2006) through the analysis of the 1.4 GHz sky at latitude using the DRAO survey data (Wolleben et al., 2006).
La Porta et al. (2006) also analyse areas111 Three areas defined as follows: A) , ; B) , ; C) , ; and are Galactic longitude and latitude. with smaller extension (for a total of about 10% of the sky) and lower emission, finding that the Galactic signal at 70-GHz is comparable to the CMB -mode in case of . Even though lower, this signal would largely contaminate the CMB –mode for most of the values presently allowed. However, these areas are not in the lowest emission regions visible in the 22.8-GHz WMAP polarization map.
Information about the lowest emission regions are available, instead, from three independent small areas observed at 1.4 and 2.3-GHz (Carretti et al., 2005b, 2006; Bernardi et al., 2006). The synchrotron emission here actually looks weaker, competing with the CMB -mode only for cosmological models with – at 70-GHz (Carretti et al., 2006).
Such values would give more chances to investigate a large part of the inflationary model space, opening interesting perspective for the study of the inflation physics. However, the areas observed so far cover just few square degrees (-deg2 in total) and represent few sparse samples of the lowest emission regions. A real knowledge of the typical Galactic synchrotron contribution of such regions is still an open question, and requires wider areas to be analysed.
This paper reports the first study carried out to identify and analyse the areas with the lowest synchrotron emission at microwave wavelengths, which allow negligible Faraday rotation effects (still appreciable at -GHz; e.g. see Carretti et al. 2005a). We use the 22.8-GHz polarization map of the 3-years WMAP data release to select them (Section 2), and compute their polarized angular power spectra (Section 3). Finally, we estimate the contamination of the CMBP by Galactic synchrotron in the CMBP frequency window (70–90 GHz) and discuss implications for the detection of the cosmic –mode in lowest emission regions (Section 4).
2 Lowest emission regions selection
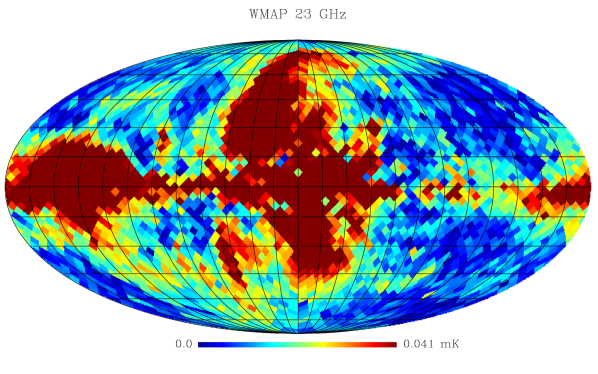
The 3-years WMAP data release222http://lambda.gsfc.nasa.gov/ has made available the first polarization all-sky map at microwave frequencies, namely 22.8-GHz (Page et al., 2006). The sensitivity does not allow to detect the signal out of the Galactic plane at the nominal resolution (FWHM ). The high Galactic latitudes have low signal-to-noise ratios (), except in large local structures like the big Supernova Remnant (SNR) loops. The situation improves once data are averaged on pixels of (top panel of Figure 1), as presented by the WMAP team (Page et al., 2006). At this resolution the signal appears even at high Galactic latitudes and allows us to identify the lowest emission regions in the sky (blue areas in top panel of Figure 1), which, however, still have signal competing with the noise.
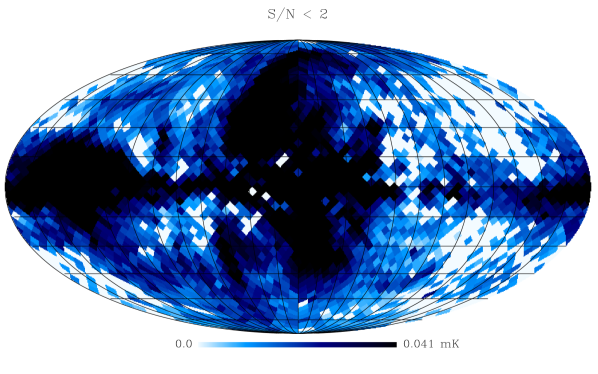
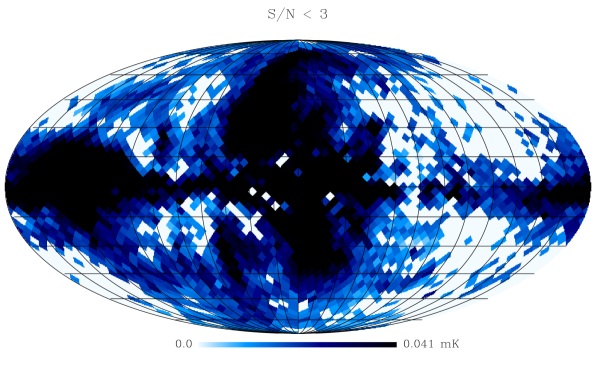
We quantitatively select the lowest emission regions using the polarized intensity map. After accounting for the noise bias (Uyanıker & Landecker, 2002), pixels with smaller than a given threshold have been selected. Namely, we have considered two values: and . The two resulting regions are shown in Figure 1.
These regions are not contiguous and located at mid-high Galactic latitudes, mainly in the third Galactic quadrant, with significant extensions in the second one. It is worth noting that the Galactic caps are not included, having too high emission.
The sky fractions covered are 16.2% () and 25.7% (), respectively. Although smaller than half a sky, these two regions have significant extensions and could still effectively be used for CMBP -mode studies.
3 Power spectrum analysis
We compute the – and –mode power spectra of the polarized emission in the two selected areas. These are the quantities predicted by cosmological models and allow a direct comparison with the CMBP signal.
To account for the irregular sky coverage we use the method based on two-point correlation functions of the Stokes parameters and described by Sbarra et al. (2003). Correlation functions are estimated on the and maps of the selected regions as
| (1) |
where is the pixel content of map , and identify pixel pairs at distance . Data are binned with pixel-size resolution. Power spectra are obtained by integration
| (2) |
| (3) |
where the functions and are described by Zaldarriaga (1998), and are the noise spectra, and is the pixel window function accounting for pixel smearing effects. The WMAP map smoothed on pixels (HEALPix parameter ) has been used to compute correlation functions and spectra, instead of the one used for the selection. This allows us to reduce the effects of the pixel window function and provides reliable computation up to of the –mode peak.
Figure 2 shows –mode spectra in the two selected areas.

These are steep on large angular scales, with the case having less power than , as expected according to selection criteria. A flattening instead occurs on small angular scales. This behaviour indicates the signal prevails on large scales ( and for and 3, respectively), while the noise dominates on smallest ones. To check if the flat component is compatible with noise, we performed Montecarlo simulations. We have generated 100 noise map realizations assuming the sensitivity map provided in the WMAP data package. Then we compute their spectra using only the pixels of the two selected regions. For both the two cases, we find that the average spectrum is flat with normalization K2 and K2 for and , respectively, which are compatible with the level of our spectra at large (Figure 2). In addition, the spectra of the two cases converge to the same value in the flat range, which again suggests the spectra are noise dominated there. We use the mean noise spectra attained with the Montecarlo simulations to account for the noise bias in all the next evaluations.
We tried to fit a power law
| (4) |
to the spectra. Only the case allows meaningful results (Table 1), because only few points (three) can be effectively used for , after the noise bias is subtracted for. To provide an estimate of the mean emission also for the case, we compute the mean value of the quantity over the usable -range, which is . The result is reported in Table 1, along with the same estimate for the area. It is worth noting that there is a factor in spectrum ( in signal) between the mean emissions of the two analysed regions. Moreover, the emission we found in the region is a factor weaker than that measured in the % sky fraction in the same -range (Page et al., 2006).
| -range | [K2] | [K2] | ||
|---|---|---|---|---|
| 2 | [4, 12] | |||
| 3 | [4, 24] |
4 Implication for CMBP -mode and discussion
The contamination of the CMB -mode signal can be estimated by extrapolating the spectra of Sect. 3 to 70-GHz, a frequency in the range where the combined contribution of synchrotron and dust is believed to be minimum (Page et al., 2006; Carretti et al., 2006). It is worth noting that typical values of rotation measure at high Galactic latitudes (–20 rad m-2) generate polarization angle rotations of 6–12 arcmin at 22.8-GHz. Thus, Faraday rotation effects can be considered negligible, allowing safe frequency extrapolations.
Our spectra are noise dominated at the multipole the CMB -mode peaks at () and a direct extrapolation of them would provide just upper limits. Then, we adopt another approach: we use the spectra measured in the –range where they are signal–dominated and perform angular extrapolations to the scale of interest. The mean emission is that provided by the last column of Table 1. As for the extrapolation, the analysis of the 1.4-GHz DRAO survey data shows that the angular behaviour of Galactic synchrotron spectra is well represented by a power law
| (5) |
with slope varying in the range [-2.5, -3.0] for –300 (La Porta et al., 2006; Burigana et al., 2006). This is consistent with the value of quoted by the WMAP team for the whole 75% of the sky they consider (Page et al., 2006). We use as slope both the two edge values of the range (-2.5 and -3.0) and start extrapolations from the middle of the -range used to evaluate the mean spectrum, namely , 14 for , , respectively.
Frequency extrapolations are performed assuming the brightness Temperature of the Galactic synchrotron follows a power law , with (Bernardi et al., 2004).
Results are reported in Figure 3.
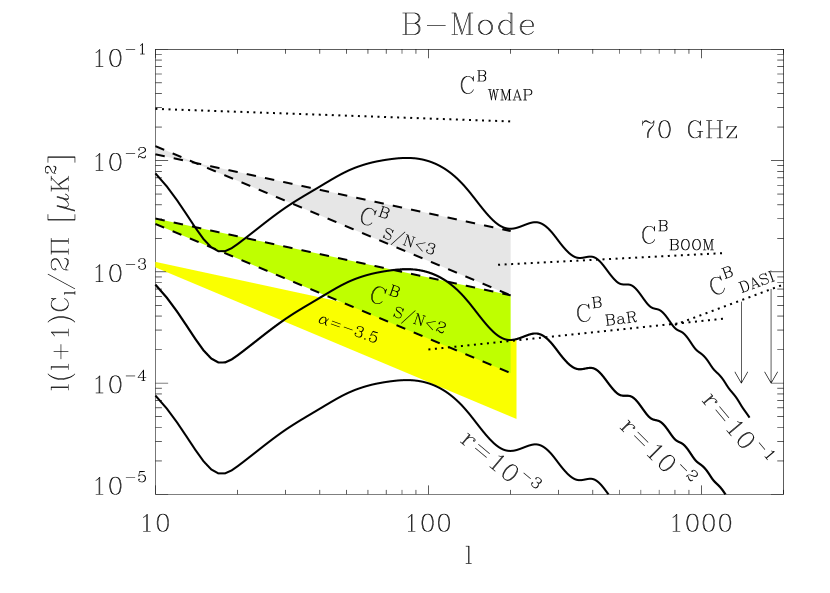
For the case, which concerns % of the sky, the contamination range covered by the two angular extrapolations at competes with the CMBP -mode for models with , . The comparison with previous measurements shows these values are significantly lower than the mean contamination estimated by the WMAP team for most of high Galactic latitudes. On the other hand, our results are similar to the contamination estimated in the small sky patches observed in low emission regions (Carretti et al. 2006 and references therein) giving a valuable consistency of results in regions selected with similar criteria (areas in lowest emission regions). Although with the uncertainties of an angular scale extrapolation, our results extend to the whole lowest emission regions the promising indications obtained in those few small sample areas covering just few square degrees, and strongly support the possibilities to access small values in the lowest emission part of the sky.
The use of frequency slope can be considered as a conservative approach. In fact, Hinshaw et al. (2006) fit the behaviour of the synchrotron total intensity, finding out a steepening of the slope at the highest frequencies of the WMAP range. In particular, they fit in the range 23–60 GHz. With such a slope the synchrotron contamination at 70 GHz further reduces by a factor 2.5 with respect to and even , becomes accessible (yellow shaded area of Figure 3).
The situation is slightly worse for , as expected, since higher emission pixels are included in the analysis. However, , looks still accessible even in this larger region, assuming . These are values better than that for all the high Galactic latitudes (WMAP results on of the sky), or in the areas analysed by La Porta et al. (2006).
For the lowest emission areas, the minimum combined synchrotron-dust contamination has been found to be somewhere between 70 and 90-GHz (Carretti et al., 2006). It is thus worthy estimating the synchrotron contamination of our best case () even at 90-GHz. A further factor is gained with respect to 70-GHz (in thermodynamic temperature), and the Galactic signal competes with models with , .
Despite the significant general contamination of high Galactic latitudes, the results obtained by our analysis depict a situation with better and interesting conditions in the lowest emission regions. The possibility to reach values as low as – looks now extended from few small good sky patches to an area representing % of the sky, that could be the right place for deep CMBP observations looking at the -mode.
To limit observations in small regions, however, imposes intrinsic constraints on the minimum detectable , mainly because of the leakage from - into the weaker -mode. In fact, Amarie et al. (2005) find that an all-sky survey would allow a detection of with a theoretical sensitivity limit of , that becomes when 70% of the sky is available, and for 15% (3- C.L.). It is worth noting that the class of inflationary models with minimal fine-tuning have values ranging within and (Boyle et al., 2006), for which a 15% sky portion would be large enough for the first detection of the tensor CMBP component.
In spite of these limitation, the minimum value detectable in 15% of the sky almost matches the limit imposed by the foregrounds we have found in lowest emission regions. Although the uncertainties because of the angular extrapolations we need to apply, the search for the -mode in a sky portion of such a size could thus be a good trade-off between intrinsic and foregrounds limits.
In addition, the weakness of the -mode signal makes already a challenge to detect the signal for with the present technology (e.g. Cortiglioni & Carretti 2006). It is likely that significant technological improvements will be necessary before cosmologists can face an all-sky mapping mission with a sensitivity able to match the intrinsic limit of . Therefore, an experiment aiming at detecting the -mode in a smaller region (10-15% of the sky) can be a valuable intermediate step that would allow us to probe inflation models down to .
Acknowledgments
We thank an anonymous referee for valuable comments, which helped improve the paper. Some of the results in this paper have been derived using the HEALPix package (http://healpix.jpl.nasa.gov). We acknowledge the use of the CMBFAST package, WMAP data, and the Legacy Archive for Microwave Background Data Analysis (LAMBDA). Support for LAMBDA is provided by the NASA Office of Space Science.
References
- Amarie et al. (2005) Amarie M., Hirata C., & Seljak U., 2005, Physical Review D, 72, id. 123006
- Bernardi et al. (2004) Bernardi G., Carretti E., Fabbri R., Sbarra C., Poppi S., Cortiglioni S., Jonas J.L., 2004, MNRAS, 351, 436
- Bernardi et al. (2006) Bernardi G., Carretti E., Sault R.J., Cortiglioni S., Poppi S., 2006, MNRAS, 370, 2064
- Boyle et al. (2006) Boyle L.A., Steinhardt P.J., & Turok N., 2006, Phys. Rev. Lett. 96, 111301
- Burigana et al. (2006) Burigana C., La Porta L., Reich P., Reich W., 2006, Astron. Nachr., 327, 491
- Carretti et al. (2005a) Carretti E., Bernardi G., Sault R.J., Cortiglioni S., & Poppi S., 2005a, MNRAS, 358, 1
- Carretti et al. (2005b) Carretti E., McConnell D., McClure-Griffiths N.M., Bernardi G., Cortiglioni S., & Poppi S., 2005b, MNRAS, 360, L10
- Carretti et al. (2006) Carretti E., Poppi S., Reich W., Reich P., Fürst E., Bernardi G., Cortiglioni S., Sbarra C., 2006, MNRAS, 367, 132
- Cortiglioni & Carretti (2006) Cortiglioni S., & Carretti E., 2006, in Fabbri R. ed., Cosmic Polarization, in press, astro-ph/0604169
- Górski et al. (2005) Górski K.M., et al., 2005, ApJ, 622, 759
- Hinshaw et al. (2006) Hinshaw G., et al., 2006, ApJ, submitted, astro-ph/0603451
- Kamionkowski & Kosowsky (1998) Kamionkowski M., Kosowsky A., 1998, PRD, 57, 685
- Kinney et al. (2006) Kinney W.H., Kolb E.W., Melchiorri A., & Riotto A., 2006, astro-ph/0605338
- La Porta et al. (2006) La Porta L., Burigana C., Reich W., Reich P., 2006, A&A Letters, in press, astro-ph/0607300
- Martin & Ringeval (2006) Martin J., Ringeval C., 2006, JCAP, in press, astro-ph/0605367
- Page et al. (2006) Page L., et al., 2006, ApJ, submitted, astro-ph/0603450
- Sbarra et al. (2003) Sbarra C., Carretti E., Cortiglioni S., Zannoni M., Fabbri R., Macculi C., Tucci M., 2003, A&A, 401, 1215
- Seljak et al. (2006) Seljak U., Slosar A., McDonald P., 2006, astro-ph/0604335
- Uyanıker & Landecker (2002) Uyaniker B., Landecker T.L., 2002, ApJ, 575, 225
- Wolleben et al. (2006) Wolleben M., Landecker T.L., Reich W., & Wielebinski R., 2006, A&A, 448, 411
- Zaldarriaga (1998) Zaldarriaga M., 1998, Ph.D. Thesis, M.I.T., astro-ph/9806122