The vc- relation in low mass and low surface brightness galaxies
Abstract
We present an updated investigation of the relation between large scale disk circular velocity, , and bulge velocity dispersion, . New bulge velocity dispersions are measured for a sample of 11 low surface brightness (LSB) and 7 high surface brightness (HSB) spiral galaxies for which is known from published optical or HI rotation curves. We find that, while LSB galaxies appear to define the upper envelope of the region occupied by HSB galaxies (having relatively larger for any given ), the distinction between LSB and HSB galaxies in the plane becomes less pronounced for km s-1. We conclude that either the scatter of the relation is a function of (and hence galaxy mass) or that the character of the relation changes at km s-1. Some inplications of our findings are discussed.
keywords:
black hole physics — dark matter — galaxies: haloes — galaxies: nuclei1 Introduction
The existence of supermassive black holes (SBHs) in galactic nuclei has been accepted since the detections in the nearby spiral NGC 4258 (Miyoshi et al., 1995) and in our own galaxy (Schödel et al., 2003; Ghez et al., 2003). Compelling cases now exist in three dozen additional galaxies (see Ferrarese & Ford 2005 for a review), making it possible to investigate the existence of scaling relations linking the SBH mass, , to the overall properties of the host. Indeed, correlates with the blue luminosity of the host bulge (Kormendy & Richstone, 1995; Marconi & Hunt, 2003), with the central light concentration (Graham et al., 2001), and with the bulge velocity dispersion (Ferrarese & Merritt, 2000; Gebhardt et al., 2000). Because of its tight scatter (0.34 dex in ), the relation is thought to allow us to peer into the mechanisms controlling the joint formation/evolution of SBHs and galaxies. However, cosmological simulations show that a possibly more fundamental relation should be expected between and the total gravitational mass of the galaxy, or the mass of the dark matter (DM) halo (e.g. Di Matteo et al., 2003; Kawakatu et al., 2005; Wyithe & Loeb, 2005; Adams, Graff & Richstone, 2000; Monaco, Salucci & Danese, 2000; Haehnelt, Natarajan & Rees, 1998; Cattaneo, Haehnelt & Rees, 1999; Silk & Rees, 1998; Haehnelt & Kauffmann, 2000; Loeb & Rasio, 1994). Indirect observational evidence for such a link has been found in the form of a correlation between the circular velocity of spirals’ disks (obtained by either HI or deep optical observations) and the of their bulge component (Ferrarese 2002; Baes et al. 2003; Pizzella et al. 2005):
| (1) |
Further exploring the relation is of interest because, by linking galactic components on vastly different scales, the relation is a reflection of the interplay between disks and spheroids during galaxy formation/evolution. Furthermore, if and are used as surrogates for and respectively, equation (1) implies a strong causal relation between SBHs and DM haloes.
Pizzella et al. (2005) report evidence of a separation in the plane between High and Low Surface Brightness spiral galaxies (HSB and LSB respectively), the latter having distinctly larger at a given compared to the former. Based on this, the authors argue against the importance of baryonic collapse in shaping the density profiles of DM haloes in LSBs, and suggest that for a given DM halo mass, LSBs might host less massive SBHs than HSBs. The behaviour of HSBs themselves is somewhat controversial: while Pizzella et al. (2005) find that HSB in the range km s-1 (corresponding to km s-1) follow a linear relation, Ferrarese (2002) and Baes et al. (2003) claim that the relation is mildly non-linear for km s-1 ( km s-1), and breaks down altogether at lower , possibly revealing the inability of the least massive haloes to form central SBHs (Shankar et al., 2006; Haehnelt, Natarajan & Rees, 1998; Silk & Rees, 1998; Loeb & Rasio, 1994)
The goal of this paper is to investigate the relation for a combination of LSB and HSB galaxies, with in the critical range km s-1. The data reduction and analysis are discussed in §2 and §3 respectively. Discussion and conclusions can be found in §4.
2 Observations and Data Reduction
To compare the behaviour of LSBs and HSBs in the km s-1 range of the relation, we drafted a sample of galaxies with known from published rotation curves, and proceeded to obtain new optical spectra from which to measure . We targeted 11 LSB galaxies with optical rotation curves from the Palunas & Williams (2000) compilation, and seven HSB galaxies with HI rotation curves from the Ursa Major sample of Verheijen (2001). Besides the need of selecting galaxies visible in the given observing season, and bright enough to produce spectra with the required signal-to-noise ratio (S/N), the one essential criterium in our sample selection is that the published rotation curves must be symmetric relative to the galaxy’s centre, and reach an asymptotic value at large radii.
Details of the sample and observations are given in Table 1. The LSB galaxies were observed with the VLT/UT4 telescope of the European Southern Observatory on the nights of 2004 April 20, 29 and May 6. The holographic grism GRIS_1028z+29 on FORS2 was centred on the Calcium absorption triplet around 8500Å, producing an instrumental broadening km s-1 with the 07 slit. The seven HSB galaxies were observed with the TWIN spectrograph at the 3.5m Calar Alto telescope, on 2005, June 6-19. The T06 grating was used in 1st order, again centred at the Ca triplet. The instrumental broadening was km s-1 for the 12 wide slit. All spectra were divided into several exposures to ease cosmic ray identification and removal.
Standard data reduction was performed with MIDAS, IRAF and additional software developed specifically for this project. After basic data processing (dark and bias subtraction, flat fielding and trimming), atmospheric emission lines were identified and removed through an interpolation scheme, after which the spectra were rectified and wavelength calibrated. Cosmic rays were removed by applying a median filter along the spatial axis.

3 Data analysis
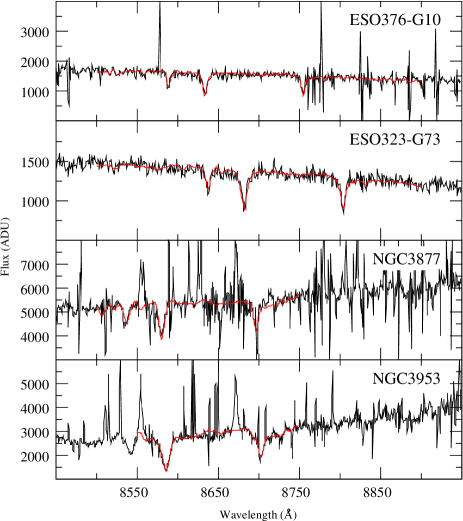
Deriving accurate kinematical quantities of galaxies is a non-trivial task. The result of the extraction can vary depending on the applied fitting techniques, the S/N, the template stars, the absorption lines used, etc. (e.g., De Bruyne et al. 2003). To lower this degree of subjectivity, we derived velocity dispersions using two independent techniques: a direct fit to the spectrum (De Bruyne et al., 2004), and the PPXF algorithm (Cappellari & Emsellem, 2004) (see Fig. 1), which is based on a Penalized Likelihood approach. Velocity dispersions derived using these two methods agree to within 10%; the final values quoted in Table 1 were obtained using the routine. In analyzing the spectra, sky residuals that deviated by more than 3 times the average sigma in the nearby continuum were rejected; furthermore, to minimize the effects of template mismatch, six different template stars were used, each with weight calculated by a quadratic fit to the central row of the spectrum. In keeping with previous works, velocity dispersions were extracted from spectra binned, in the spatial direction, out to 1/8th of the bulge effective radius, estimated from the literature in the case of the HSB galaxies (Baggett et al., 1998; Courteau, 1996; Heraudeau et al., 1996; Möllenhoff & Heidt, 2001), and from published surface brightness profiles for the Palunas & Williams (2000) galaxies. Within this radius, the effect of a possible contamination by the disk rotational velocity should be negligible. This was verified by measuring the dispersion profiles along the major axis (without binning spatially); the velocity dispersion of most galaxies (see Fig. 2) indeed remained nearly constant in the bulge dominated region.
The circular rotational velocities and errors are published by Verheijen (2001) for the HSB galaxies. These were derived from HI observations and extend beyond the optical radius (), well into the flat part of the curve. For the LSB galaxies, we measured as the weighted average of the flat part of the optical rotation curve published in Palunas & Williams (2000); the error on was derived by means of a bootstrap method and reflects any slight asymmetries in the rotation curves. The optical rotation curves are not as extended as the HI observations of the HSB galaxies, however all rotation curves reach an asymptotic value at large radii. As shown in Pizzella et al. (2005), when this condition is satisfied, can be extracted reliably; therefore we do not expect any systematic biases in the measurements between our samples of HSBs and LSBs. The results of the dynamical analysis are given in Table 1.
4 Discussion and Conclusions
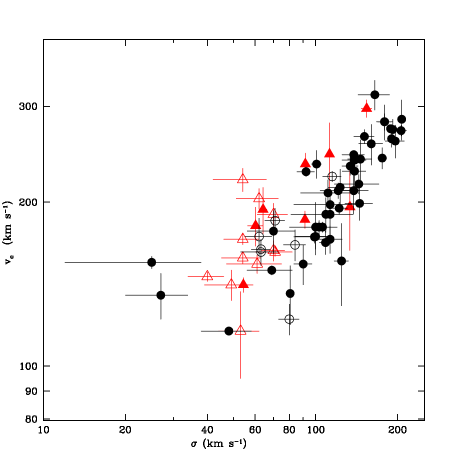
The relation for HSB galaxies is plotted in the left panel of Fig. 3. The 11 LSB galaxies studied in this paper populate the region between km s-1, where previously only three galaxies could be found. Furthermore, in the same region, we more than double the number of HSB galaxies, from three to eight. Pizzella et al. (2005) conclude that, relative to the relation defined by HSB galaxies, LSB galaxies appear to have larger circular velocities, , at any given value of . This conclusion is reaffermed by our data. However, with the addition of the present sample, it has now become more evident that there is some overlap in the locations occupied by LSB and HSB galaxies in the plane. In other words, LSB galaxies appear to occupy the upper envelope of the strip defined by HSB galaxies. Furthermore, at low velocity dispersions km s-1, the relation for both LSB and HSB galaxies appears to be shifted towards larger circular velocities relative to the relation defined by the (HSB) galaxies with larger velocity dispersion.
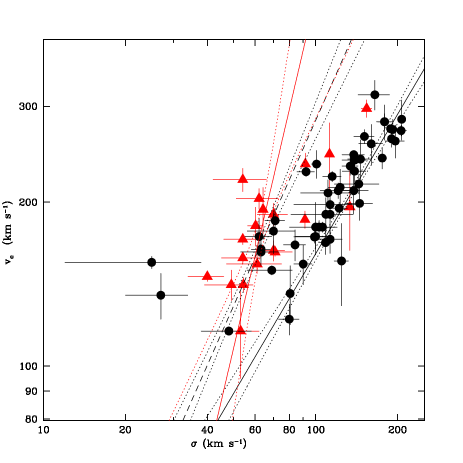
A least-square fit, taking into account the errors on both quantities (FITEXY; Press et al., 2002), to the sample of HSBs with km s-1 gives:
| (2) |
with . For km s-1, on the other hand,
| (3) |
with for HSB galaxies, and
| (4) |
with for LSB galaxies.
Although the uncertainties are large, equations (3) and (4) are consistent with each other well within 1, but inconsistent with equation (2) (see also right panel of Figure 3).
Two interpretations are open at this point. The samples studied to date are far from complete or homogeneous, and it is conceivable that, as more data are collected, more galaxies will fill the gap between the LSB galaxies, which are mainly found in the low-velocity dispersion region, and the extrapolation to low of equation (2), defined mainly by HSB galaxies. This interpretation allows for the possibility that the log-log relation, including both HSB and LSB galaxies, is linear, but that its scatter increases going from large to small velocity dispersions. Alternatively, it is possible that the log-log relation is not linear, and that indeed its character changes dramatically below km s-1, as originally suggested by Ferrarese (2002) and Baes et al. (2003). In either case, it seems unavoidable to conclude that the efficiency of bulge (and, perhaps, SBH) formation, is regulated by intrinsic parameters in addition to the depth of the global potential well.
The implications of these findings for the central SBHs cannot be easily quantified. The relation is not characterised for LSBs, for which no SBH detection has been attempted. It is also not defined below km s-1, which corresponds to SBHs too small to be detected given current space or ground-based instrumentation. We reiterate the conclusion of Ferrarese et al. (2002) and Baes et al. (2003) that the behaviour of the relation at km s-1 might reflect the inability of these galaxies to form a central SBH, as argued on theoretical grounds by, for instance, Shankar et al. (2006); Haehnelt, Natarajan & Rees (1998); Silk & Rees (1998); Loeb & Rasio (1994). Numerical simulations (Di Matteo et al., 2003; Robertson et al., 2005) predict that the relation originates from the feedback between the central SBH and the progenitor of the hot stellar component at the early stages of the formation of both; therefore, in low-mass, late-type HSB and LSB galaxies internal factors might lead to the suppression of such feedback, creating a dynamical relation between disk, bulge and SBH which is starkly different from that displayed by more massive systems.
| Name | R.A. | Dec. | Morph | Incl. | Exp.Time | S/N | |||||
| (J2000) | (J2000) | (km s-1) | (km s-1) | (arcsec) | (km s-1) | (mag) | (degrees) | (seconds) | (@ 8500 Å) | ||
| LSB galaxies | |||||||||||
| ESO215-G39 | 11h17m04s | 49∘12′05′′ | 1623 | 7111 | 4.5 | 4335 | SABc | 12.01 | 50 | 500 | 20.03 |
| ESO268-G44 | 12h48m42s | 45∘00′29′′ | 1909 | 709 | 3.5 | 3477 | Sb | 12.22 | 62 | 450 | 25.68 |
| ESO322-G19 | 12h29m07s | 40∘40′24′′ | 1419 | 4910 | 0 | 3100 | SBc | 12.64 | 79 | 900 | 22.19 |
| ESO323-G42 | 12h55m01s | 40∘58′20′′ | 1584 | 549 | 4 | 4203 | Sc | 11.53 | 69 | 450 | 30.32 |
| ESO323-G73 | 13h04m02s | 38∘11′57′′ | 1637 | 707 | 2 | 4929 | Sbc | 12.44 | 48 | 450 | 35.29 |
| ESO374-G03 | 09h51m57s | 33∘04′25′′ | 1463 | 406 | 6 | 2931 | SABc | 11.51 | 71 | 600 | 21.80 |
| ESO382-G06 | 13h05m32s | 32∘57′38′′ | 1714 | 548 | 2 | 4809 | Sab | 13.20 | 54 | 600 | 21.01 |
| ESO444-G21 | 13h23m31s | 30∘06′52′′ | 11621 | 539 | 4.5 | 4265 | Sc | 12.86 | 84 | 1900 | 20.46 |
| ESO444-G47 | 13h28m25s | 31∘51′28′′ | 1546 | 6114 | 0 | 4389 | SBc | 12.82 | 71 | 900 | 22.01 |
| ESO509-G91 | 13h40m03s | 25∘28′28′′ | 2039 | 6211 | 6.5 | 5113 | SBc | 12.70 | 79 | 900 | 20.91 |
| ESO376-G10 | 10h42m00s | 36∘56′07′′ | 22011 | 5412 | 7 | 3184 | SBd | 11.00 | 76 | 600 | 20.27 |
| HSB galaxies | |||||||||||
| NGC 3953 | 11h53m49s | +52∘19′36′′ | 2235 | 1159 | 66 | 1052 | Sbc | 9.03 | 63 | 2500 | 60.01 |
| NGC 3877 | 11h46m08s | +47∘29′40′′ | 16711 | 848 | 53.5 | 895 | Sc | 9.91 | 83 | 3600 | 66.08 |
| NGC 4088 | 12h05m34s | +50∘32′21′′ | 17314 | 627 | 76 | 757 | SABc | 9.51 | 71 | 3600 | 58.13 |
| NGC 3949 | 11h53m41s | +47∘51′32′′ | 1647 | 635 | 36 | 800 | Sbc | 10.23 | 56 | 4000 | 57.15 |
| NGC 4157 | 12h11m04s | +50∘29′05′′ | 18510 | 716 | 35 | 774 | SABb | 9.93 | 90 | 4000 | 63.30 |
| NGC 3769 | 11h37m44s | +47∘53′35′′ | 1228 | 807 | 29 | 737 | Sb | 11.08 | 78 | 8000 | 66.25 |
| NGC 3726 | 11h33m21s | +47∘01′45′′ | 1629 | 6310 | 84 | 866 | Sc | 9.50 | 49 | 6600 | 38.44 |
Acknowledgments
We would like to thank S. De Rijcke for sharing his software to derive velocity dispersion profiles with us, P. Palunas for providing us the rotational velocities in tabular form and A. Pizzella for the very fruitful discussions. PB wishes to thank the Herzberg Institute of Astrophysics for the hospitality which made this investigation possible. Based on observations made at the European Southern Observatory, Chile (ESO Programme No. 073.B-0780). Based on observations collected at the Centro Astronómico Hispano Alemán (CAHA) at Calar Alto, operated jointly by the Max-Planck Institut für Astronomie and the Instituto de Astrofísica de Andalucía (CSIC). PB acknowledges the Fund for Scientific Research Flanders (FWO) for financial support. This research has made use of the NASA/IPAC Extragalactic Database (NED) which is operated by the Jet Propulsion Laboratory, California Institute of Technology, under contract with the National Aeronautics and Space Administration.
References
- Adams, Graff & Richstone (2000) Adams, F.C., Graff, D.S., Richstone, D., 2000, ApJ, 551, L31
- Baes et al. (2003) Baes, M., Buyle, P., Hau, G.K.T., Dejonghe, H., 2003, MNRAS, 341, L44
- Baggett et al. (1998) Baggett, W. E., Baggett, S. M., Anderson, K. S. J., 1998, AJ, 116, 1626
- Cappellari & Emsellem (2004) Cappellari, M. & Emsellem, E., 2004, PASP, 116, 138
- Cattaneo, Haehnelt & Rees (1999) Cattaneo, A., Haehnelt, M.G., Rees, M.J., 1999, MNRAS, 308, 77
- Courteau (1996) Courteau, S., 1996, ApJS, 103, 363
- De Bruyne et al. (2003) De Bruyne, V., Vauterin, P., De Rijcke, S., Dejonghe, H., 2003, MNRAS, 339, 215
- De Bruyne et al. (2004) De Bruyne, V., De Rijcke, S., Dejonghe, H., Zeilinger, W.W. 2004, MNRAS, 349, 461
- De Rijcke et al. (2005) De Rijcke, S., Michielsen, D., Buyle, P., Zeilinger, W.W., Dejonghe, H., Hau, G.K.T., 2005, AN, 326, 542
- Di Matteo et al. (2003) Di Matteo, T., Croft, R. A.C., Springel, V., Hernquist, L. 2003, ApJ, 593, 56
- Ferrarese (2002) Ferrarese, L., 2002, ApJ, 578, 90
- Ferrarese & Merritt (2000) Ferrarese, L. & Merritt, D., 2000, ApJ, 539, L9
- Ferrarese & Ford (2005) Ferrarese, L., & Ford, H.C. 2005, Sp.Sc.Reviews, 116, 523
- Gebhardt et al. (2000) Gebhardt K. et al., 2000, ApJ, 539, L13
- Ghez et al. (2003) Ghez, A.M., et al. 2003, ApJ, 586, L127
- Graham et al. (2001) Graham, A.W., Erwin, P., Caon, N., & Trujillo, I., 2001, ApJ, 563, L11
- Haehnelt, Natarajan & Rees (1998) Haehnelt, M.G.,Natarajan, P., Rees, M.J., 1998, MNRAS, 300, 817
- Haehnelt & Kauffmann (2000) Haehnelt, M.G., & Kauffmann, G., 2000, MNRAS, 318, L35
- Harmes et al. (1994) Harmes, R.J., et al. 1995, ApJ, 435, L35
- Heraudeau et al. (1996) Heraudeau, P., Simien, F., Mamon, G. A., 1996, A&A, 117, 417
- Hopkins et al. (2005) Hopkins, P. F., Hernquist, L., Martini, P., Cox, T. J., Robertson, B., Di Matteo, T., Springel, V. , 2005, ApJ, 625, L71
- Kawakatu et al. (2005) Kawakatu, N., Saitoh, T.R., Wada, K. 2005, ApJ, 628, 129
- Kelson (2003) Kelson, D., 2003, PASP, 115, 688
- Kormendy & Richstone (1995) Kormendy, J. & Richstone, D., 1995, ARA&A, 581
- Loeb & Rasio (1994) Loeb, A. & Rasio, F., 1994, ApJ, 432, L52
- Marconi & Hunt (2003) Marconi, A., & Hunt, L.K. 2003, ApJ, 589, L21
- Miyoshi et al. (1995) Miyoshi, M., Moran, J., Herrnstein, J., Greenhill, L., Nakai, N., Diamond, P., & Inoue, M. 1995, Nature, 373, 127
- Möllenhoff & Heidt (2001) Möllenhoff, C., Heidt, J., 2001, A&A, 368, 16
- Monaco, Salucci & Danese (2000) Monaco, P., Salucci, P., Danese, L., 2000, MNRAS, 311, 279
- Palunas & Williams (2000) Palunas, P. & Williams, T.B., 2000, AJ, 120, 2884
- Pizzella et al. (2005) Pizzella, A., Corsini, E.M., Dalla Bontá, E., Sarzi, M., Coccato, L., Bertola, F., 2005, ApJ, 631, 785
- Press et al. (2002) Press, W.H., Teukolsky, S.A., Vetterling, W.T., Flannery, B.P., 2002, Numerical Recipes in C++. Cambridge Univ. Press, Cambridge
- Robertson et al. (2005) Robertson, B., Hernquist, L., Cox, T.J., Di Matteo, T., Hopkins, P.F., Martini, P., Springel, V., 2005, astro-ph/0506038
- Schödel et al. (2003) Schödel, R., Ott, T., Genzel, R., Eckart, A., Mouawad, N., & Alexander, T. 2003, ApJ, 596, 1015
- Shankar et al. (2006) Shankar, F., Lap, A., Salucci, P., De Zotti, G., Danese, L. 2006, astro-ph/0601577
- Silk & Rees (1998) Silk, J. & Rees, M.J.., 1998, A&A, 331, L1
- Stuart & Wyithe (2006) Stuart, J. & Wyithe, B. 2006, MNRAS, 365, 1082
- Tremaine et al. (2002) Tremaine, S. et al., 2002, ApJ, 574, 740
- Van Zee et al. (2004) Van Zee, L., Skillman, E.D., Haynes, M.P., 2004, AJ, 128, 121
- Verheijen (2001) Verheijen, M., 2001, ApJ, 563, 694
- Wyithe & Loeb (2005) Wyithe, J.S. & Loeb, A. 2005, ApJ, 634, 910