High Resolution Imaging of Molecular Outflows in Massive Young Stars
Abstract
We present high angular resolution observations toward two massive star forming regions IRAS 18264-1152 and IRAS 23151+5912 with the Plateau de Bure Interferometer (PdBI) in the SiO (J=2-1) and H13CO+ (J=1-0) lines and at 1.3 mm and 3.4 mm continuum, and with the Very Large Array (VLA) in the NH3 (J,K)=(1,1), (2,2) lines. The NH3 (1,1) and (2,2) emission is detected toward IRAS 18264-1152 only. For IRAS 18264-1152, the SiO observations reveal at least two quasi-perpendicular outflows with high collimation factors, and the most dominant feature is a redshifted jet-like outflow with very high velocities up to about kms-1 with respect to the systemic velocity. The very-high-velocity component ( kms-1) of this outflow is spatially offset from its high-velocity ( kms-1) component. The SiO line profiles and position-velocity characteristics of these two components suggest that this outflow can be driven by an underlying precessing jet. For IRAS 23151+5912, the bipolar but mainly blueshifted SiO outflow coincides with the inner parts of the single-dish CO outflow. In particular the quasi-parabolic shape of the blueshifted outflow coincides with the near-infrared nebulosity and is consistent with entrainment of the gas by an underlying wide-angle wind. The analysis of the molecular outflow data of the two luminous sources further support high-mass stars forming via a disk-mediated accretion process similar to low-mass stars.
1 Introduction
The formation process of massive stars is poorly understood. There are two competing views: One view is that high-mass stars form via infall and disk mediated accretion processes as a scaled-up version of their low-mass counterparts (e.g., Jijina & Adams, 1996; Garay & Lizano, 1999; Norberg & Maeder, 2002; McKee & Tan, 2002; Yorke & Sonnhalter, 2002; McKee & Tan, 2003; Keto, 2003). The other view argues that at the dense center of evolving massive clusters, competitive accretion could become a dominant process. In the extreme case, even the coalescence of low- and intermediate-mass (proto)stars may occur to form the most massive stellar objects (e.g., Bonnell et al., 1998; Stahler et al., 2000; Bonnell et al., 2004; Bally & Zinnecker, 2005).
Massive molecular outflows play a very important role in massive star formation. In addition to dissipating excess angular momentum of the infalling material as their low-mass counterparts (Shu et al., 1987), they may inject enough energy to sustain the turbulence and prevent a decrease of the virial parameter (Quillen et al., 2005), whose value may determine whether competitive accretion is effective in cluster forming clouds (Krumholz et al., 2005a). Outflows also lead to significant anisotropy in the distribution of the circumstellar material, which greatly reduces the radiation pressure experienced by the infalling material (Krumholz et al., 2005b). The collimation factor of massive molecular outflows can help to discriminate between the disk mediated accretion process and the coalescence process, since the former requires massive outflows as collimated as their low-mass counterparts and the latter predicts outflows to be far less collimated.
Surveys with single-dish telescopes find that massive molecular outflows are ubiquitous toward high-mass star forming regions, and are far more massive and energetic than their low-mass counterparts (e.g., Shepherd & Churchwell, 1996; Zhang et al., 2001; Beuther et al., 2002c; Zhang et al., 2005). While Shepherd & Churchwell (1996) find that massive outflows appear to be less collimated than their low-mass counterparts, Beuther et al. (2002c) argues that this may be mostly an observational artifact caused by the large distances of the target sources and the low spatial resolution of most studies. In recent years, there have been several high spatial resolution mm interferometric studies of molecular outflows toward massive star forming regions. Shepherd & Kurtz (1999) reveal a massive outflow with a wide opening angle toward G192.16-3.82 and suggest its driven mechanism as a strong wide-angle wind; Cesaroni et al. (1999) report a highly collimated SiO jet toward IRAS 20126+4104, and Shepherd et al. (2000) reveal the same, but a larger scale (2pc) outflow in CO in a different orientation; Hunter et al. (1999) show a well collimated SiO jet toward AFGL 5142; Beuther et al. (IRAS 05358+3543, 2002a; IRAS 19410+2336, 2003; IRAS 19217+1651, 2004) resolve simple outflows previously identified with single-dish observations into multiple and well collimated outflows when observed with interferometers at high spatial resolution. They find that their kinematics are similar to those of low-mass counterparts; Shepherd et al. (2003) present multiple, overlapping massive outflows driven by at least four protostars in the region of W75 N. Their energetics and near-infrared observations suggest that they are not likely to be scaled-up versions of jet-driven outflows from low-mass protostars; Gibb et al. (2003) show that a precessing jet-driven flow associated with G35.2-0.7N in single-dish observations can be explained as at least two overlapping flows; Su et al. (2004) reveal a clear bipolar morphology of molecular outflows toward two luminous sources IRAS 21519+5613 and IRAS 22506+5944; Kumar et al. (2004) unveil at least four outflows toward an ultra-compact (UC) HII region Onsala 1; Sollins et al. (2004) resolve a highly energetic bipolar SiO outflow toward UC HII region G5.89-0.39. All of these interferometric observations reveal new morphologies of massive outflows that can not be resolved with single-dish observations and give a wealth of information about the physical process in the innermost parts of the massive star forming regions.
As the statistics of the high spatial resolution interferometric observations are still poor and some basic issues, such as collimation factors and outflow driving mechanism, are being debated, we carry out a study of massive molecular outflows with the Plateau de Bure Interferometer (PdBI) and the Very Larege Array (VLA). Here we use the shock tracer SiO (J=2-1) to image outflows toward two massive star forming regions IRAS 18264-1152 and IRAS 23151+5912 (hereafter we refer as I18264 and I23151, respectively). The dense cores and ambient gas are mapped at 1.3 and 3.4 mm continuum, and in the NH3(1,1) and (2,2) and H13CO+ (J=1-0) lines. The two sources are part of a larger sample discussed in detail by Sridharan et al. (2002) and Beuther et al. (2002b, d). Beuther et al. (2002c) present bipolar CO outflows toward the two sources with the IRAM 30m telescope observations. Toward I23151, Weigelt et al. (2006) reveal a cone-like nebulosity, which coincides with the blueshifted CO outflow, in the near-infrared band using the bispectrum speckle interferometry method. The kinematic distance of I23151 derived from the CS velocity is 5.7 kpc. The kinematic distance of I18264, suffering from an ambiguity, is either 3.5 or 12.5 kpc (Sridharan et al., 2002). By associating the region via the near- and mid-infrared surveys 2MASS and MSX on larger scales with sources of known distance, the ambiguity was solved to be at the near distance (S. Bontemps, 2003, priv com.). On the other hand, toward the line of sight of I18264, Sewilo et al. (2004) solve the kinematic distance ambiguity of an HII region with velocity of 50.9 kms-1 to be at the far distance of 12.0 kpc. For the molecular cloud with velocity of 43.6 kms-1, Sewilo et al. consider it is associated with the HII region of 50.9 kms-1 and adopt its far distance of 12.4 kpc. Since the distance determinations above both use indirect methods and still give ambiguous results, we give physical parameter estimations corresponding to both the far and near distances in the following sections. Based on the High Resolution (HIRES) IRAS database, Sridharan et al. (2002) estimate the luminosities of the two sources to be for I23151 and and respectively for the near and far distances for I18264. As additional evidence of massive star formation and outflows, Class II CH3OH and H2O maser emission toward I18264 and H2O maser emission toward I23151 is observed (Beuther et al., 2002d). Sridharan et al. (2002) detect no emission at 3.6 cm down to 1 mJy for both sources, while Zapata et al. (2006) detect 1.3 cm and 3.6 cm emission toward I18264 with a better sensitivity. After a description of observations in Sect. 2, we show results in Sect. 3. Discussion is presented in Sect. 4, and we conclude in Sect. 5.
2 Observations
The observations of I18264 and I23151 were carried out during August 2003 to November 2003 using the PdBI 111Based on observations carried out with the IRAM Plateau de Bure Interferometer. IRAM is supported by INSU/CNRS (France), MPG (Germany) and IGN (Spain).. At the 3mm wave band, the spectral correlator was set to sample the SiO (v=0, J=2-1) and H13CO+ (J=1-0) lines with a bandwidth of 40 MHz. In addition, two wide bands of 320 MHz were set to observe the continuum emission, and to cover the SiO and H13CO+ lines as well. Taking advantage of the dual frequency operation, we set the correlator to the CN (J=2-1) line using a bandwidth of 40 MHz, and two 320 MHz wide bands at the 1mm band for continuum. The CN (2-1) emission was not detected. Except for observations toward I23151 on 2003 December 9, all the tracks were carried out in weather conditions adequate for the 3mm band only. I18264 was covered with a 7-field mosaic with the pointing centers at with respect to the reference center at RA(J2000) = 18:29:14.3 and Dec(J2000) = -11:50:26. I23151 was observed with a single field with the pointing center at RA (J2000) = 23:17:21.0 and Dec (J2000) = 59:28:49.00. We used MWC349 as the primary flux calibrator, and 3C273/3C345 as the bandpass calibrators. The time dependence gain was monitored by observing 1741-038, 1830-210, and 2200+420. The visibility data were calibrated and imaged using the standard procedure in GILDAS package. The systemic velocities are 43.6 kms-1 for I18264 and -54.4 kms-1 for I23151. The nominal spectral resolution was about 0.4 kms-1 and averaged to about 1 kms-1 for SiO (2-1). The continuum rms in the 3mm band was 0.7 mJy for I18264 and 0.2 mJy for I23151.
The observations of the NH3 (1,1) and (2,2) lines were carried out on 1997 December 13 for I23151 in the D configuration, and on 2001 July 23 for I18264 in the C configuration of the VLA 222The National Radio Astronomy Observatory is operated by Associated Universities, Inc., under cooperative agreement with the National Science Foundation.. In both observations, we used the correlator mode 4 which provided 3.13 MHz bandwidth for both the left and right polarizations of the (1,1) and (2,2) lines, respectively. The spectral resolutions of the observations was 48 KHz, or 0.6 kms-1 at the NH3 line frequencies. The pointing center of the observations was RA(J2000) = 18:29:14.31, Dec(J2000) = -11:50:25.6 for I18264 and RA(J2000) = 23:17:21.10, Dec(J2000) = 59:28:48.6 for I23151. The on-source integration per source was about 1 hour. The visibility data were calibrated and imaged in the AIPS package. The left and right polarizations were averaged during imaging to reduce the noise level in the data. The synthesized beam size was about 4′′ for the I23151 images, and for I18264 images. The rms noise level is 7 mJy per 0.6 kms-1 channel.
3 Results
For both sources, we detected strong emission in SiO (J=2-1) and H13CO+ (J=1-0). I18264 has detectable ammonia emission at an rms of 7 mJy per 0.6 kms-1 channel, and I23151 was not detected in NH3 at an rms of 8 mJy per 0.6 kms-1 channel.
3.1 Millimeter Continuum sources
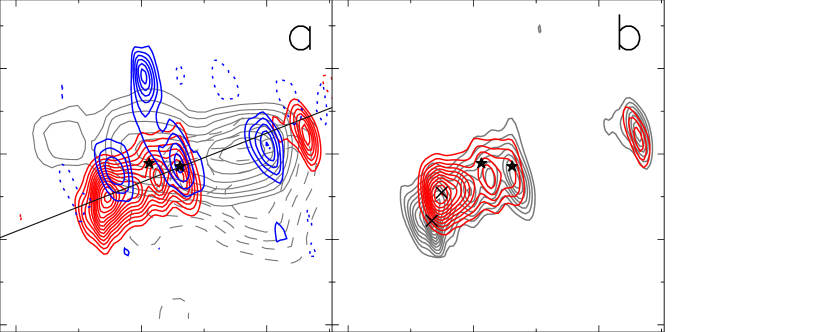
Fig. 1 presents the 3.4 mm and 1.3 mm continuum emission of the two sources. For I18264, the 1.3 mm and 3.4 mm continuum emission resolve two peaks with the stronger one in the west. While for I23151, the continuum emission remains singly peaked even at a resolution of at 1.3 mm. For both sources, the peak positions at 1.3 mm and 3.4 mm coincide well with each other. In I23151, a fan-shaped structure opening to the east can be roughly identified in the 3.4 mm continuum emission. In the 1.3 mm continuum emission, there is a discontinuous arch structure at the lowest contour level which goes from a little bit northeast to the southeast of the mm continuum peak. We will further discuss these features in Sect. 3.2. Because the weather conditions were only adequate for the 3 mm wave band during the observing seasons, we use the 3.4 mm continuum data for quantitative analysis. Assuming that the 3.4 mm continuum is mainly produced by optically thin dust emission, we can calculate the masses of the dense cores following the relation (Hildebrand, 1983), where is the flux density of the dust emission, D is the distance to the source, and is the Plank function at a dust temperature of . Sridharan et al. (2002) derive dust temperatures of 35 K for I18264 and 68 K for I23151 by graybody fits to the IRAS and mm data. Here the dust opacity per gram is taken to be THzcm2g-1 (Hildebrand, 1983), where the opacity index is set to be 1.5. The results of the calculations () are listed in Table. 1. The uncertainty of this estimation mainly comes from the determinations of and . The masses will decrease by a factor of 4 if , and increase by a factor of 2 if decreases to . The integrated flux at 3.4 mm is 0.13 Jy for I18264 and 0.029 Jy for I23151. When compared with the 1.2 mm single-dish flux (Beuther et al., 2002a), the total flux from PdBI amounts to 63% for I18264 and 56% for I23151 of the single-dish flux extrapolated from 1.2 mm using with . Some extended emission is not recovered by the interferometer.
3.2 SiO outflows
Fig. 2 presents the channel maps in SiO (2-1) in I18264, where the velocity resolution is smoothed to 5 kms-1. The SiO emission mostly appears in the redshifted channels in Fig. 2, and only the 38.6 kms-1 channel shows prominent blueshifted emission. The most remarkable feature in the channel maps is an elongated structure in the southeast. This redshifted emission has very high velocities up to 60 kms-1 with respect to the systemic velocity () 43.6 kms-1. We have examined the data from the 320 MHz band and found that there is no detectable SiO emission beyond of 110 kms-1. The integrated blue- and redshifted SiO emission is shown in Fig. 3a, where the single-dish bipolar CO outflow is resolved into two quasi-perpendicular outflows: The southeast to northwest (SE-NW) outflow and the northeast (NE) outflow. Both outflows seem to originate from the western peak of the mm continuum. Along the SE-NW outflow, both red- and blueshifted emission can be found, which is a typical feature for expanding bow shocks near the plane of the sky. From its alignment with the SE jet-like outflow, the bipolar emission in the northwest seems to be the NW lobe of the SE-NW outflow. But it is also possible that this feature is due to another low-mass (proto)star whose mass is below our detection limit. The two outflows are both well collimated with overall collimation factors for the NE outflow and for the SE-NW outflow. The estimated collimation factors should be the lower limits considering the unknown inclination angles and the spatial resolution limit. In Fig. 3b, the redshifted SiO emission is shown in two velocity ranges, i.e. the high-velocity component (HC) with velocities kms-1, and the very-high-velocity component (VHC) with velocities kms-1. The definition of the velocity ranges here is based on the morphological changes in the SiO emission in the velocity channel maps and the characteristics in the position-velocity and mass-velocity diagrams that will be discussed below. The redshifted SE outflow in the VHC is shifted toward north and its remote peak is closer to the driving source than that in the HC. We will discuss this jet-like outflow in detail in Sect. 4.3. Thanks to the continuous velocity structures in this dominant outflow, we derive the dynamical time following
where is the length of the jet-like SE outflow and is the maximum velocity of the SE outflow. Assuming the optically thin thermal SiO (2-1) emission in local thermodynamic equilibrium (LTE), we estimate the gas mass in the outflow according to
where is the permanent dipole moment, is the FWHM of the synthesized beam, is the mean atomic weight of the gas, is the mass of a hydrogen molecule, is the distance of the source, is the flux density, and other symbols have common meanings. The mean excitation temperature is estimated to be 24 K from the NH3(1,1), (2,2) emission. It should be noted that has large uncertainty since the SiO abundance can be greatly enhanced by shocks as a result of grain destruction leading to Si injection into the gas phase (Seab & Shull, 1983). In contrast to the typical SiO abundance to in dark clouds (Ziurys et al., 1989), Mikami et al. (1992) and Zhang et al. (1995) detect the SiO enhancement of four to five orders of magnitude toward the L1157 outflow. Hirano et al. (2001) estimate the SiO abundance to be to toward the multiple outflows in IRAS 16293-2422. We adopt an SiO abundance of , which corresponds to an enhancement of three to four orders of magnitude with respect to that in dark clouds. Then the outflow mass can be determined. Consequently we get the outflow rate according to
The derived results are listed in Table 1.
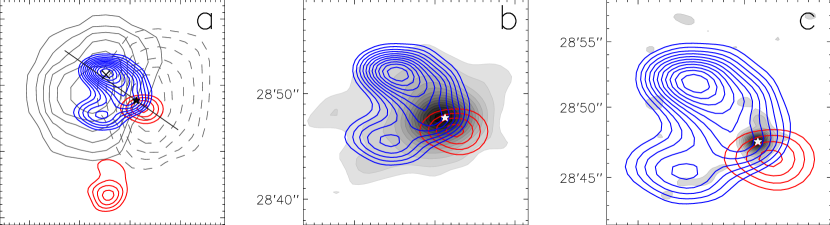
The channel maps with 1 kms-1 resolution in SiO in I23151 are presented in Fig. 4. With respect to the systemic velocity -54.4 kms-1 (), the SiO emission is mainly buleshifted and extends to the velocity kms-1. The integrated emission is shown in Fig. 5. In addition to the emission close to the mm continuum source, there is a weaker redshifted feature to the south. This is maybe an independent outflow from a low-mass (proto)star whose mass is below our detection limit. The bipolar SiO outflow seems to emanate from the mm continuum peak and coincides with the respective inner parts of the CO outflow from the single-dish observations (see Fig. 5a). The dominant buleshifted SiO outflow has a quasi-parabolic shape with the mm peak at its tip and a cavity in the center. This structure can also be identified in the channel maps, especially in the -56.4 kms-1 channel. Using the bispectrum speckle interferometry method, Weigelt et al. (2006) reveal a cone-like nebulosity in the near-infrared band with a bright near-infrared point source at the tip. This nebulosity coincides well with the quasi-parabolic SiO outflow here. In Figs. 5b and 5c the quasi-parabolic SiO outflow also coincides with the fan-shaped structure in the 3.4 mm continuum and the arch structure in the 1.3 mm continuum. The arch at 1.3 mm is detected only at level. However, the agreement with the 3.4 mm and the near-infrared image suggests that the structure is real. Similar to I18264, we derive the characteristic parameters of the SiO outflow in I23151, where is assumed to be 30 K. The results are given in Table 1.
3.3 H13CO+ condensations
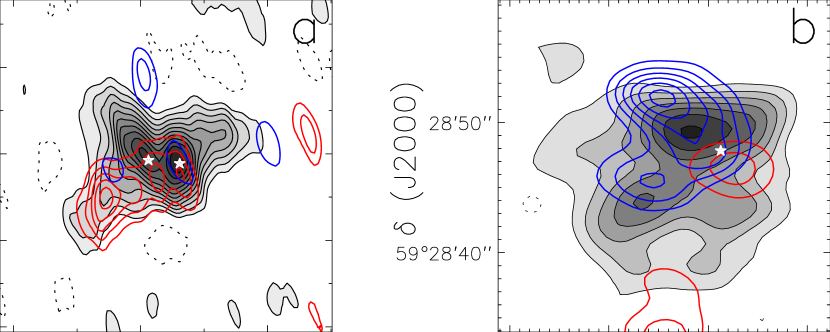
Figs. 6a and 6b present the H13CO+ channel maps with 0.4 kms-1 resolution for I18264 and I23151, respectively. In both sources, the H13CO+ emission is limited to velocity channels around the systemic velocity, which confirms that this line emission mostly traces the dense ambient gas. For I18264, the peaks of the H13CO+ emission in the slightly blue- and redshifted channels approximately coincide with the western and eastern peaks of the mm continuum, respectively. Figs. 7a and 7b present the integrated emission overlaid with the SiO outflows for the two sources. For I18264, the double peaks in the mm continuum are roughly resolved in the integrated H13CO+ emission. In addition to the condensations around the mm continuum peaks, the H13CO+ emission also shows extensions coincident with the SiO outflows. In particular the southeast elongated feature in H13CO+ coincides well with the jet-like SE SiO outflow. For I23151, the major and minor peaks in the integrated H13CO+ emission correlates well with the SiO clumps. The quasi-parabolic shaped SiO outflow also has counterparts in H13CO+, especially in the -54.0 kms-1 channel and integrated emission. The correlation between the integrated H13CO+ emission and SiO emission for the two sources suggests that the H13CO+ gas may be influenced by the outflows. Adopting an HCO+ abundance of (van Dishoeck et al., 1993) and a C to 13C ratio of 67 (Langer & Penzias, 1990), we can estimate the gas masses of the H13CO+ condensations with the similar method used in the estimation of the gas masses in the SiO outflows. The results () are listed in Table 1. Note that the masses derived from the H13CO+ emission are much larger than the core masses derived from the mm continuum. The integrated H13CO+ emission is much more extended than the interferometric mm continuum for both sources. Based on the single-dish 1.2 mm continumm observations, Beuther et al. (2002b) derive the masses and respectively for the near and far distances for I18264 and for I23151, which are consistent with the the masses of the H13CO+ condensations here. Thus the interferometric mm dust continuum probably traces the densest cores, filtering out most emission and hence yielding less masses, whereas the H13CO+ traces lower density gas and may even be slightly optically thick. In addition, the H13CO+ emission is obviously affected by the outflows and HCO+ and H13CO+ can be enhanced by shocks. Toward the bipolar molecular outflow of L1157, Bachiller & Gutiérrez (1997) detect the abundance of HCO+ to be enhanced by a factor of . Jørgensen et al. (2004) reveal an HCO+ abundance of in the NGC 1333 outflow region. Girart et al. (2005) derive an averaged HCO+ abundance of over the core located ahead of HH2. Thus the abundance of HCO+ can be enhanced by a factor of . Assuming the H13CO+ to HCO+ ratio to be constant, the abundance of H13CO+ may be underestimated, and consequently the mass is overestimated by a factor of .
3.4 Ammonia emission
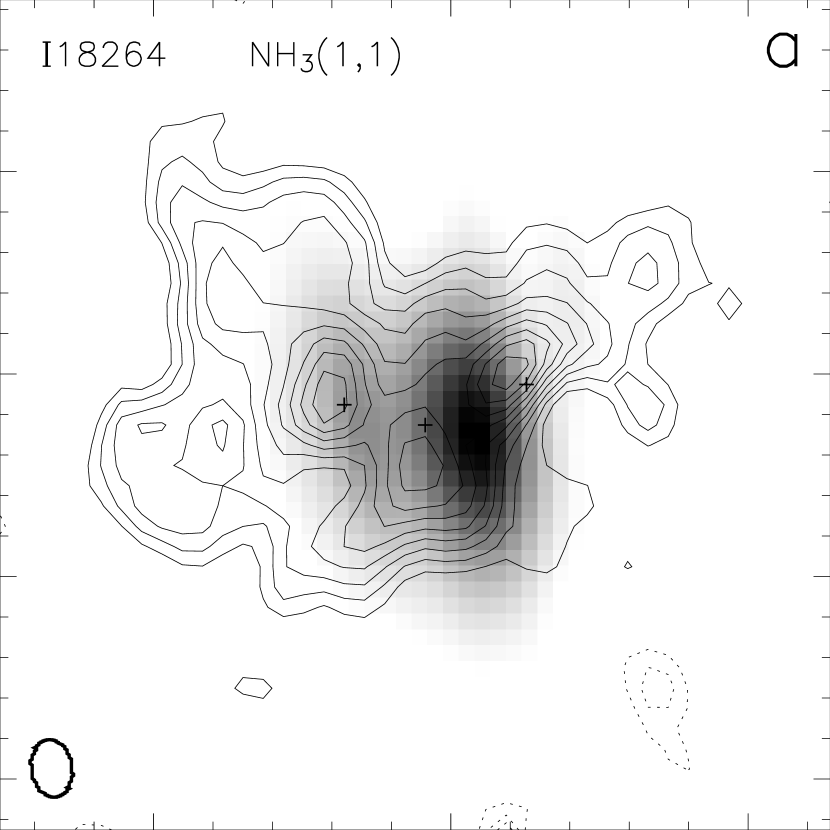
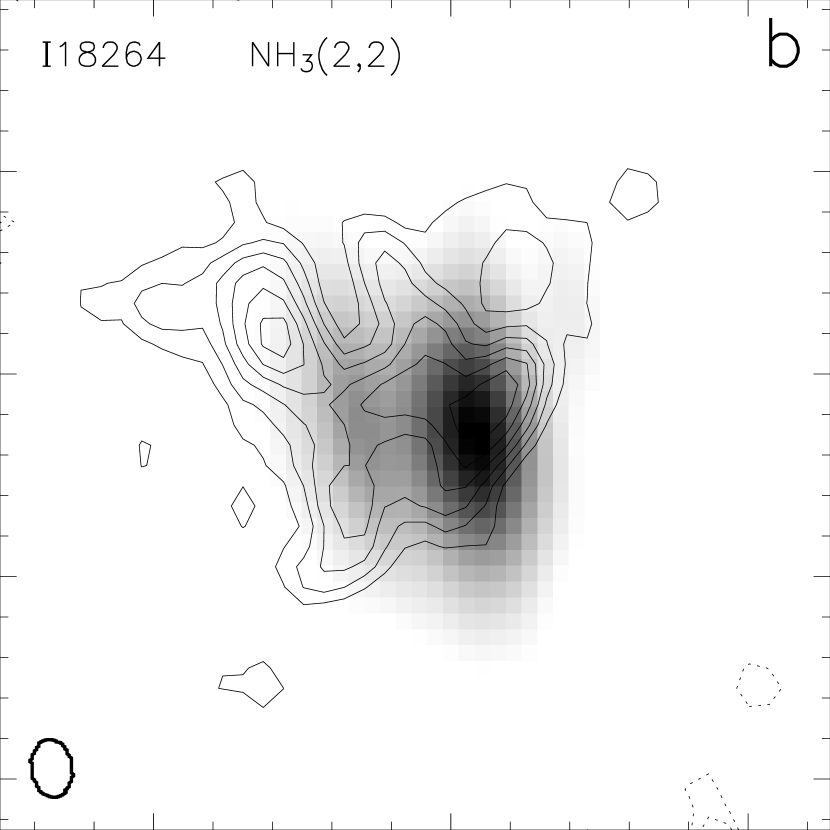
Sridharan et al. (2002) detected the NH3(J,K)=(1,1), (2,2) inversion lines toward I18264 with the Effelsberg 100m telescope. The NH3 emission toward I23151 was also detected with the Effelsberg telescope, but is about an order of magnitude weaker than for I18264 (Beuther, priv com.). With the VLA we observed the NH3(1,1) and (2,2) lines toward the two regions and detected the NH3(1,1) and (2,2) emission only in I18264. We derive the optical depth for the main component of the NH3(1,1) line and the rotational temperature (2,2:1,1) (Ho & Townes, 1983) at three positions as denoted in Fig. 8a. The kinetic temperature can be estimated according to
where and are the rates of collisional transition between the levels (2,2),(2,1) and (1,1) (Walmsley & Ungerechts, 1983; Danby et al., 1988). The excitation temperature is determined following
where is the brightness temperature of the main component of the NH3(1,1) line. Then the gas density can be calculated according to
where and are the Einstein coefficient and the collision rate, respectively (Ho & Townes, 1983). The results derived from the ammonia emission are listed in Table 2. The derived mean rotation temperature 26 K is a little higher than that of 18 K derived by Sridharan et al. (2002), and the mean kinetic temperature 36 K is approximately equal to the dust temperature (Sridharan et al., 2002). In Fig. 8, there are peaks in NH3(1,1) and (2,2) approximately coincident the mm continuum peaks. It seems that NH3(1,1) and (2,2) lines trace a more extended envelope than the mm continuum. The derived gas density is cm-3 and the intrinsic line width (FWHM) is kms-1.
4 Discussion
4.1 Outflow Energetics
In I18264, the SiO emission reveals two quasi-perpendicular molecular outflows emanating from the western mm peak. The mass estimated from the mm continuum is as high as 570 and 7300 respectively for the near and far distances even with a fraction of the flux being filtered out by the interferometer. Since the western peak is much stronger than the eastern one, most of the mass is attributed to the western peak. To check the missing short spacings, the convolved PdBI SiO data have been compared with the single-dish SiO data observed with the IRAM 30m telescope (Beuther, priv com.). We find that at channels around the systemic velocity 43.6 kms-1, less than 34% of the SiO flux is filtered out by the interferometer. While at channels above of 50 kms-1, no missing short spacing problem occurs. The outflow mass for I18264 in Table 1 is derived from channels of kms-1 () and kms-1 (), which are both 3 kms-1 apart from the systemic velocity. So the derived outflow mass for I18264 does not suffer much from missing short spacings, and the results are comparable to that derived from the single-dish CO observations (Beuther et al., 2002c). From the SiO channel maps and the integrated emission is mostly due to the jet-like SE outflow, and gives mass outflow rates of and for the near and far distances, respectively. With the assumption of the momentum conservation between the observed outflow and the internal jet, and adopting a typical jet velocity of 500 kms-1, the mass loss rates caused by the underlying jet or wind are respectively about and . Assuming further a ratio between the mass loss rate and accretion rate of approximate 1/3 (Shu et al., 1987; Tomisaka, 1998), we get accretion rates of and respectively for the near and far distances. Such accretion rates are high enough to overcome the radiation pressure of the central (proto)star and form most massive stars (Wolfire & Cassinelli, 1987; Jijina & Adams, 1996; Yorke & Sonnhalter, 2002). For I23151, the estimation from the mm continuum gives a core of 170 . With the same assumptions as for I18264, the outflow rate will lead to an accretion rate of . According to the comparison between the convolved PdBI SiO data and that from the IRAM 30m single-dish observations (Beuther, priv com.), about of the flux is filtered out by the interferometer for most velocity channels. Considering the missing flux due to the missing short spacings and the outflow mostly being blueshifted, the accretion rate can be underestimated. Then the accretion rate for I23151 can also be high enough to overcome the radiation pressure and form massive stars (Wolfire & Cassinelli, 1987; Jijina & Adams, 1996; Yorke & Sonnhalter, 2002).
4.2 Mass-velocity diagrams
Outflows associated with low-mass young stellar objects (YSOs) usually exhibit a “mass spectrum” (e.g. Chandler et al., 1996; Lada & Fich, 1996). The power law index is typically (Lada & Fich, 1996), although the slope often steepens at velocities greater than 10 kms-1 from the systemic velocity. From a compilation of 22 sources with luminosities ranging from 0.58 to , Richer et al. (2000) find that at velocities below 10 kms-1 is similar, while at velocities above 10 kms-1, is for low-mass YSOs and for luminous YSOs. Toward a sample of 11 objects with luminosities at a distance of 2 kpc, Ridge & Moore (2001) do not find a correlation between mass-spectrum slope and bolometric luminosity nor a clear separation between s measured for the high velocity and low velocity emission. Su et al. (2004) also study the mass-velocity diagrams of outflows of two luminous YSOs and find a change in slope at a break-point velocity of 10 kms-1. They suggest that the high velocity ( kms-1) gas may drive the low velocity ( kms-1) gas. With the assumption of the optically thin SiO thermal emission in LTE, we derive the mass-velocity diagrams for the SiO outflows for the two sources (see Fig. 9). Since the SiO emission is dominantly redshifted in I18264 and blueshifted in I23151, we derive the mass-velocity relations in the corresponding wings for the two sources. The redshifted emission in I18264 is mostly attributed to the SE outflow. So Fig. 9a represents the mass-velocity relationship of the HC of the SE outflow and can be fitted by a broken power law with the index steepening from to at kms-1. The mass distribution in the velocity channels of the VHC of the SE outflow has large scatters and can hardly be described by a linear fit. Similarly, the blueshifted lobe of the SiO outflow in I23151 is also fitted by a broken power law with for kms-1 and for kms-1. From three dimensional simulations of a dense molecular jet penetrating a dense molecular medium, Smith et al. (1997) predict the change in slope at high velocities due to a jet-bow shear layer consisting of molecules which survived the jet terminal shock. Models of material being accelerated by jet-driven bow shocks (Downes & Ray, 1999) have reproduced a power law relationship between mass and velocity with increasing with decreasing molecular abundance in the jet. However, Downes & Ray (1999) give an upper limit of 3.75 for , which is much less than the observed values. Therefore the physical origin is still unclear for the broken power law of the mass-velocity diagrams.
4.3 Kinematics
The SiO in the gas phase of molecular outflows can be produced through the sputtering of Si-bearing material in grains, where the sputtering is driven by neutral particle impact on charged grains in shocks (Schike et al., 1997). In Fig. 7a, the jet-like SE outflow in I18264 coincides well with the H13CO+ structure extending to the southeast, suggesting the SiO emission in this region may arise from the interaction between the shocks driven by the jet or wind from the central (proto)star and the dense ambient gas clump. Such an interaction mainly exists in the redshifted lobe since the SiO emission is dominantly redshifted. In Fig. 10a, the SiO line at the downstream peak of the HC of the SE outflow (denoted as the southern cross in Fig. 3b) shows a profile with a steep decrease toward the systemic velocity and a gradual redshifted wing, which suggests the SiO enhancement arising from the quiescent material accelerated by the shock when the jet or wind impinges into the dense ambient gas. We have checked the corresponding single-dish SiO spectrum and find that such a profile also exists. So the steep decrease toward the systemic velocity can not be due to the missing short spacings. This kind of SiO profiles and interactions have been observed toward several low-mass outflows (e.g. Zhang et al., 1995; Hirano et al., 2001). The line profile at the downstream peak of the VHC (denoted as the northern cross in Fig. 3b) shows a very broad plateau in the redshifted wing with velocities up to about 60 kms-1 from the systemic velocity (see Fig. 10b). Such a broad plateau is consistent with the flattened mass spectrum of the VHC in the mass-velocity diagram. For I23151, there is a good correlation between the SiO clumps and the integrated H13CO+ peaks. The SiO line at the peak of the blueshifted lobe (denoted as a cross in Fig. 5) also shows a profile of a steep drop toward the systemic velocity and a gradual decline in the blueshifted wing (see Fig. 10c), and this profile is confirmed in the single-dish data. So the SiO emission in I23151 can also arise from the interaction between the jet or wind driven by the central (proto)star and the dense ambient gas.
Toward several low luminosity sources (e.g., L1448, Guilloteau et al. (1992); NGC 2264G, Lada & Fich (1996)), it is observed that the flow velocity increases with distance from the driving source. On the contrary, Zhang et al. (2000) find the SiO outflow velocities in L1157 decreasing toward the clumps farther away from the driving source. Also considering the different orientations of the different pairs of SiO clumps, they explain this in terms of multiple shocks driven by a processing and episodic jet. The downstream peak of the HC of the SE outflow in I18264 is farther away from the driving source than that of the VHC, which is similar to the SiO outflow in L1157. And the VHC of this outflow is northward offset from the HC. We suggest that the SE outflow is driven by a precessing jet. In this scenario, the lower velocities of the HC as compared with the VHC imply a deceleration of the underlying jet after travelling a larger distance; The VHC is younger and driven by newly formed shocks when the underlying jet is precessing to the north, and its flattened mass spectrum and the very broad line width suggest it does not experience significant deceleration. In addition, the VHC of the northwest SiO clump is also slightly shifted to the south of the HC, and both the VHC and HC align in line with the VHC and HC of the SE outflow, respectively. This also suggests the precessing scenario. Most recently, the VLA observations by Zapata et al. (2006) resolve the western mm peak in I18264 into triple sources at 1.3 cm and 7 mm. One of the three sources shows a slightly rising spectral index between 3.6 cm and 1.3 cm and a flux density at 7 mm larger than the value extrapolated from the 3.6 cm and 1.3 cm observations. Zapata et al. (2006) suggest this source to be a combination of a thermal jet and disk. This is consistent with our interpretation that the SE outflow being driven by a precessing jet.
In case of I23151, the SiO outflow in I23151 traces the inner parts of the large bipolar CO outflow despite the additional feature to the south. As described above, the blueshifted outflow is revealed as a quasi-parabolic structure, which is coincident with the similar structures in the 3.4 mm continuum and H13CO+ line emission and also coincident with the near-infrared cone-like nebulosity by Weigelt et al. (2006). Apparently, this can be interpreted as the molecular outflow being entrained by a wide-angle wind, where the low-intensity SiO emission in the central region of the cone is due to the cavity cleared by the wind while the enhanced SiO emission at the base of the outflow is caused by the interaction between the wind and the ambient material in the wall of the cavity. Weigelt et al. (2006) also reveal a bright point source at the tip of the cone-like nebulosity. As the point source locating at the center of the single-dish 1.2 mm peak, Weigelt et al. (2006) suggest it to be the protostar driving an outflow traced by the nebulosity. The astrometry of the point source is (RA, DEC)(J2000)=(23:17:21.02, 59:28:48.0) from the comparison of the speckle image with the 2MASS images and 2MASS All-Sky Catalog of Point Sources. The position of the mm peak of our PdBI observations is (RA, DEC)(J2000)=(23:17:20.88, 59:28:47.7). Considering the 2MASS positional accuracy of , the PdBI mm peak can be the same as the near-infrared point source. But it is also possible that the offset is real and the very bright near-infrared point source is too evolved to be a protostar and the driving source of the outflow corresponds to the interferometric mm peak which is not resolved in the single-dish 1.2 mm continuum with an resolution.
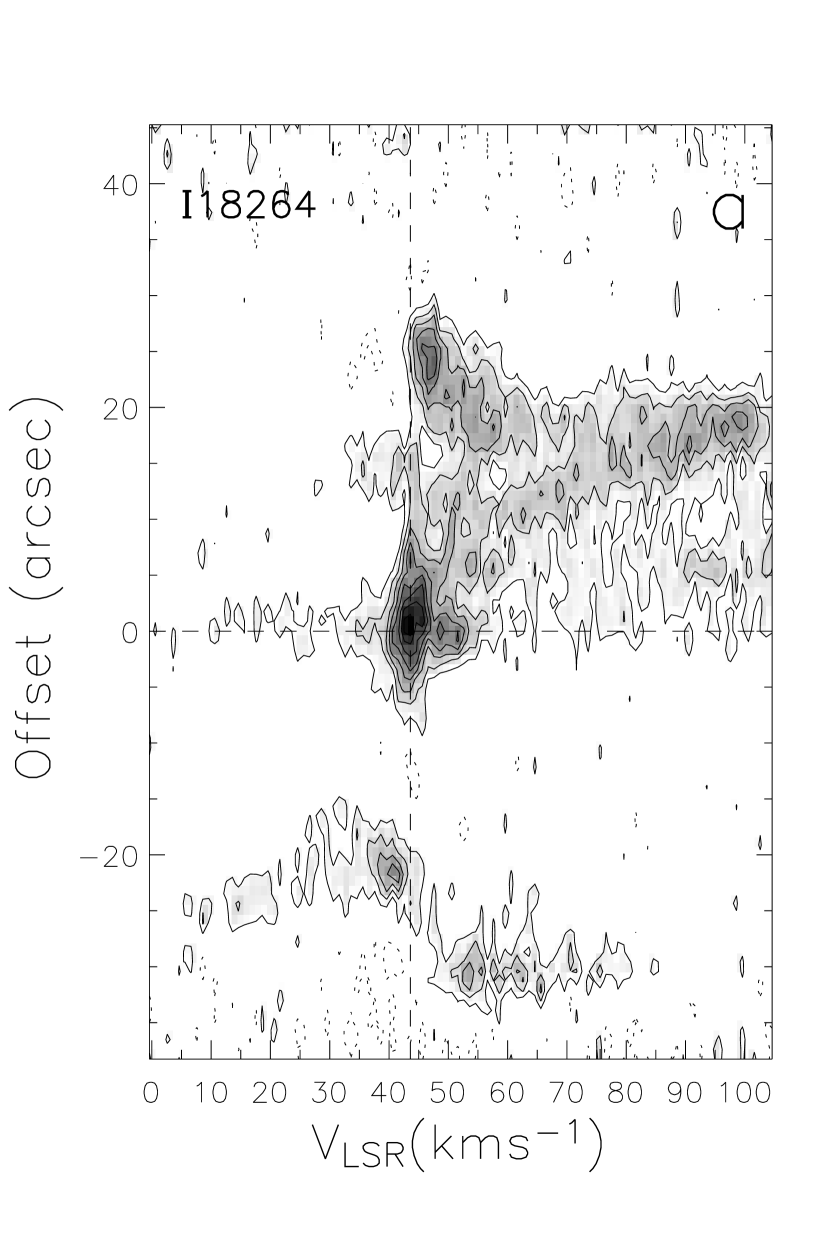
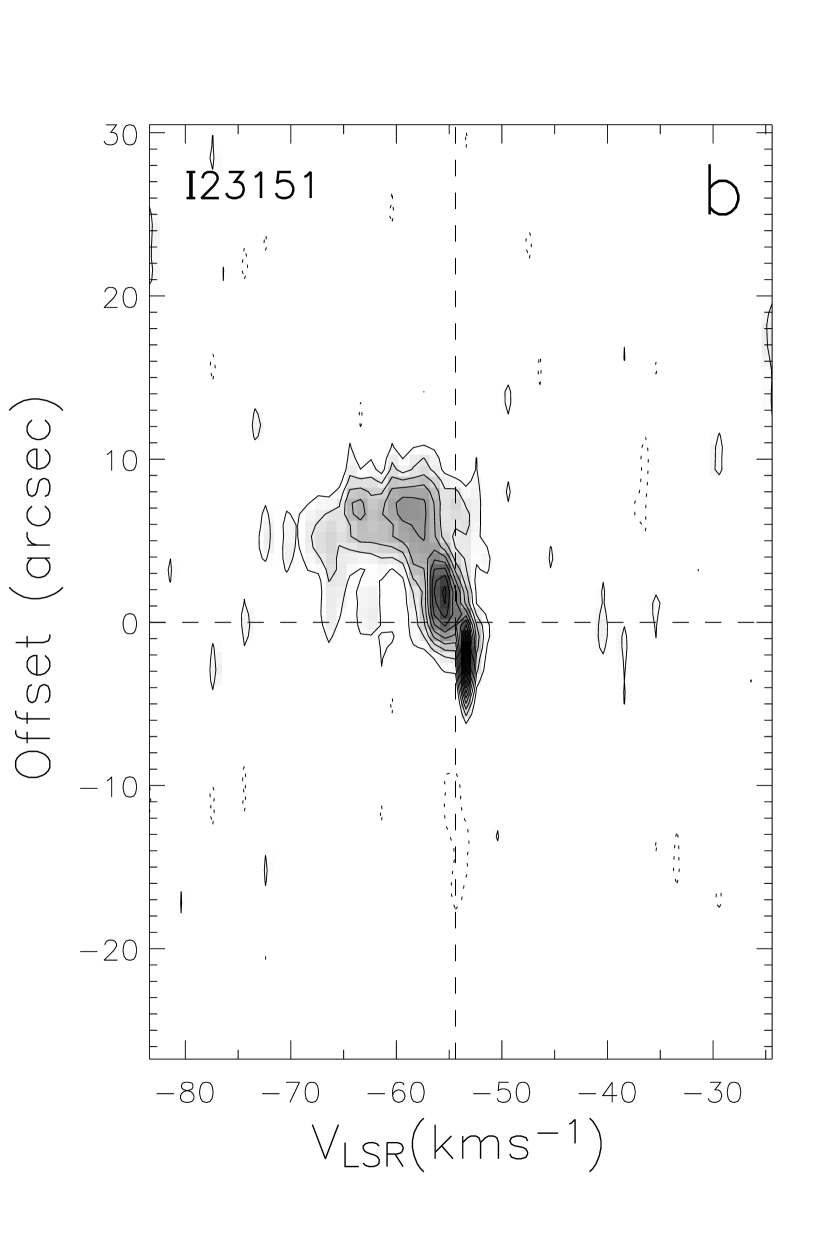
The position-velocity (PV) diagrams of the SiO outflows along the axes marked in Fig. 3a and Fig. 5a are shown in Fig. 11. For I18264, in addition to the feature around the driving source with velocities near the systemic velocity, there are mainly two components in the PV diagram: the component with velocities increasing linearly with the distance from the driving source; the component farther away from the driving source with maximum velocities decreasing with the increasing distance. Compared with the channel maps in Fig. 2, we can find that these two components correspond to the VHC and HC of the SE outflow in Fig. 3b. There is a pair of faint feature centered at about , which corresponds to the NW lobe of the SE-NW outflow. The velocity structure of the peak emission of the VHC follows the so called “Hubble law” and can be explained in terms of bow-shock acceleration. This is compatible with the interpretation that the VHC is excited by the newly formed shocks without undergoing significant deceleration. If the broken power law is caused when the low velocity ( kms-1) gas comprises ambient gas entrained by the high velocity ( kms-1) gas (Su et al., 2004), the high velocity gas should inject momentum into the low velocity gas and decelerate when it travels downstream. This scenario is in agreement with the velocity structure of the HC in the PV diagram of I18264, where the maximum velocities decrease with the distance from the driving source. For I23151, the PV diagram roughly follows the Hubble law. At the position about from the driving source, emission features have a relatively wide range of velocities.
5 Conclusions
We carry out a study of SiO outflows toward the high-mass star forming regions I18264 and I23151. According to the H13CO+ observations and SiO line profiles, the SiO emission in these two sources can be caused by the interaction between the jet or wind from the central young stars and the dense ambient gas. The mass-velocity relation of the HC of the SE outflow in I18264 and the blueshifted outflows in I23151 also can be fitted by a broken power law with the slopes steeping at about 10 kms-1 with respective to the systemic velocity. With the PV characteristic of the terminal velocities decreasing with the distance from the driving source, the low velocity ( kms-1) gas probably comprises the ambient gas entrained by the high velocity ( kms-1) gas.
Toward I18264, at least two quasi-perpendicular outflows with high collimation factors () are resolved. The VHC of the SE outflow has very high velocities up to kms-1. It is north offset from the HC, and its downstream peak is farther away from the driving source. Comparing with the outflows in the well studied low-mass source L1157, we suggest the SE outflow can be entrained by an underlying precessing jet. The characteristics of the HC and VHC of the SE outflow in the mass-velocity and PV diagrams also support the processing jet scenario. For I23151, the blueshifted SiO emission traces a quasi-parabolic shaped outflow which can be identified in the 3.4 mm continuum and H13CO+ emission and coincide with the near-infrared nebulosity in the literature. This outflow can be interpreted as the molecular gas entrained by the underlying wide-angle wind.
The core masses estimated from the 3.4 mm continuum are 570 and 7300 respectively for the near and far distances for I18264 and 170 for I23151. With the assumption of the momentum conservation between the outflow and the driving agent, the estimated outflow rates lead to accretion rates of and respectively for the near and far distances for I18264 and for I23151. Taking into account the missing flux due to the the missing short spacings for I23151, the accretion rate in this region should be higher. Thus for both sources the accretion rates are high enough to overcome the radiation pressure from the central objects and form massive stars.
To summarize, our molecular outflow data derived from high resolution observations toward two luminous sources show morphologies and kinematics similar to those of the low-mass sources. The outflows can be interpreted by jet or wide-angle wind entrainment models. The presented data and analysis further support that massive stars up to () form via disk mediated accretion processes as low-mass stars.
References
- Bachiller & Gutiérrez (1997) Bachiller, R. & Gutiérrez, M. P. 1997, ApJ, 487, L93
- Bally & Zinnecker (2005) Bally, J. & Zinnecker, H. 2005, AJ, 129, 2881
- Beuther et al. (2004) Beuther, H., Schilke, P., & Gueth, F. 2004, ApJ, 608, 330
- Beuther et al. (2002a) Beuther, H., Schilke, P., Gueth, F., McCaughrean, M., Andersen, M., Sridharan, T. K., & Menten, K. M. 2002a, A&A, 387, 931
- Beuther et al. (2002b) Beuther, H., Schilke, P., Menten, K. M., Motte, F., Sridharan, T. K., & Wyrowski, F. 2002b, ApJ, 566, 945
- Beuther et al. (2002c) Beuther, H., Schilke, P., Sridharan, T. K., Menten, K. M., Walmsley, C. M., & Wyrowski, F. 2002c, A&A, 383, 892
- Beuther et al. (2003) Beuther, H., Schilke, P., & Stanke, T. 2003, A&A, 408, 601
- Beuther et al. (2002d) Beuther, H., Walsh, A., Schilke, P., Sridharan, T. K., Menten, K. M., & Wyrowski, F. 2002d, A&A, 390, 289
- Bonnell et al. (1998) Bonnell, I. A., Bate, M. R., & Zinnecker, H. 1998, MNRAS, 298, 93
- Bonnell et al. (2004) Bonnell, I. A., Vine, S. G., & Bate, M. R. 2004, MNRAS, 349, 735
- Cesaroni et al. (1999) Cesaroni, R., Felli, M., Jenness, T., Neri, R., Olmi, L., Robberto, M., Testi, L., & Walmsley, C. M. 1999, A&A, 345, 949
- Chandler et al. (1996) Chandler, C. J., Terebey, S., Barsony, M., Moore, T. J. T., & Gautier, T. N. 1996, ApJ, 471, 308
- Danby et al. (1988) Danby, G., Flower, D. R., Valiron, P., Schilke, P., & Walmsley, C. M. 1988, MNRAS, 235, 229
- Downes & Ray (1999) Downes, T. P. & Ray, T. P. 1999, A&A, 345, 977
- Garay & Lizano (1999) Garay, G. & Lizano, S. 1999, PASP, 111, 1049
- Gibb et al. (2003) Gibb, A. G., Hoare, M. G., Little, L. T., & Wright, M. C. H. 2003, MNRAS, 339, 1011
- Girart et al. (2005) Girart, J. M., Viti, S., Estalella, R., & Williams, D. A. 2005, A&A, 439, 601
- Guilloteau et al. (1992) Guilloteau, S., Bachiller, R., Fuente, A., & Lucas, R. 1992, A&A, 265, L49
- Hildebrand (1983) Hildebrand, R. H. 1983, QJRAS, 24, 267
- Hirano et al. (2001) Hirano, N., Mikami, H., Umemoto, T., Yamamoto, S., & Taniguichi, Y. 2001, ApJ, 547, 899
- Ho & Townes (1983) Ho, P. T. P. & Townes, C. H. 1983, ARA&A, 21, 239
- Hunter et al. (1999) Hunter, T. R., Testi, L., Zhang, Q., & Sridharan, T. K. 1999, AJ, 118, 477
- Jijina & Adams (1996) Jijina, J. & Adams, F. C. 1996, ApJ, 462, 874
- Jørgensen et al. (2004) Jørgensen J. K., Hogerheijde, M. R., Blake, G. A., van Dishoeck, E. F., Mundy, L. G., & Schöier, F. L. 2004, A&A, 415, 1021
- Keto (2003) Keto, E. 2003, ApJ, 599, 1196
- Krumholz et al. (2005a) Krumholz, M. R., McKee, C. F., & Klein, R. I. 2005a, Nature, 438, 332
- Krumholz et al. (2005b) Krumholz, M. R., McKee, C. F., & Klein, R. I. 2005b, ApJ, 618, L33
- Kumar et al. (2004) Kumar, M. S. N., Tafalla, M., & Bachiller, R. 2004, A&A, 426, 195
- Lada & Fich (1996) Lada, C. J. & Fich, M. 1996, ApJ, 459, 638
- Langer & Penzias (1990) Langer, W. & Penzias, A. 1990, ApJ, 357, 477
- McKee & Tan (2002) McKee, C. F. & Tan, J. C. 2002, Nature, 416, 59
- McKee & Tan (2003) McKee, C. F. & Tan, J. C. 2003, ApJ, 585, 850
- Mikami et al. (1992) Mikami, H., Tomofumi, U., Yamamoto, S., & Saito, S. 1992, ApJ, 392, L87
- Norberg & Maeder (2002) Norberg, P. & Maeder, A. 2000, A&A, 359, 1025
- Quillen et al. (2005) Quillen, A. C., Thorndike, S. L., Cunningham, A., Frank, A., Gutermuth, R. A., Blackman, E. G., & Pipher, J. L. 2005, ApJ, 632, 941
- Richer et al. (2000) Richer, J., Shepherd, D., Cabrit, S, Bachiller, R., & Churchwell, E. 2000, in Protostars and Planets IV, ed. V. Mannings, A. Boss, & S. Russell (Tucson: Univ. Arizona Press), 867
- Ridge & Moore (2001) Ridge, N. A. & Moore, T. J. T. 2001, A&A, 378, 495
- Schike et al. (1997) Schike, P., Walmsley, C. M., Pineau des Forêts, G., & Flower, D. R. 1997, A&A, 321, 293.
- Seab & Shull (1983) Seab, C. G. & Shull, J. M. 1983, ApJ, 275, 652
- Sewilo et al. (2004) Sewilo, M., Watson, C., Araya, E., Churchwell, E., Hofner, P., & Kurtz, S. 2004, ApJS, 154, 554
- Shepherd & Churchwell (1996) Shepherd, D. S. & Churchwell, E. 1996, ApJ, 472, 225
- Shepherd & Kurtz (1999) Shepherd, D. S. & Kurtz, S. E. 1999, ApJ, 523, 690
- Shepherd et al. (2003) Shepherd, D. S., Testi, L., & Stark, D. P. 2003 ApJ, 584, 882
- Shepherd et al. (2000) Shepherd, D. S., Yu, K. C., Bally, J., & Testi, L. 2000, ApJ, 535, 833
- Shu et al. (1987) Shu, F. H., Adams, F. C., & Lizano, S. 1987, ARA&A, 25, 23
- Smith et al. (1997) Smith, M. D., Suttner, G., & Yorke, H. W. 1997, A&A, 323, 223
- Sollins et al. (2004) Sollins, P. K., Hunter, T. R., Battat, J., Beuther, H., Ho, P. T. P., Lim, J., Liu, S. Y., Ohashi, N., Sridharan, T. K., Su, Y. N., Zhao, J.-H., and Zhang, Q. 2004, ApJ, 616, L35
- Sridharan et al. (2002) Sridharan, T. K., Beuther, H., Schilke, P., Menten, K. M., & Wyrowski, F. 2002, ApJ, 566, 931
- Stahler et al. (2000) Stahler, S. W., Palla, F., & Ho, P. T. P. 2000, in Protostars and Planets IV, ed. V. Mannings, A. Boss, & S. Russell (Tucson: Univ. Arizona Press), 867
- Su et al. (2004) Su, Y.-N., Zhang, Q., & Lim, J. 2004, ApJ, 604, 258
- Tomisaka (1998) Tomisaka, K. 1998, ApJ, 502, L163
- van Dishoeck et al. (1993) van Dishoeck, E. F., Blake, G. A., Drain, B. T., & lunine, J. I. 1993, in Protostars and Planets III (The University of Arizona Press)
- Walmsley & Ungerechts (1983) Walmsley, C. M. & Ungerechts, H. 1983, A&A, 122, 164
- Weigelt et al. (2006) Weigelt, G., Beuther, H., Hofmann, K.-H., Meyer, M. R., Preibisch, Th., Schertl, D., Smith, M. D., & Young, E. T. 2006, A&A, 655, 665
- Wolfire & Cassinelli (1987) Wolfire, M. G. & Cassinelli, J. P. 1987, ApJ, 319, 850
- Yorke & Sonnhalter (2002) Yorke, H. W. & Sonnhalter, C. 2002, ApJ, 569, 846
- Zapata et al. (2006) Zapata, L. A., Rodriguez, L. F., Ho, P. T. P., Beuther, H., & Zhang, Q. 2006, AJ, 131, 939
- Zhang et al. (2000) Zhang, Q., Ho, P. T. P., & Wright, M. C. H. 2000, AJ, 119, 1345
- Zhang et al. (1995) Zhang, O., Ho, P. T. P., Wright, M. C. H., & Wilner, D. J. 1995, ApJ, 451, L71
- Zhang et al. (2005) Zhang, Q., Hunter, T. R., Brand, J., Sridharan, T. K., Cesaroni, R., Molinari, S., Wang, J., Kramer, M. 2005, ApJ, 625, 864
- Zhang et al. (2001) Zhang, Q., Hunter, T. R., Brand, J., Sridharan, T. K., Molinari, S., Kramer, M. A., & Cesaroni, R. 2001, ApJ, 552, L167
- Ziurys et al. (1989) Ziurys, L. M., Friberg, P., & Irvine, W. M. 1989, ApJ, 343, 201


| aamasses of the dust-gas cores derived from the 3.4 mm continuum emission | bbmasses of the dense ambient gas derived from the H13CO+ emission | ccoutflow masses derived from the blueshifted SiO emission | ddoutflow masses derived from the redshifted SiO emission | eetotal outflow masses derived from the sum of the bule- and redshifted outflow masses | ffmass outflow rates derived from for I18264 and from for I23151 | ggdynamical time scale | ||
|---|---|---|---|---|---|---|---|---|
| (kpc) | () | () | () | () | () | () | () | |
| I18264 | 3.5 | 570 | 3900 | 3.2 | 17 | 20.2 | 34 | 0.5 |
| 12.5 | 7300 | 50000 | 41 | 220 | 261 | 120 | 1.8 | |
| I23151 | 5.7 | 170 | 860 | 2.2 | 0.5 | 2.7 | 2.3 | 1.2 |
| positionaamarked as pluses in the left panel of Fig. 8 | ||||||
|---|---|---|---|---|---|---|
| (K) | (K) | (K) | ( cm-3) | (kms | ||
| left | 4.0 | 24 | 23 | 30 | 1.6 | 3.1 |
| middle | 2.7 | 30 | 25 | 45 | 1.0 | 1.9 |
| right | 2.7 | 24 | 24 | 32 | 1.6 | 2.5 |
| meanbbaveraged from the three positions | 3.1 | 26 | 24 | 36 | 1.4 | 2.5 |