Observational evidence for a changing tilt of the accretion disk with respect to the orbital plane in Her X-1 over its 35 day cycle
Abstract
Aims. Analysis and interpretation of the Her X-1 X-ray light curve obtained with the ASM onbord RXTE over the period 1996 February to 2004 September.
Methods. We construct the averaged X-ray light curves by means of adding up light curves corresponding to different 35 day cycles. A numerical model is introduced to explain the properties of the averaged light curves.
Results. We report that the features found previously in the averaged X-ray lightcurve are confirmed by the new RXTE/ASM data. In particular, anomalous dips and post-eclipse recoveries in two successive orbits in the short-on state are found to be prominent and stable details of the light curve. We argue that a change of the tilt of the accretion disk over the 35 d period is necessary to account for these features and show that our numerical model can explain such a behavior of the disk and reproduce the observed details of the light curve.
Key Words.:
accretion, accretion disks– stars:binaries:general – X-rays: general – X-rays: stars1 Introduction
Her X-1/HZ Her is a close binary system with a 1.7 d orbital period consisting of an accretion powered 1.24 s X-ray pulsar (Giacconi et al., 1973; Tananbaum et al., 1972) and an optical companion – a main sequence star of spectral type A/F (Crampton, 1974). The X-ray flux of the source shows a 35 d periodicity which is thought to be due to a counter-orbitally precessing tilted accretion disk around the neutron star (Gerend & Boynton, 1976).
The main feature of the X-ray light curve is the alternation between on (high X-ray flux) and off (low X-ray flux) states. The 35 d cycle contains two on states – the main-on (7 orbital periods) and the short-on (5 orbital cycles) – separated by 4-5 orbital cycles. The maximum X-ray flux of the main-on is 5 times higher than that in the maximum of the short-on. The off states are usually explained by periodic obscuration of the X-ray source by the disk which most likely has a twisted form (Gerend & Boynton, 1976).
According to the generally accepted model (see e.g. Schandl & Meyer, 1994; Kuster et al., 2005, and references therein) the main-on state starts when the outer disk rim opens the line of sight to the source. Subsequently, at the end of the main-on state the inner part of the disk (that may be surrounded by a hot rarefied corona) covers the source from the observer. This picture seems to be confirmed by spectral analysis. The opening of the X-ray source is accompanied by notable spectral changes including evidence for the presence of a strong absorption, whereas the decrease in X-ray intensity occurs more slowly and without appreciable spectral changes (Giacconi et al. 1973; Kuster et al. 2005, see however Oosterbroek et al. 2000).
The transition from the off to the main-on state is usually called the turn-on of the source. An interesting fact is that turn-ons occur near orbital phases 0.2 or . This behavior has been explained by Levine & Jernigan (1982) and Katz et al. (1982). These authors assumed that the disk undergoes a wobbling with half synodal period due to tidal torques. At and the angle between the disk plane and the observer’s line of sight changes most rapidly.
From the data described above it follows that the duration of the 35 d cycle is a half-integer number of orbital cycles. Observations show that in most cases the duration of 35 d cycles is 20, 20.5 or 21 orbital cycles (Staubert et al., 1983, 2006a).
Another interesting feature of the X-ray light curve is a sudden decrease in flux accompanied by significant spectral changes – the X-ray dips. The dips were observed many times by different instruments (Shakura et al., 1999, and references therein). X-ray dips can be separated into three groups: pre-eclipse dips, which are observed in the first several orbits after X-ray turn-on, and march from a position close to the eclipse toward earlier orbital phase in successive orbits; anomalous dips, which are observed at and post-eclipse recoveries, which are occasionally observed as a short delay (up to a few hours) of the egress from the X-ray eclipse in the first orbit after turn-on.

Several physical models have been proposed to explain the origin and properties of the X-ray dips. For example, in many models (Crosa & Boynton, 1980; Gorecki et al., 1982; Leahy, 1997; Schandl, 1996) the dips are caused by thickening of the outer rim of the accretion disk due to interaction with the accretion stream; Vrtilek & Halpern (1985) suggested that the dips are produced by the accretion stream above and below the disk (see also Bochkarev & Karitskaia, 1989). However, these models made various assumptions about the disk parameters (for example, in the original model by Crosa and Boynton the disk size was uncomfortably large to explain the X-ray dip marching behaviour).
Another model for X-ray dips was proposed by Shakura et al. (1999) In this model pre-eclipse dips occur when the accretion stream crosses the observer’s line of sight before entering the disk. This can happen only if the stream is non-coplanar to the systems orbital plane. The reason for the stream to move out of the orbital plane is non-uniform X-ray heating of the optical stars atmosphere by the X-ray source, which produces a temperature gradient near the inner Lagrange point. The non-uniformity of the heating comes from the partial shadowing of the optical star surface by the accretion disk. Furthermore, such a stream forces the outer parts of the accretion disk to be tilted with respect to the orbital plane. The tidal torques cause the disk to precess in the direction opposite to the orbital motion. Due to tidal torques and the dynamical action of the accretion stream the outer parts of the disk develop a notable wobbling (nutational) motion twice the synodal period. For an observer, the X-ray source can be screened by the outer parts of the disk for some time during the first orbit after the X-ray turn-on. This causes anomalous dips and post-eclipse recoveries.
The analysis of Her X-1 observations obtained with the All Sky Monitor (ASM) on board of the Rossi X-ray Timing Explorer (RXTE) satellite (see Bradt et al., 1993) over the period 1996 February to 2004 September allowed to improve the statistics of the averaged X-ray light curve of Her X-1 with respect to previous analyses (Shakura et al., 1998a; Scott & Leahy, 1999; Still & Boyd, 2004). In addition to well-known features (pre-eclipse dips and anomalous dips during the first orbit after X-ray turn-on) the averaged X-ray light curve shows that anomalous dips and post-eclipse recoveries are present for two successive orbits after the turn-on in the short-on state. These details have already been reported by Shakura et al. (1998a). Now using about two times more data we confirm these features to be stable details of the light curve (they are also seen in one RXTE/PCA pointed observation of the source during the short-on state (Inam & Baykal, 2005)).
In this work we present averaged X-ray light curves of Her X-1 obtained from the analysis of ASM observations. Based on this data we modify the model developed by Shakura et al. (1999) in order to reproduce the details of the averaged light curve which were left unexplained previously. We show that the accretion disk needs to change its tilt during the 35 d cycle from in the main-on to in the short-on.
2 Processing and analysis of the X-ray light curve
For the analysis of the X-ray light curve of Her X-1 we use data from the ASM (Levine et al., 1996). The archive contains X-ray flux measurements in the 2-12 keV band, averaged over 90 s. The monitoring began in February 1996 and continues up to date. The archive is public and accessible on the Internet 111http://xte.mit.edu/asmlc/srcs/herx1.html.
X-ray data analyzed in this work contain some 50000 individual flux measurements. They cover 90 35 d cycles. Preliminary processing of the X-ray light curve was carried out by the method described by Shakura et al. (1998a).
The goals of this processing are the reduction of the dispersion of the flux through rebinning, resulting in a smoothed light curve, and the determination of the turn-on time of each individual 35 day cycle, with the aim to classify the cycles into two classes: turn-on around orbital phase , and turn-on around orbital phase (they appear with about equal probability)
The smoothing of the light curves is achieved by combining appropriate groups of data points into an average (following the procedure described in Shakura et al. (1998a)). The method used to determine the turn-on time of the cycles without data gaps (we call them ”good” cycles) is also similar to the one described by Shakura et al. (1998a). For cycles with data gaps longer than one day (we call them ”bad” cycles) a different method is used to determine the turn-on time. Each ”good” cycle was fitted with an analytical function of the following form:
where is the time, are the fitting parameters. This function consists of two smoothed “steps”, the first representing the beginning of a main-on state, the second representing the end of the main-on. The analytical curves obtained from fitting ”good” cycles were used as a template library, assuming that each ”bad” cycle can be well described by one of these analytical curves. For a given ”bad” cycle we find a corresponding curve from our library that fits it best in terms of , and we determine the turn-on time from this curve.
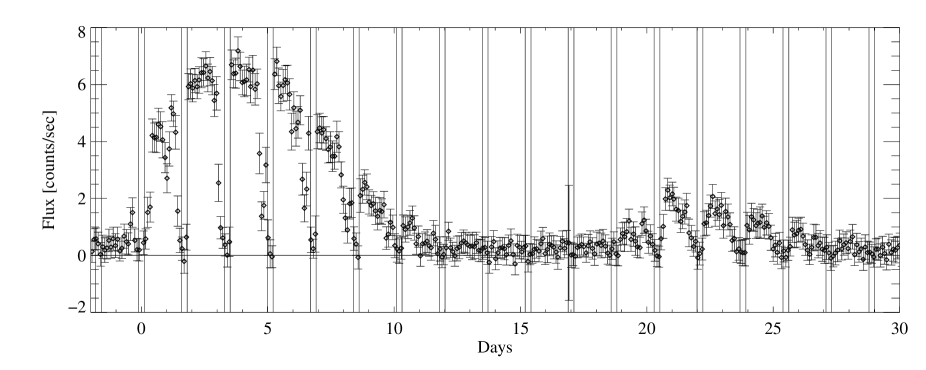
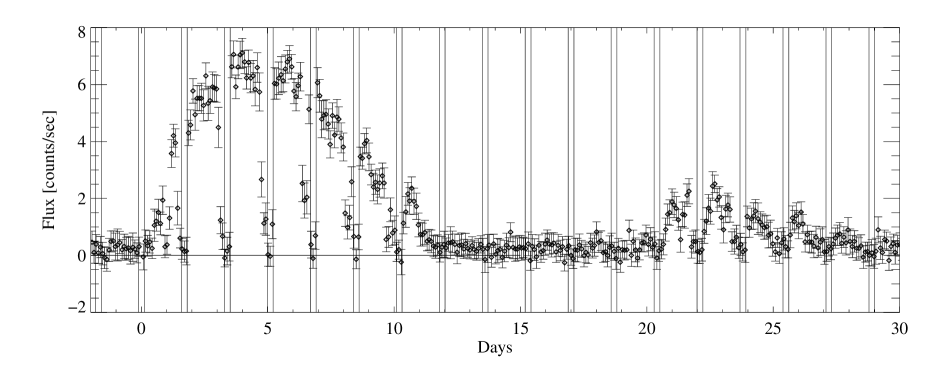
Figure 1 shows an example of the original X-ray light curve. Figure 2 represents the same light curve after processing.

2.1 Averaged X-ray Light Curves
Using the RXTE/ASM (with 5 cts/s from Her X-1 in the main-on) details cannot be explored in individual 35 day cycles. However, through superposition of many 35 d light curves common details (e.g. X-ray dips, post-eclipse recoveries) become recognizable.
This has been done e.g. by Shakura et al. (1998a); Scott & Leahy (1999); Still & Boyd (2004). The ASM archive has grown considerably, allowing to construct averaged light curves with smaller dispersion than in previous works.
As mentioned above, in most cases turn-ons occur near orbital phases 0.2 and 0.7. Thus all 35 d cycles have been divided into two groups – with the turn-on near and near . Inside each group the light curves were superposed and averaged, after shifting them in such a way that the eclipses coincided. The superposed light curves are shown in Figs. 3 and 4.
In the averaged light curve corresponding to the turn-on near (Fig. 4) one can see that the flux starts to increase near . But around this increase is suppressed by a strong anomalous dip. This is due to the fact that some cycles classified to turn-on near have some increased flux near (just before the anomalous dip), but statistically insignificant to be recognized in the individual light curve. Only when the increase of the flux before the anomalous dip is recognizable in the individual light curve we consider the turn-on as occurring near . This shows some limitations of determining the turn-on times from RXTE/ASM data.
In the short-on state complicated dip patterns can be observed. (Fig. 5). Anomalous dips near orbital phase are present on two successive orbits after the beginning of the short-on state (see also Leahy et al., 2000; Oosterbroek et al., 2000; Inam & Baykal, 2005).

2.2 Statistics of individual 35 d cycles
The behavior of the duration of the 35 d cycle can be studied using the so-called () diagram – the difference between the observed and calculated times (assuming a constant period) of the turn-on as a function of time (or 35 d cycle number). There is a strong correlation between () and the pulse period development, both on long (years) and short (months) time scales (see also Staubert et al., 2000, 2006b). In addition, a lag is observed in the sense that structures in the curves tend to appear first in the pulse period curve and then (about 35 days later) in the () diagram. This provides support to the model described here (see Discussion). A comprehensive analysis of the behavior of the 35 d cycle, pulse period development ( and ) and X-ray flux will be presented in a forthcoming paper by Staubert et al. (2006a). We will show that the correlation to X-ray flux is comparatively weak. The statistics of the duration of the 35 day cycles is the following: about 40% have a duration of binary cycles, the rest is equally distributed between cycles with and binary cycles (including a few cycles of duration binary cycles).
3 Evidence from the X-ray light curve for a change in the tilt of the disk
The fact that during the short-on state of Her X-1 more absorption dips appear on the X-ray light curve (the anomalous dips and post-eclipse recoveries during two successive orbits of the averaged short-on as well as in an individual short-on observed by PCA: Fig. 5 and Inam & Baykal 2005) suggests that the angle between the disk and the line of sight remains close to zero during the first two orbits after the turn-on in the short-on state. This is in contrast to the main-on state, where such features are observed only during one orbit after turn-on. This observation implies a generic asymmetry between the beginning of the main-on and short-on states. This asymmetry can take place only if the disk tilt, , changes with precession phase . Indeed, the angle of the plane of the disk with the line of sight is
| (1) |
where is the binary inclination angle. So with constant and and are the same for precession phases with (i.e. at the beginning of the on-states), although the line of sight to the X-ray source lies nearer to the plane of the disk during the short-on state. As the binary inclination angle could not change significantly over the precession period, the only way to recover the asymmetry is to suppose that is a function of .
The physical reason why this could be so is discussed below. The disk tilt is generally determined by the action of various torques acting on the disk. These include (1) the tidal torque from the optical star, (2) the dynamical torque caused by gas streams, (3) the viscous torque, (4) the torque caused by the radiation pressure and possibly (5) a disk wind torque. The joint action of these torques determines the shape of tilted and twisted accretion disk (see, for example, calculations of the stationary disk shape for the disk wind model in Schandl & Meyer 1994). However, if the mass transfer rate through the inner Lagrange point into the disk changes with the precession phase, so will the tilt of the disk. For example, if free precession of the neutron star is ultimately responsible for the 35-day cycle in Her X-1 (Brecher, 1972; Trümper et al., 1986; Shakura, 1995; Shakura et al., 1998b), the conditions of X-ray illumination of the optical stars atmosphere will periodically change with the precession phase. This in turn will lead to changes in the velocity components of the gas stream in the vicinity of the inner Lagrangian point and hence in the matter supply rate to the accretion disk. Recently, X-ray pulse profiles evolution with the 35 d phase was successfully reproduced both in the main-on and short-on states in the model of freely precessing neutron star with complex surface magnetic field structure (Ketsaris et al., 2000; Wilms et al., 2003). As a first approximation the periodic change of the tilt of the disk with precessional phase can be parameterized in the form
| (2) |
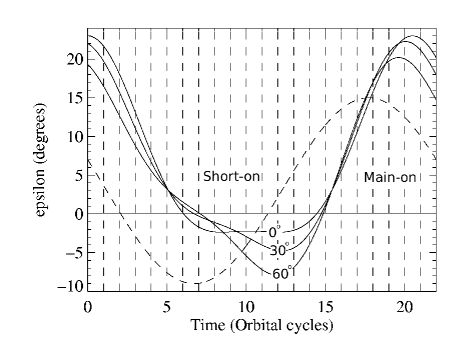
where is the 35 d precessional frequency, is the phase delay, and and are numerical constants. The phase delay is zero for the observer whose line of sight coincides with the extrema of the disk tilt , which is quite improbable. So in general one expects . The effect of the disk’s tilt changing with the angle is shown in Fig. 6 for different phase delays , and . It is seen that in a fairly broad range of the possibility appears for to be close to zero during several orbits in the short-on state.
The anomalous absorption dips and post-eclipse recoveries can be produced by the wobbling motion of the outer disk. The wobbling of the outer parts of the disk occurs twice during the orbital binary period and is primarily caused by the tidal torques (Katz et al., 1982; Levine & Jernigan, 1982). The tidal torque vanishes when the companion crosses the node line of the disk, so a wobbling appears as a sine-like component with one half of the synodic orbital period on top of the mean disk tilt. This explains, in addition to the occurrence of the turn-ons at the preferred 0.2 and 0.7 binary phases, the appearance of anomalous dips during the first orbit after the turn-on both in the main-on and in the short-on states (see Fig. 5 in Shakura et al. 1999).
The appreciable tidal wobbling (with the amplitude of order of one degree) can be experienced by the disk with the outer radius ( is the binary separation). Tidal forces also cause precession of the disk retrograde to the orbital motion. Acting alone, these forces would result in a precessional period somewhat shorter than observed. To explain the observed precessional period of the disk (about 20.5, where is the orbital period), braking torques must be added. For example, according to our qualitative accretion stream-disk coupling model (Shakura et al., 1999), the motion of the outer parts of the disk is driven by the joint action of tidal forces and dynamical pressure induced by the impact of the gas stream on the accretion disk. The dynamical action of the gas stream over one binary period is opposite to the tidal force so the streams can slow down the tidal precession to the observed value. As mentioned above, an important feature of our model is that the stream is non-complanar with the orbital plane, which is due to a complex shape of the shadow produced by the tilted and twisted accretion disk on the atmosphere of the optical companion (HZ Her). In addition to braking the precessional motion of the disk, the stream exerts a torque tilting the disk, which counterbalances the viscous torque and therefore limits the tilt of the disk (Bardeen & Petterson, 1975). So the outer regions of the accretion disk are normally kept tilted at some equilibrium angle defined by the joint action of viscous and dynamical torques (for an alternative explanation of the disk tilt induced by the coronal wind see Schandl & Meyer 1994). Our model has allowed us to successfully reproduce the phase behavior of pre-eclipse dips as the result of regular screening of the X-ray source by the out-of-the-orbital-plane stream (Shakura et al., 1999).
It is important to note that in this model the gas stream impacts the tilted disk deeply inside its outer radius (see Fig. 2 in Shakura et al. 1999) at distances from the neutron star. Assuming the standard accretion disk, the viscous time from the impact region to the disk center is around 10 days, and scales as . However, the region of the disk beyond , where is no matter supply (called the “the stagnation zone”) and which mediates the angular momentum transfer outwards for accretion to proceed, can react to perturbations induced by the stream impact much faster than on the viscous time scale. Indeed, in a binary system, tidal-induced standing structures can appear in the outer zone of the accretion disk (see e.g. Blondin, 2000, and references therein) and perturbations of angular momentum can propagate through this region with a velocity close to the sound speed (while the matter will accrete on the much slower viscous time scale!). Recent analysis of broad-band variability of SS 433 (Revnivtsev et al., 2005) suggests that such a picture is realized in the accretion disk in that source.
The physical picture of the change of the disks tilt adopted here is as follows. The rate of mass transfer supplied by HZ Her (which for a given moment can be different from the accretion rate of the neutron star because the viscous time scale for mass transport through the disk both delays and smoothes the mass flow.) changes periodically over the precession cycle in response, for example, to changing illumination of the optical star atmosphere due to free precession of the neutron star. The streams action causes the outer disk to precess slower than it would do if only tidal torque was acting, and it also changes the outer disk’s tilt on the dynamical time scale of about 10 days (see below), which is sufficient to explain periodic disk tilt variations over the precession cycle. The wobbling of the outer disk is mainly due to tidal forces (the dynamical action of the stream provides minor contribution). The viscous time scale in the “stagnation zone” is much longer, so the viscous torques cannot smooth out the external disk variations.
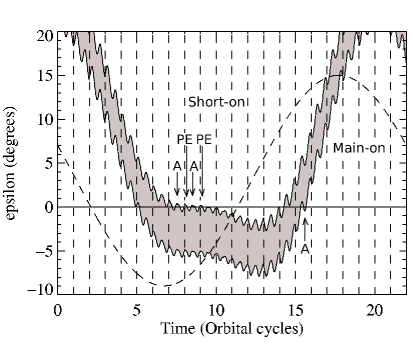
In Appendix we present details of the calculation of the disk wobbling under the action of tidal and stream torques, and the result is shown in Fig. 7 for the standard accretion disk semi-thickness . In these calculations, there are two characteristic radii: the outer radius of the disk which determines the tidal wobbling amplitude, and the effective radius which determines the mean precession motion of the disk. The value of this effective radius is found from the requirement that the net precession period of the entire disk be equal to the observed value 20.5 and the dynamical time scale (which characterizes the dynamical action of the stream) be 10 days. This value for the dynamical time is chosen to be of order of the viscous time from the impact radius 0.1 to meet (quasi) stationary conditions: at larger the disk would rapidly empty out, at smaller the matter would be stored in the disk. We emphasize again that the changing tilt of the outer parts of the disk (at ) occurs very rapidly (on the sound velocity time scale!), while the precessional motion of the entire disk changes on much longer dynamical time scale in response to the variations.
In Fig. 7 we show the result of calculations (see Appendix) of the angle between the direction from the center of the neutron star to the observer and to the outer parts of the accretion disk with non-zero thickness. The complex shape of the disks wobbling is clearly seen. The sine-like dashed curve shows schematically the angle for the inner accretion disk regions which eclipses the X-ray source at the end of on-states. The horizontal line is the observer’s plane and the vertical dashed lines mark centers of the binary eclipses. The main-on and short-on states are indicated. The source is screened by the disk when the observer is in the magenta area or between this area and the inner disk line. It is seen that the wobbling effects can be responsible for the observed (several) anomalous dips and post-eclipse recoveries at the beginning of the short-on state. These additional dips become more pronounced with the disk’s tilt decreasing and possibly we see them as unusual anomalous dips and post-eclipse recoveries at the end of the short-on preceeding the anomalous low state observed by BeppoSAX (Oosterbroek et al., 2000) and RXTE (Still et al., 2001).
4 Discussion
For constructing the averaged X-ray light curves of Her X-1 we used the RXTE/ASM data covering 90 35 d cycles. The large amount of data assures good statistics allowing to see some new details in the light curves. It is clearly seen that anomalous dips and post-eclipse recoveries exist at two successive orbits after the turn-on in the short-on state. In our model these features are produced by the wobbling of the outer parts of the accretion disk which cover for some time the central X-ray source from the observer. To account for the observed behavior of the anomalous dips and post-eclipse recoveries we have to assume a change of the tilt of the outer parts of the disk with precessional phase. In the short-on state the tilt is three times smaller than in the main-on state.
The model we used to calculate the wobbling of the outer parts of the accretion disk in Her X-1 is highly idealized. Although detailed numerical calculations of precessing twisted accretion disks including viscous forces have been presented by several authors (e.g. Bardeen & Petterson, 1975; Petterson, 1977), only simplified models have been used to account for the wobbling motion of the accretion disk (see Levine & Jernigan, 1982, where only tidal wobbling is considered). Thus, it is hardly now possible to check our model, where both tidal forces and dynamical actions of the accretion stream are included, by numerical calculations. However, even this simplified model explains most properties of the averaged X-ray light curve of Her X-1: the duration of the main-on and short-on states, the appearance and behavior of pre-eclipse dips (Shakura et al., 1999) and of anomalous dips and post-eclipse recoveries.
In our calculations we ignored viscous torques exerted on the outer regions of the disk. Taking them into account complicates the model and can only be done introducing new assumptions about the shape of the twisted and tilted accretion disk in Her X-1. We expect that the effects of the viscosity will be the following. The viscosity always tends to reduce the tilt of the disk. It counterbalances the dynamical action of the stream tending to restore the tilt, so at any given time there is an equilibrium tilt angle. Weakening the stream (for example, by decreasing the accretion rate ) would ultimately result in a smaller tilt of the disk, which we believe is the physical reason for the appearance of anomalous low states.
In the above picture the time needed by the matter to travel from the stream impact region to the neutron star (10 days) is shorter than the viscous time of the disk at the effective radius binary separation (30 days). So the model predicts that the neutron star reacts to the accretion rate variations earlier than the precessing accretion disk. This can manifest itself, for example, in the neutron star period variations preceding changes in the accretion disk precession period. The analysis of long-term correlations in Her X-1 (Staubert et al., 2006a) indeed suggests such a delay between the turn-on behavior of the source on the O-C diagram and the pulse period variations and hence lends support to the model under discussion.
5 Conclusions
The following main results have been obtained from analysing and modeling RXTE/ASM X-ray light curves of Her X-1.
-
1.
The shape of the averaged X-ray light curves is determined more accurately than was possible previously (e.g. by Shakura et al., 1998a). This has allowed us to confirm the significance and stability of the features in the averaged short-on light curve which have been found previously: the anomalous dips in two successive orbits after the beginning of the short-on state with a post-eclipse recovery after the first eclipse.
-
2.
We argue that the changing of the tilt of the accretion disk with 35 d phase is necessary to account for the appearance of these features and the observed duration of the main-on and short-on states.
-
3.
We show that the joint action of tidal forces and the dynamical interaction of the gas stream with the outer parts of the accretion disk leading to its wobbling can be responsible for the observed behavior of the disk.
Acknowledgements.
In this research we used data obtained through the High Energy Astrophysics Science Archive Research Center Online Service, provided by the NASA/Goddard Space Flight Center. We thank Prof. A. Santangelo for useful discussion. The work was supported by the DFG grant Sta 173/31-2 and 436 RUS 113/717/0-1 and the corresponding RBFR grant RFFI-NNIO-03-02-04003. KP also acknowledges partial support through RFBR grant 03-02-16110. We thank the anonymous referee for constructive remarks.References
- Bardeen & Petterson (1975) Bardeen, J. M. & Petterson, J. A. 1975, ApJ, 195, L65
- Blondin (2000) Blondin, J. M. 2000, New Astron., 5, 53
- Bochkarev & Karitskaia (1989) Bochkarev, N. G. & Karitskaia, E. A. 1989, Ap&SS, 154, 189
- Bradt et al. (1993) Bradt, H., Rothschild, R., & Swank, J. 1993, A&AS, 97, 355
- Brecher (1972) Brecher, K. 1972, Nature, 239, 325
- Crampton (1974) Crampton, D. 1974, ApJ, 187, 345
- Crosa & Boynton (1980) Crosa, L. & Boynton, P. 1980, ApJ, 235, 999
- Gerend & Boynton (1976) Gerend, D. & Boynton, P. E. 1976, ApJ, 209, 562
- Giacconi et al. (1973) Giacconi, R., Gursky, H., Kellogg, E., et al. 1973, ApJ, 184, 227
- Gorecki et al. (1982) Gorecki, A., Levine, A., M.Bautz, et al. 1982, ApJ, 256, 234
- Inam & Baykal (2005) Inam, S. C. & Baykal, A. 2005, MNRAS, in press (astro-ph/0506227)
- Katz et al. (1982) Katz, J. I., Anderson, S. F., Margon, B., et al. 1982, ApJ, 260, 780
- Ketsaris et al. (2000) Ketsaris, N. A., Kuster, M., Postnov, K., et al. 2000, in Proc. Int. Workshop ”Hot Points in Astrophysics”, JINR, Dubna, p. 192, ed. V. Belyaev, astro-ph/0010035
- Kuster et al. (2005) Kuster, M., Wilms, J., & Staubert, R. 2005, A&A, in preparation (astro-ph/0507198)
- Leahy (1997) Leahy, D. A. 1997, MNRAS, 287, 622
- Leahy et al. (2000) Leahy, D. A., Marshall, H., & Mattew, S. D. 2000, ApJ, 542, 446
- Levine et al. (1996) Levine, A. M., Bradt, H., Cui, W., et al. 1996, ApJ, 469, L33
- Levine & Jernigan (1982) Levine, A. M. & Jernigan, J. G. 1982, ApJ, 262, 294
- Oosterbroek et al. (2000) Oosterbroek, T., Parmar, A. N., Dal, F. D., et al. 2000, A&A, 353, 575
- Petterson (1977) Petterson, J. A. 1977, ApJ, 214, 550
- Revnivtsev et al. (2005) Revnivtsev, M., Fabrika, S., Abolmasov, P., et al. 2005, A&A, in press (astro-ph/0501516)
- Schandl (1996) Schandl, S. 1996, A&A, 307, 95
- Schandl & Meyer (1994) Schandl, S. & Meyer, F. 1994, A&A, 289, 149
- Scott & Leahy (1999) Scott, D. M. & Leahy, D. A. 1999, ApJ, 510, 974
- Shakura (1995) Shakura, N. I. 1995, in Nova Science Publishers, c1995., p.55, ed. A. Kaminker & N. Commack
- Shakura et al. (1998a) Shakura, N. I., Ketsaris, N. A., Prokhorov, M. E., & Postnov, K. A. 1998a, MNRAS, 300, 992
- Shakura et al. (1999) Shakura, N. I., Ketsaris, N. A., Prokhorov, M. E., & Postnov, K. A. 1999, A&A, 348, 917
- Shakura et al. (1998b) Shakura, N. I., Postnov, K., & Prokhorov, M. 1998b, A&A, 300, 992
- Shakura & Sunyaev (1973) Shakura, N. I. & Sunyaev, R. A. 1973, A&A, 24, 337
- Staubert et al. (1983) Staubert, R., M., & Kendziorra, E. 1983, A&A, 117, 215
- Staubert et al. (2000) Staubert, R., Schandl, S., & Wilms, J. 2000, in Proc. of the fifth Compton Symposium, ed. M. L. McConnell & J. M. Ryan, aIP CP, 510,153
- Staubert et al. (2006a) Staubert, R., Schandl, S., Wilms, J., et al. 2006a, A&A, in preparation
- Staubert et al. (2006b) Staubert, R., Schandl, S., Wilms, J., et al. 2006b, in Proc. of The Transient Milky Way: A Perspective for MIRAX, ed. F. D’Amico, J. Braga, & R. Rothschild
- Still & Boyd (2004) Still, M. & Boyd, P. 2004, ApJ, 606, L135
- Still et al. (2001) Still, M., O’Brien, K., Horne, K., et al. 2001, ApJ, 553, 776
- Tananbaum et al. (1972) Tananbaum, H., Gursky, H., Kellogg, E., Giacconi, R., & Jones, C. 1972, ApJ, 174, L143
- Trümper et al. (1986) Trümper, J., Kahabka, P., Ögelman, H., Pietsch, W., & Voges, W. 1986, ApJ, 300, L63
- Vrtilek & Halpern (1985) Vrtilek, S. D. & Halpern, J. P. 1985, ApJ, 296, 606
- Wilms et al. (2003) Wilms, J., Ketsaris, N., Kuster, M., et al. 2003, Izvestija Akad. Nauk, Ser. Fizicheskaja, 67, 310
Appendix A Wobbling of the outer parts of the disk
The new features discussed in this paper (anomalous dips and post-eclipse recoveries in the first two successive orbits in the short-on state) call for modification of the model proposed by Shakura et al. (1999). We argue that in order to explain these new features, the tilt of the outer regions of the disk should regularly change over the 35 d cycle. The physical reason for this can be a decrease of the mass transfer rate supplied by the optical component as is expected in our model of a freely precessing neutron star as the underlying clock mechanism for the 35 d cycle in Her X-1 (Shakura et al. 1999).
To quantify this behavior, we calculated the net wobbling of the disk produced by tidal forces and the accretion stream. In contrast to Schandl & Meyer (1994), we ignored the viscous torques on the twisted accretion disk (see discussion in Section 4).
Calculations were done in the same way as in Shakura et al. (1999) allowing for the change of the tilt of the disk.
To account for the tidal torques, we approximated the outer disk as a solid ring of radius (see discussion by Shakura et al. 1999). In the quadrupole approximation, the ring precesses around the orbital angular momentum with the frequency
| (3) |
where is the binary mass ratio and is the orbital binary frequency.
We denote the precession angle of the disk by (counting along the orbital rotation) and the tilt angle of the disk by . The tidal wobbling of the disk on top of its slow precessional motion in the leading order in can be described as (Levine & Jernigan 1982)
| (4) |
| (5) |
where is the orbital phase and is the precessional phase.
Let us now discuss the dynamical action of the stream in more detail. The angular momentum of the outer parts of the disk are changed by the stream according to the equation
| (6) |
where and are the distance from center of the disk to the impact point of the stream and the gas velocity at the impact point, respectively. They depend on the binary phase. In our model is also a function of the orbital phase because the matter supply through the inner Lagrangian point depends on its position relative to the shadow produced by the tilted and twisted disk in the atmosphere of the optical star.
We will use the right-hand Cartesian reference frame rigidly connected to the accretion disk and consider it as non-rotating (this assumption is justified by the relatively slow precessional motion of the disk). The origin of the frame is at the center of the neutron star, the -axis is normal to the orbital plane and the -axis lies in the orbital plane and is directed such that the disks angular momentum vector always lies in the plane (see Fig. 8):
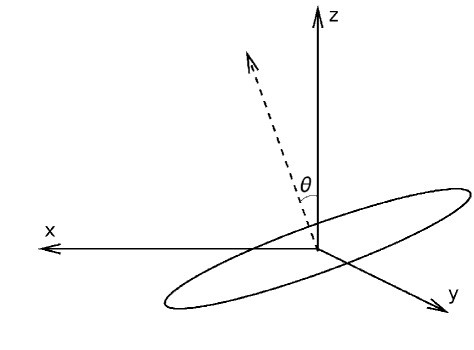
| (7) |
Then the change of the disk momentum can be written through the change in its components as
| (8) |
The time evolution of the disk angular momentum components (Eq.(6)) in this frame now can be written in the form:
| (9) |
where are dimensionless coordinates of the stream impact point (in units of binary separation ) and are the components of the velocity of the stream at the impact point (in units of relative velocity of binary components ). For computing ballistic trajectories of the gas stream from the Lagrangian point we used the primed right-hand reference frame rigidly rotating with the binary system. The origin of the frame is at the center of the neutron star, the -axis is normal to the orbital plane and the -axis is pointed to the center of the normal component. The transition from that frame to the one of the precessing disk is made by usual coordinate transformation:
| (10) |
and for velocities:
| (11) |
where is the angle between the coordinate axes and .
It is convenient to rewrite all equations in a dimensionless form. The angular momentum of the disk can be written as
| (12) |
where is the effective disk radius (see Section 3), is the mass of the disk and is the Keplerian frequency at the effective radius and is a numerical coefficient accounting for the surface density distribution ; for example, in the standard Shakura-Sunyaev accretion disk (Shakura & Sunyaev 1973) and .
Now, from equations (8) and (9)) and making use of the Kepler’s 3rd law, we arrive at the following equations for the change of angles and with the synodic angle ():
| (13) |
Using these equations, we calculated the change in angles and ( and ) step by step and sum them up to find their behavior over one precessional cycle. The initial components of the velocities were chosen as a function of the synodic phase in the way described in detail by Shakura et al. (1999).
The free parameters are the mass of the accretion disk , the maximal disk tilt and its change, the disk semi-thickness at the outer boundary and the binary inclination angle . We fixed the angle and the disks semi-thickness (corresponding to a disk opening angle of about ). The disks tilt was allowed to change with precessional phase according to the Eq. (2).
The angle and numerical coefficients (, and ) in Eq. (2) were chosen to reproduce the observations. Now we can calculate the angle between the line of sight and the outer parts of the disk making use of Eq. (1).
In contrast to the case with constant tilt considered earlier by Shakura et al. (1999), the change of with precessional phase is determined also by the change of the tilt [Eq. (2)]. The effect of the phase delay is illustrated by Fig. 6: the larger is, the more asymmetric is the changing of The results are shown in Fig. 7.