11email: charles@if.ufrgs.br, bica@if.ufrgs.br, blumberg@if.ufrgs.br
Faint open clusters with 2MASS: BH 63, Lyngå 2, Lyngå 12 and King 20
Abstract
Context. Structural and dynamical parameters of faint open clusters are probed with quality 2MASS-photometry and analytical procedures developed for bright clusters.
Aims. We derive fundamental parameters of the faint open clusters Lyngå 2, BH 63, Lyngå 12 and King 20, the last three of which have no prior determinations. We also focus on the structure and dynamical state of these clusters.
Methods. , and 2MASS photometry with errors smaller than 0.2 mag are used to build CMDs, radial density profiles, colour-colour diagrams, luminosity and mass functions. Colour-magnitude filters are used to isolate probable member stars. Field-star decontamination is applied to Lyngå 2, Lyngå 12 and King 20.
Results. Reddening values are in the range , with BH 63 the most reddened object. Ages of Lyngå 2, King 20, Lyngå 12 and BH 63 are , , and Myr, respectively. The radial density distributions of Lyngå 12 and King 20 are well-represented by King profiles. Lyngå 2 and BH 63 are very small with core and limiting radii of pc and pc. Yet, they fit in the small-radii tail of the open cluster size distribution. Lyngå 12 and King 20 have pc and pc. Lyngå 2 and Lyngå 12 are inside the Solar circle. Total stellar masses (extrapolating the MFs to stars with 0.08 ) range from (BH 63) to (Lyngå 12). Observed masses are of these values. In all clusters the core mass function is flatter than the halo’s.
Conclusions. Faint open clusters can be probed with 2MASS when associated with colour-magnitude filters and field-star decontamination. BH 63 appears to be in an advanced dynamical state, both in the core and halo. To a lesser degree the same applies to King 20. Marginal evidence of dynamical evolution is present in the cores of Lyngå 2 and Lyngå 12.
Key Words.:
(Galaxy:) open clusters and associations: individual: BH 63, Lyngå 2, Lyngå 12 and King 20; Galaxy: structure1 Introduction
Because it is relatively simple to estimate ages and distances of open clusters (OCs), they have become fundamental probes of Galactic disc properties (Lyngå Ly82 (1982); Janes & Phelps JP94 (1981); Friel Friel95 (1995); Bonatto et al. 2006a ; Piskunov et al. Pi2006 (2006)). However, the proximity of most of the OCs to the plane and the corresponding high values of reddening and field-star contamination (Bonatto et al. 2006a and references therein) usually restrict this analysis to the more populous OCs and/or those located a few kpc from the Sun.
To probe disc structure Bonatto et al. (2006a ) employed 654 OCs with fundamental parameters (such as age, distance from the Sun, and reddening) mostly from the WEBDA111http://obswww.unige.ch/webda database (Mermilliod Merm1996 (1996)). They found that a large fraction of the faint and/or poorly populated OCs must be overwhelmed in the field, particularly in bulge/disc directions. Piskunov et al. (Pi2006 (2006)) used 650 OCs from ASCC-2.5 data to infer kinematical similarities among OC groups. Both works estimate a total population of OCs in the Galaxy. Dias et al. (Dias2002 (2002)) reported 1756 optically visible OCs and candidates in their catalogue. These works suggest that besides those not yet observed, there is a large number of OCs and candidates whose properties have not been explored.
Efforts to analyse unstudied OCs and derive their fundamental parameters will contribute to future disc studies by unveiling the properties of individual OCs themselves and constraining theories of molecular cloud fragmentation, star formation and stellar and dynamical evolution. These processes will be better understood as the number of studied clusters, faint ones in particular, increases. A side-product of more constrained parameters will be better statistics of OCs as a class.
As a first step in this direction we studied a series of faint OCs (Bica, Bonatto & Dutra BBD2003 (2003); Bonatto, Bica & Dutra BBD2004 (2004); Bica & Bonatto BiBo2005 (2005)) using near-IR photometry. For spatial and photometric uniformity we work with , and 2MASS222The Two Micron All Sky Survey, All Sky data release (Skrutskie et al. 2mass1997 (1997)), available at http://www.ipac.caltech.edu/2mass/releases/allsky/ Point Source Catalogue (PSC) photometry. We have developed methods to disentangle cluster and field stars in colour-magnitude diagrams (CMDs), as well as in radial stellar density distributions. The use of field-star decontamination and colour-magnitude filters (hereafter C-MF) have produced more robust parameters (e.g. Bonatto & Bica BB2005 (2005); Bonatto et al. 2006b ). In particular, field-star decontamination constrains more the age, especially for low-latitude OCs (Bonatto et al. 2006a ). These procedures have proven useful also in the analysis of faint and/or distant OCs (Bica, Bonatto & Dutra BBD2003 (2003); Bonatto, Bica & Dutra BBD2004 (2004); Bica & Bonatto BiBo2005 (2005)). Recently we discussed the advantages of using C-MFs in the construction of radial density profiles for M 52 and NGC 3960, whose fields are affected by different amounts of differential reddening (Bonatto & Bica BB2006 (2006)). As by-products we have been deriving more constrained structural parameters such as core and limiting radii, and mass function slopes, that allow inferences on dynamical evolution.
In the present work we focus on the faint OCs Lyngå 2, Lyngå 12, King 20 (Alter et al. Alter70 (1970) and references therein), and BH 63 that was catalogued by van den Bergh & Hagen (BH75 (1975)).
We intend to derive photometric, cluster structure and dynamic-related parameters working with a set of methods which provide more accurate results. The target clusters are Lyngå 2 (for comparison purposes with the literature), and the as yet unstudied OCs Lyngå 12, King 20 and BH 63. Since BH 63 is very reddened, and consequently differential reddening may affect its field, it required an approach slightly different than those for the other OCs. Throughout this paper errors correspond to Poisson fluctuations.
| Derived from XDSS | Derived from 2MASS | |||||||||||||
| Cluster | D | Age | Alternative | |||||||||||
| (hms) | () | (′) | (hms) | () | (∘) | (∘) | (Myr) | (kpc) | (kpc) | (kpc) | Names | |||
| (1) | (2) | (3) | (4) | (5) | (6) | (7) | (8) | (9) | (10) | (11) | (12) | (13) | (14) | |
| BH 63 | 09:20:39 | 49:13:23 | 2.5 | 09:20:39.5 | 49:13:20.5 | 271.63 | 0.40 | ESO 212SC2 | ||||||
| Lyngå 2 | 14:24:35 | 61:19:50 | 13.0 | 14:24:21.1 | 61:19:21.0 | 313.84 | OCl916, ESO 134SC2, BH 157 | |||||||
| Lyngå 12 | 16:46:04 | 50:45:50 | 8.0 | 16:46:04.4 | 50:45:40.1 | 335.70 | OCl973, ESO 226SC22 | |||||||
| King 20 | 23:33:15 | 58:28:00 | 6.0 | 23:33:17.0 | 58:28:33.1 | 112.85 | 2.86 | OCl262 | ||||||
-
Cols. 2 and 3: measured by us on XDSS images. Col. 4: angular diameter estimated on XDSS images. Col. 10: reddening in the cluster’s central region (Sect. 3.3). Col. 12: calculated using kpc (Reid Reid93 (1993)) as the distance from the Sun to the Galactic center. Col. 13: using kpc (Bica et al. BBBO06 (2006)).
This paper is organized as follows. In Sect. 2 we discuss basic properties and review literature data (when available) on the 4 clusters. In Sect. 3 we present the 2MASS data, subtract the field-star contamination (except for BH 63), derive fundamental cluster parameters, and analyse the radial density profiles. In Sect. 4 we derive luminosity and mass functions (LFs and MFs), and compute stellar content properties. In Sect. 5 we discuss dynamical states. Concluding remarks are given in Sect. 6.
2 The target open clusters
Ruprecht (Ruprecht66 (1966)) classified Lyngå 2 and Lyngå 12 as poor loose OCs of Trumpler types IV2p and IV1p, respectively. King 20 was considered somewhat more concentrated with type II1p. The only previously studied object is Lyngå 2. Based on the photographic UBV analysis by Lindoff (Lindoff68 (1968)), WEBDA provides a reddening , distance from the Sun kpc and age Myr. Kharchenko et al. (Kharchenko05 (2005)) found , kpc and age Myr. They also estimated a core radius of and a cluster radius of .
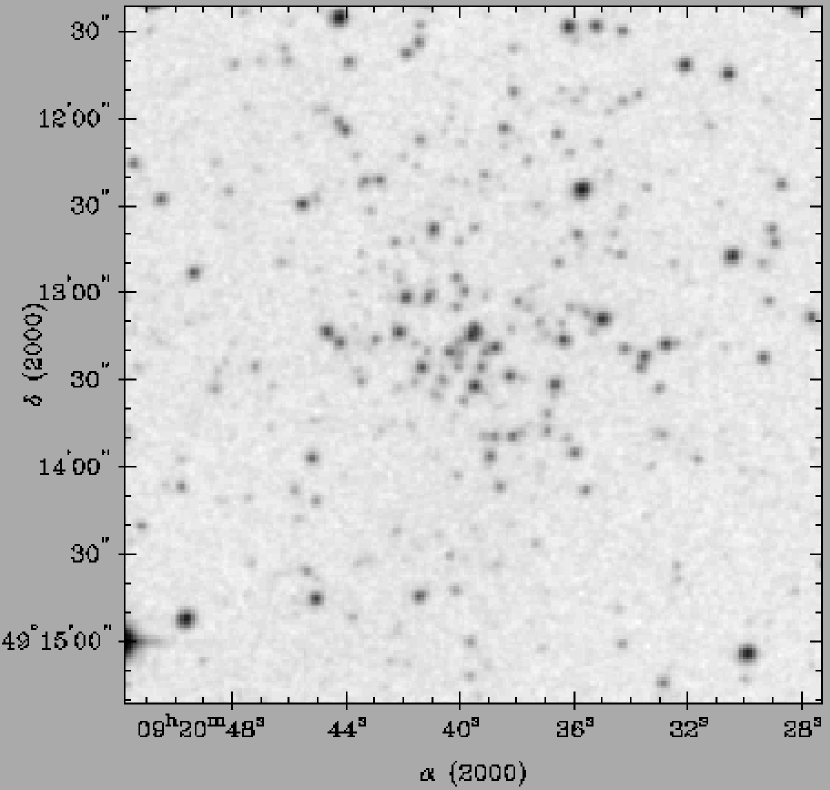
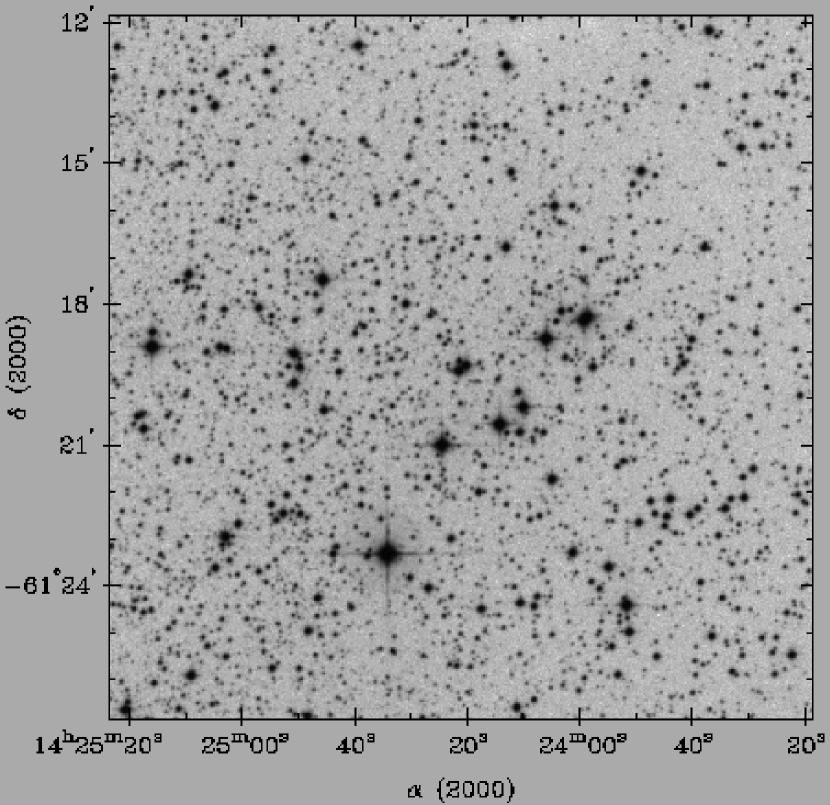
In Fig. 1 we show XDSS333Second Generation Digitized Sky Survey, extracted from the Canadian Astronomy Data Centre (CADC), at http://cadcwww.dao.nrc.ca/ R images of BH 63 (left panel) and Lyngå 2 (right panel). In Fig. 2 we present the images of Lyngå 12 (left panel) and King 20 (right panel).
The clusters are projected close to the plane (Table 1). Nevertheless their fields are differently populated owing to their Galactic longitudes. Lyngå 12 and Lyngå 2 are located in the 4th quadrant, and Lyngå 12 is probably contaminated by bulge stars (Sect. 3.1). They present low stellar density contrast as expected from their Trumpler classifications. King 20 is in the 2nd quadrant and appears looser than a Trumpler type II cluster. Probably the best classification would be a type III. BH 63, located near the border between the 3rd and 4th quadrants, has a significant contrast with respect to the field. It is projected in the direction of the dark nebula FeSt 1-108 (Feitzinger & Stüwe FS84 (1984); Dutra & Bica DB2002 (2002)) with an angular diameter of 96′. The high reddening of BH 63 (Sect. 3.3) suggests that the nebula is located in the cluster foreground. No velocity is available for the nebula, so a distance estimate is not available, but the advanced dynamical state of BH 63 (Sect. 5) might be related to an interaction with a molecular cloud. More detailed studies are necessary to verify this possibility.
In Table 1 we provide data on the clusters. Right ascension, declination and diameter (Cols. 2 to 4) were measured visually by us on XDSS images (Figs. 1 and 2) as the best approximation of the cluster center. However, the stellar radial density profiles (Sect. 3.4) presented a dip at these centers in all clusters. Consequently, we searched for new coordinates that would maximize the central density of stars by examining histograms for the number of stars in 0.5′ bins of right ascension and declination on C-MF photometry (Sect. 3.4). The new central coordinates and the corresponding Galactic longitude and latitude are given in Cols. 5 to 8 of Table 1. Age, central reddening, distance from the Sun and Galactocentric distance based on 2MASS (Sect. 3.3) are in Cols. 9 to 13. Alternative cluster names are in Col. 14.
3 The 2MASS photometry
VizieR444http://vizier.u-strasbg.fr/viz-bin/VizieR?-source=II/246 was used to extract , and 2MASS photometry in a circular area centered on the optimized coordinates of the 4 clusters (Cols. 5 and 6 of Table 1). Extraction radii are (BH 63), (Lyngå 2), and (Lyngå 12 and King 20). Our previous experience (Sect. 1) shows that as long as no other cluster is present in the field, such large extraction areas provide the required statistics for field-star characterisation. For photometric quality constraints the extraction was restricted to stars (i) brighter than the 99.9% Point Source Catalogue Completeness Limit555Following the Level 1 Requirement, according to http://www.ipac.caltech.edu/2mass/releases/allsky/doc/sec6_5a1.html , , and , respectively, and (ii) with errors in , and smaller than 0.2 mag. For reddening transformations we use the relations , , , and (Dutra, Santiago & Bica DSB2002 (2002)), assuming a constant total-to-selective absorption ratio .
CMDs of regions that provide a suitable contrast with the field are shown in Fig. 3 (left panels). For BH 63 we extracted photometry from a region with ′ centered on the optimized coordinates (Table 1). For Lyngå 2, Lyngå 12 and King 20 we used ′. The extension and morphology of the main sequences (MS) indicate that cluster age increases from Lyngå 2, King 20, Lyngå 12 and BH 63. Because of the low-latitudes, field stars (mostly disc) contaminate the CMDs particularly at faint magnitudes and red colours. Bulge stars (mostly red giants) contaminate the field of Lyngå 12.
3.1 Field-star decontamination
Field stars are usually an important contaminant of CMDs, particularly of low-latitude OCs and/or those projected against the bulge. Their presence in the fields of the target clusters can be seen in the corresponding offset-field CMDs (middle panels of Fig. 3), extracted from a region outside each cluster’s limiting radius (Sect. 3.4) with the same projected area as the central extraction (left panels of Fig. 3).
To infer the intrinsic cluster-CMD morphology we use the field-star decontamination procedure previously applied in the analysis of low-contrast (Bica & Bonatto BiBo2005 (2005)), young embedded (Bonatto, Santos Jr. & Bica BSJB05 (2006)), and young (Bonatto et al. 2006b ) OCs. The algorithm works on a statistical basis that takes into account the relative densities of stars in a cluster region and offset field. In short, it (i) computes the surface density of field stars (according to the number of stars in the respective offset field), (ii) assumes that it is uniform throughout the cluster field, (iii) divides the CMD in colour/magnitude cells of varying size, (iv) randomly assigns which star within a CMD cell will be assumed to be a field star, and finally (v) subtracts the expected number of candidate field stars from each cell. The size of the colour/magnitude cells can be subsequently adjusted so that the total number of subtracted stars (summing up all cells) matches the expected number of field stars. Because the remaining stars are in CMD cells where the stellar density presents a clear excess over the field, they have a high probability of being cluster members. In crowded field regions, field-star density at faint magnitudes (usually in 2MASS) may be equal or even larger than that expected from the cluster. In such cases the present decontamination procedure would produce an artificially truncated MS at the sub-solar mass range, even for old OCs. Further details on this procedure are in Bonatto et al. (2006b ). As offset fields we take the regions (Lyngå 2), (Lyngå 12), and (King 20), that are large enough to produce field-star statistical representativity, both in magnitude and colours. This procedure could not be applied to BH 63 because of the high reddening and small angular size (Sects. 3.3 and 3.4). Because it actually subtracts stars from the original files - thus artificially changing the radial distribution of stars - we use the field-star decontamination only to uncover the intrinsic cluster CMD morphologies and build colour-colour diagrams (Fig. 4). Cluster structure and luminosity/mass functions are analysed with the stars selected with the colour-magnitude filters shown in panels (a), (e), (h), and (k) of Fig. 3.

| Lyngå 2 | Lyngå 12 | King 20 | |||||||
| (′) | (stars) | (%) | (%) | (stars) | (%) | (%) | (stars) | (%) | (%) |
| (1) | (2) | (3) | (4) | (5) | (6) | (7) | (8) | (9) | (10) |
| 0–2 | 80 | 34 | 66 | 167 | 32 | 68 | 77 | 44 | 56 |
| 2–4 | 1841 | 14 | 86 | 442 | 23 | 77 | 165 | 21 | 79 |
| 4–6 | 271 | 3 | 97 | 651 | 13 | 87 | 243 | 11 | 89 |
| 6–8 | 336 | 0 | 100 | 1152 | 7 | 93 | 315 | 4 | 96 |
| 8–10 | — | — | — | 1491 | 7 | 93 | 399 | 0 | 100 |
| 10–12 | — | — | — | 1765 | 4 | 96 | — | — | — |
| 12–14 | — | — | — | 2064 | 3 | 97 | — | — | — |
| 14–16 | — | — | — | 2312 | 0 | 100 | — | — | — |
| Total | 451 | 12 | 88 | 6853 | 6 | 94 | 645 | 18 | 82 |
-
Cols. 2, 5 and 8: number of observed stars in the region. Cols. 3, 6 and 9: fraction of member stars. Cols. 4, 7 and 10: fraction of field stars. Total fields are (Lyngå 2), (Lyngå 12) and (King 20).
In Table 2 we summarise the results of the decontamination procedure in terms of the fraction of member and field stars throughout the fields of the target clusters. Member stars appear to be found up to , , and from the centers of Lyngå 2, Lyngå 12 and King 20. Because of its near-bulge and central disc direction (), the fraction of member stars in the field of Lyngå 12 is of that in the field of King 20 (); for Lyngå 2 () it is intermediate between both.
The field-star decontaminated CMDs of the regions are shown in the right panels of Fig. 3, where error bars are included to show the magnitude of the photometric uncertainties. As expected, most of the red and faint stars were considered as field stars by the decontamination procedure.
3.2 Colour-colour diagrams
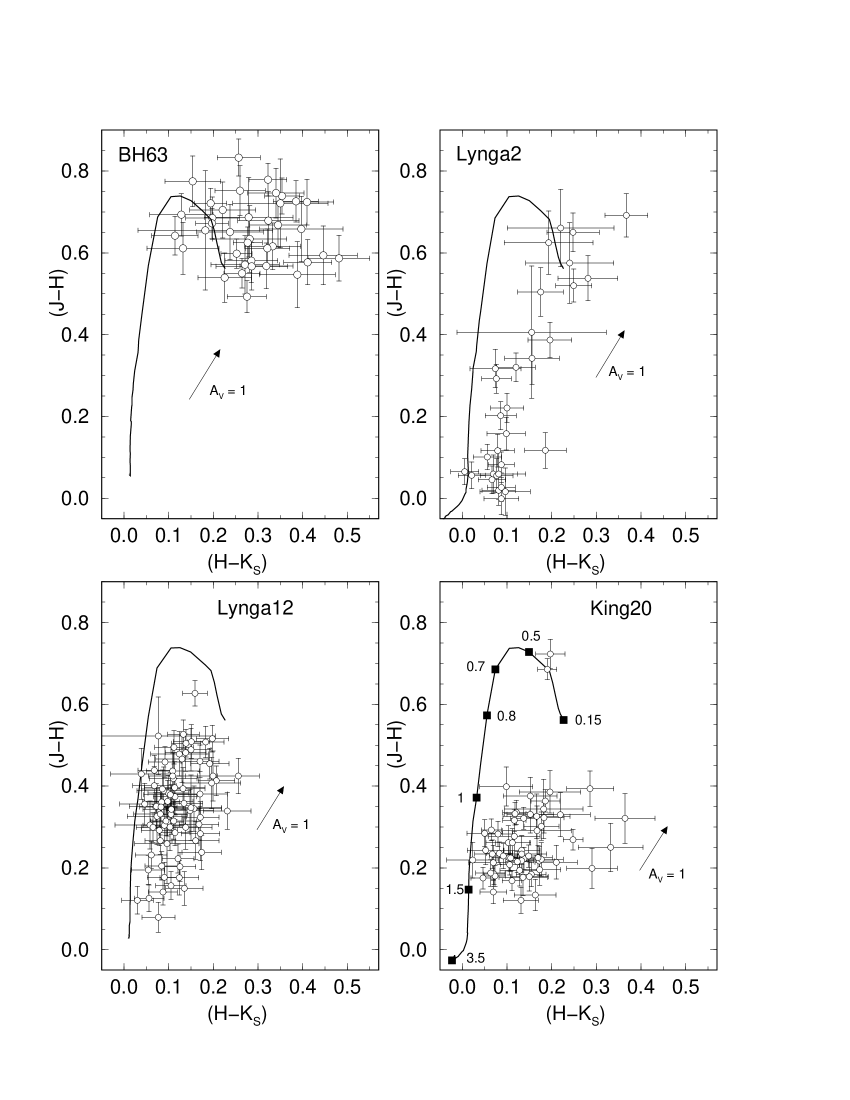
Colour-colour diagrams with near-IR photometry have been useful particularly in the analysis of young clusters, e.g. NGC 6611 (Bonatto, Santos Jr. & Bica BSJB05 (2006)), Trapezium and the cluster embedded in the nebula NGC 2327 (Soares & Bica SB2002 (2002)). We show in Fig. 4 the diagrams of the target OCs together with the MS portion of the respective Padova isochrones (Sect. 3.3) and the reddening vector () for . For membership considerations we used only the stars selected with the C-MFs applied to the field-star decontaminated photometry of Lyngå 2, Lyngå 12 and King 20 (panels e, h and k of Fig. 3). Because of the high reddening in the field of BH 63 (Sect. 3.1), the corresponding colour-colour diagram was produced with the stars selected after applying the colour-magnitude filter (panel (a) of Fig. 3). Most of the stars in Lyngå 2, Lyngå 12 and King 20 distribute along the MS of the Padova isochrones which suggests that reddening values in their fields are not exceedingly high. The locus and colour-spread in BH 63, on the other hand, reflect a high reddening and some differential reddening in the field.
Red stars around the M dwarf loci ( and ) are probably residual field stars, since we cannot detect M dwarfs in these clusters with 2MASS. Particularly in Lyngå 2 and Lyngå 12 the red stars follow the reddening vector, again suggesting residual field contamination.
3.3 Cluster age and distance from the Sun
Cluster age is derived with solar-metallicity - which is typical of OCs (Bonatto, Bica & Girardi BBG2004 (2004); WEBDA) - Padova isochrones (Girardi et al. Girardi2002 (2002)) computed with the 2MASS , and filters666http://pleiadi.pd.astro.it/isoc_photsys.01/isoc_photsys.01.html. 2MASS transmission filters produced isochrones very similar to the Johnson-Kron-Cousins (e.g. Bessel & Brett BesBret88 (1988)) ones, with differences of at most 0.01 in (Bonatto, Bica & Girardi BBG2004 (2004)).
The field-star decontaminated CMD morphologies (right panels of Fig. 3) provide enough constraints to derive the cluster ages of Lyngå 2, Lyngå 12 and King 20. Particularly for Lyngå 2 and Lyngå 12, the field-star decontaminated CMDs provide unambiguous isochrone fits because of the conspicuous upper-MS in Lyngå 2 and the turnoff and giant branch in Lyngå 12 (panels (e) and (h) of Fig. 3). To a lesser degree, the same applies to King 20, in which the presence of 3 bright stars with and suggest evolved stars (panel (k)). For Lyngå 2 we found an age of Myr, observed distance modulus and colour excess , converting to . This age-solution is plotted in panel (e) of Fig. 3. The absolute distance modulus is , resulting in kpc. These values are in good agreement with those in the literature (Sect. 2). The turnoff occurs at and . Because of the 2MASS faint-magnitude limit (Sect. 3), MS stars are detected for . The Galactocentric distance of Lyngå 2 is kpc, using kpc as the Sun’s distance to the Galactic center (Reid Reid93 (1993)). However, with the recently derived value of kpc (based on updated parameters of globular clusters - Bica et al. BBBO06 (2006)), this OC ends up located kpc from the Galactic center. In any case, Lyngå 2 is located kpc inside the Solar circle.
For Lyngå 12 we derived (), an age of Myr and kpc (panel h); MS stars are detected in the range . For King 20 we found (), an age of Myr and kpc (panel k). MS stars are detected in the range . Additional parameters are given in Table 1.
Parameters of BH 63 were based on the observed photometry. We found (), Myr and kpc; the detected MS mass range is (panel a). BH 63 is a heavily reddened cluster, with .
3.4 Cluster structure
Cluster structure was inferred with the radial density profile (RDP), defined as the projected number-density of MS/evolved stars around the center. The RDPs were built with stars selected with the C-MFs (right panels of Fig. 3). The use of C-MFs to discard foreground/background field stars was applied in the analysis of the OCs M 67 (Bonatto & Bica BB2003 (2003)), NGC 3680 (Bonatto, Bica & Pavani BBP2004 (2004)), NGC 188 (Bonatto, Bica & Santos Jr. BBS2005 (2005)), NGC 6611 (Bonatto, Santos Jr. & Bica BSJB05 (2006)), and NGC 4755 (Bonatto et al. 2006b ). To avoid oversampling near the center and undersampling for large radii, the RDPs were built by counting stars in concentric rings with radius for , for , for and for .
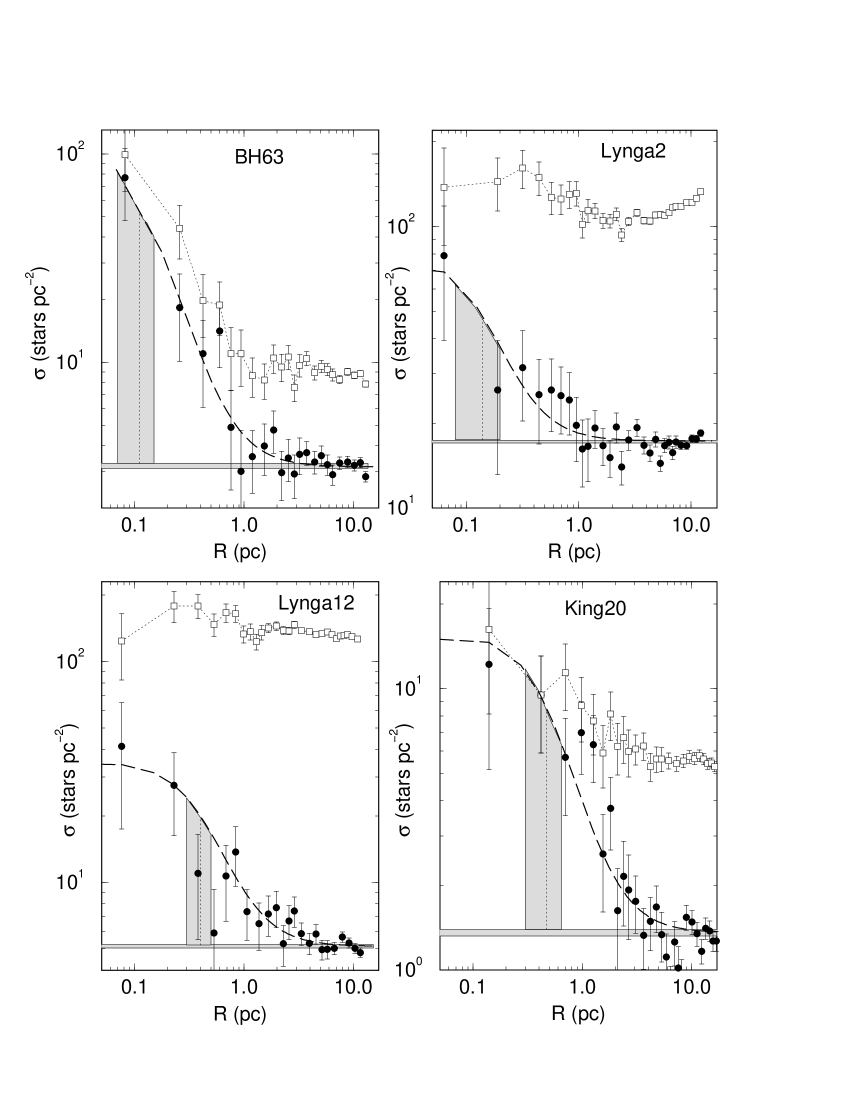
Fig. 5 shows the RDPs for the MS/evolved stars of the present OCs. For absolute comparison between clusters the radius scale was converted to parsecs and the number-density of stars to using the distances derived in Sect. 3.3. We also show in Fig. 5 the observed RDPs produced with photometry prior to the use of C-MF. Clearly, the filtered profiles present less fluctuations and go deeper into the cluster structure than the observed ones. In particular, the observed profiles tend to underestimate the cluster’s extension. As expected, the C-MF produced residual background levels much lower than the observed ones, especially for Lyngå 2 and Lyngå 12. Besides, C-MFs have proven to be essential to unveil the cluster centroid especially for faint OCs such as those in the present sample.
| Cluster | 1′ | ||||||||
|---|---|---|---|---|---|---|---|---|---|
| (pc) | (′) | (′) | (pc) | (pc) | |||||
| (1) | (2) | (3) | (4) | (5) | (6) | (7) | (8) | (9) | (10) |
| BH 63 | 0.680 | ||||||||
| Lyngå 2 | 0.254 | ||||||||
| Lyngå 12 | 0.304 | ||||||||
| King 20 | 0.560 |
-
Col. 2: arcmin to parsec scale. We express King profile as . To minimise degrees of freedom in the fit was kept fixed (measured in the respective offset fields) while and were allowed to vary. Note that and represent residual densities of stars, measured on the C-MF photometry.
Structural parameters were derived by fitting the C-MF RDPs with the two-parameter King (1966a ) surface density profile, which describes the central and intermediate regions of normal clusters (King 1966b ; Trager, King & Djorgovski TKD95 (1995)). The fits were performed using a nonlinear least-squares fit routine that uses errors as weights. To minimise degrees of freedom in the fit the background level () was kept constant, corresponding to the residual values measured in the corresponding offset fields (Sect. 3.1). Parameters derived from the fit are the King central density of stars () and core radius (). The resulting parameters are given in Table 3 and the best-fit solutions are superimposed on the C-MF RDPs (Fig. 5). A limiting radius () of a cluster can be estimated by considering the fluctuations of the RDPs with respect to the residual background. describes where the RDP merges into the background and, for practical purposes most of the cluster stars are contained within . For comparison purposes Table 3 provides parameters in angular and absolute units. Probably because of different methods and data sets the present values of and for Lyngå 2 correspond to about and of those given in Kharchenko et al. (Kharchenko05 (2005)). We verified that the centroid in both works is virtually coincident. The difference may be attributed to their brighter limits (Kharchenko et al. KPRSS04 (2004)) producing shallower profiles for this faint cluster.
Compared to other OCs (Sect. 5; Nilakshi Nilakshi2002 (2002); Tadross et al. Tad2002 (2002)), the present clusters are small both in core and limiting radii. This is particularly true for Lyngå 2 and BH 63.
Within uncertainties, King profiles provide a good analytical representation of the stellar RDPs of Lyngå 12 and King 20, from the external parts to the core. However, because of the small size of BH 63 and Lyngå 2 (and the larger distance of BH 63) their RDPs do not reach much into the core. In BH 63 (and to a lesser extent Lyngå 2) the RDP seems to increase almost linearly (in a log-log scale) with decreasing distance to the center with no evidence of the King-like core turnover. Consequently, we cannot compare the actual stellar density profiles of BH 63 and Lyngå 2 inside the core with the King profile. Two interpretations are possible. Either the very central region was not accessed or the linear increase points to a post-core collapse structure as those observed by Trager, King & Djorgovski (TKD95 (1995)) for several post-core collapse globular clusters.
Since it follows from an isothermal (virialized) sphere, the close similarity of a cluster’s stellar RDP with a King profile suggests that the internal structure (particularly the core) has reached some important level of energy equipartition at the cluster age. We return to this point in Sect. 5.
4 Luminosity and mass functions
The 2MASS quality photometry along with the methods presented in Bonatto & Bica (BB2005 (2005) and references therein) allows one to derive luminosity and mass functions for the core, halo and overall (i.e. the whole cluster) regions for the present faint clusters.
| Evolved | Observed MS | |||||||||
| Region | ||||||||||
| (stars) | () | (stars) | () | (stars) | () | () | () | |||
| (1) | (2) | (3) | (4) | (5) | (6) | (7) | (8) | (9) | (10) | (11) |
| BH 63 — MS: — Myr | ||||||||||
| Core | — | — | ||||||||
| Halo | — | |||||||||
| Overall | ||||||||||
| Lyngå 2 — MS: — Myr | ||||||||||
| Core | — | — | ||||||||
| Halo | — | |||||||||
| Overall | ||||||||||
| Lyngå 12 — MS: — Myr | ||||||||||
| Core | ||||||||||
| Halo | — | |||||||||
| Overall | ||||||||||
| King 20 — MS: — Myr | ||||||||||
| Core | ||||||||||
| Halo | — | |||||||||
| Overall | ||||||||||
-
Col. 6: stellar mass of the observed MS. Col. 8: mass extrapolated to 0.08 . Col. 11: dynamical-evolution parameter .
In all clusters, the resulting faint-magnitude limit of the MS stars, isolated with the C-MFs (Fig. 3), is brighter than that of the 99.9% Completeness Limit (Sect. 3). To take the residual field-star contamination into account, we build LFs for each cluster region and offset field separately. , and LFs are built by counting stars in magnitude bins from the respective faint magnitude limit to the turn-off, for cluster and offset field regions. Magnitude bins are wider in the upper MS than in the lower MS to avoid undersampling near the turn-off and oversampling at the faint limit. Corrections are made for different solid angles between offset field and cluster regions. Cluster LFs are obtained by subtracting the offset-field LFs. They are transformed into MFs using the mass-luminosity relations obtained from the respective Padova isochrones and observed distance modulii (Sect. 3). These procedures are applied independently to the three 2MASS bands. Because of differences among the , , and mass-luminosity relations, the respective MFs are sampled in different mass values. Consequently, the final MF is simply a superposition of the , and MFs. Detected MS mass ranges are , , and , respectively for BH 63, Lyngå 2, Lyngå 12 and King 20. Sub-solar mass stars are expected to populate the MS of OCs older than Myr, however, they cannot be detected with 2MASS because of the increasing fraction of field-star contamination in that mass range (right panels of Fig. 3). The observed MS range was fitted with the function .
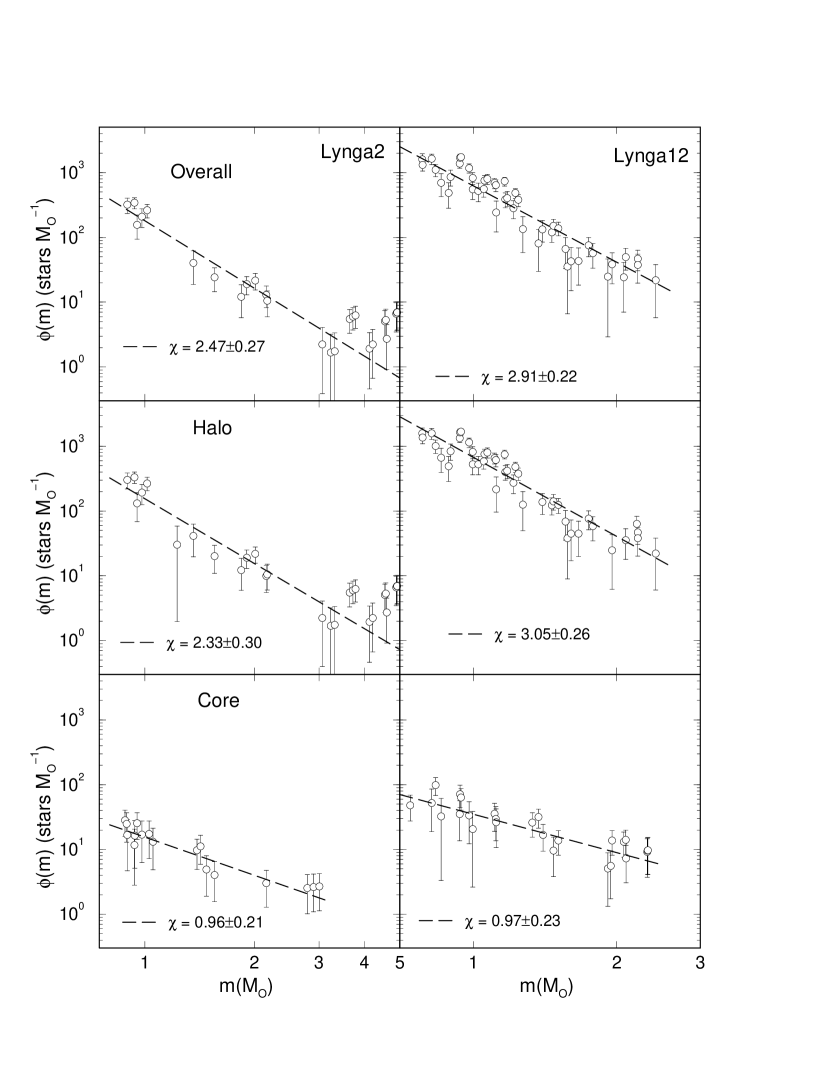
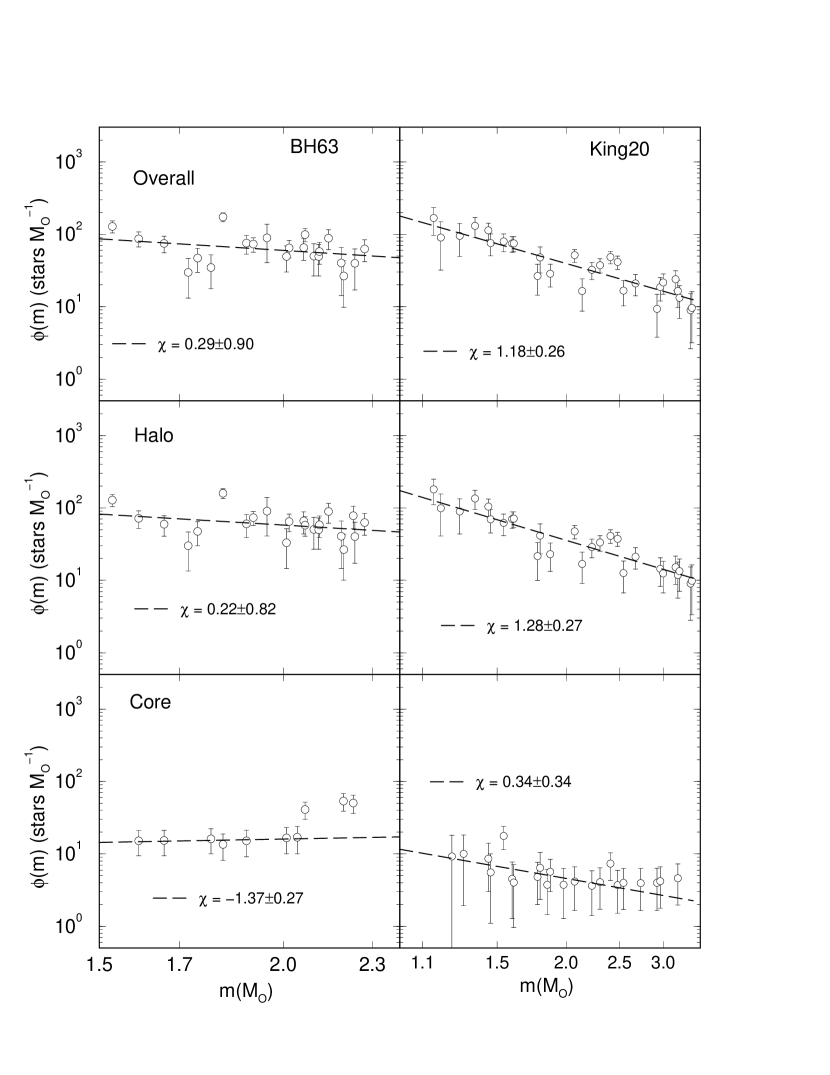
The overall, halo and core MFs of Lyngå 2 and Lyngå 12 are shown in the left panels of Fig. 6, while those of BH 63 and King 20 are in the right panels. The MF slopes are given in col. 4 of Table 4.
A common feature among the OCs is the flat core MF, particularly in BH 63; the overall MF of this OC is much flatter than Salpeter’s (Salpeter55 (1955)) IMF (). Lyngå 2 and Lyngå 12 have halo and overall MFs steeper than Salpeter (Sect. 5).
4.1 Cluster mass
Parameters derived from the core, halo and overall MFs of the target clusters are given in Table 4. The number of evolved stars (col. 2) in each region was obtained by integration of the respective field-star subtracted LF for stars brighter than the turnoff. Multiplying this number by the mass at the turn-off yields an estimate of the mass stored in evolved stars (col. 3). The observed number of MS stars and corresponding mass (cols. 5 and 6, respectively) were derived by integrating the MFs in the mass ranges.
To estimate the total mass locked up in stars we extrapolate the observed MFs down to the H-burning mass limit () since these stars are expected to be present in the MS of OCs older than 90 Myr. In the mass range below the present detection threshold (Table 4) we base the extrapolation on Kroupa’s (Kroupa2001 (2001)) universal Initial Mass Function (IMF), in which for the range and for . We remark that in the cases where our MF slopes are flatter than or similar (within uncertainties) to Kroupa’s, we directly use the former slopes, e.g. the three MFs of BH 63; for the core MF of Lyngå 2 we use our slope in the range , and Kroupa’s for .
The total (extrapolated MS evolved) values of number, mass, projected and volume densities are given in cols. 7 to 10 of Table 4.
5 Diagnostic-diagrams of dynamical states
The King-like RDPs (Fig. 5) and the change in MF slope from core to halo (Fig. 6) may be a consequence of dynamical evolution in the present OCs, particularly in the core. At this point it is interesting to see how these faint clusters compare with a set of nearby OCs in terms of structure and dynamical state.
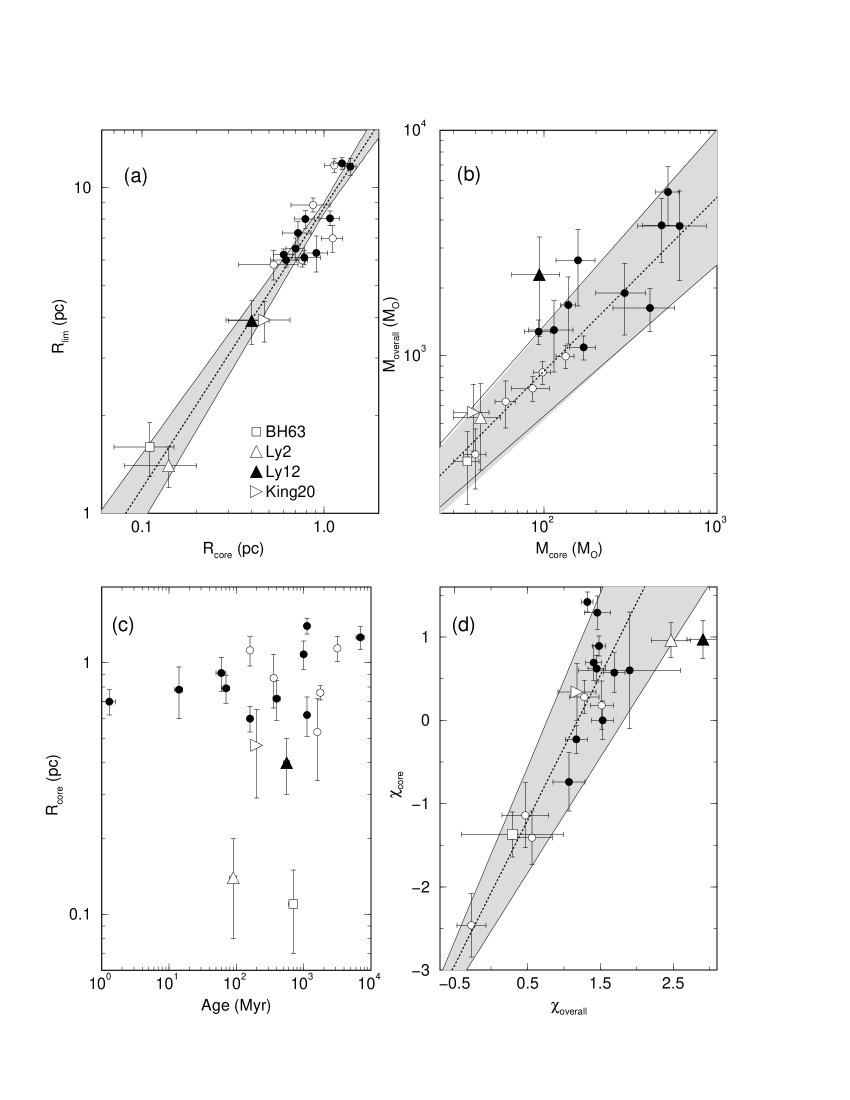
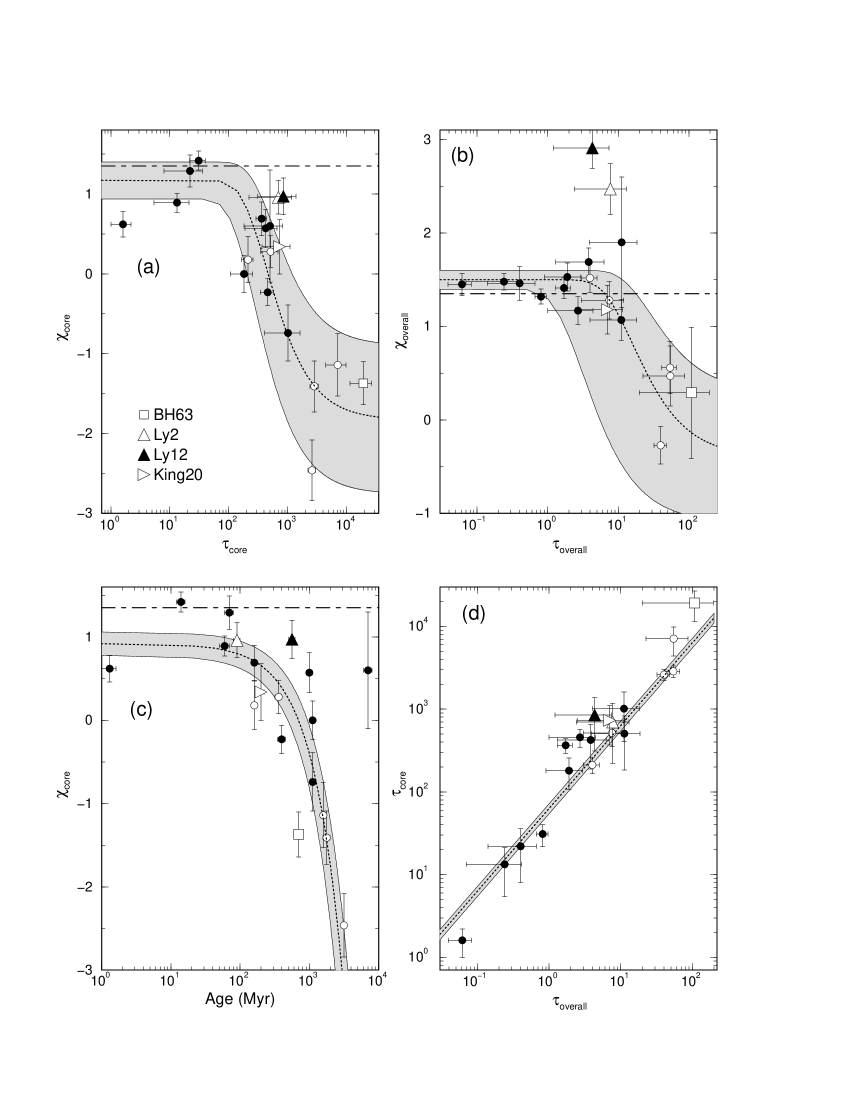
Bonatto & Bica (BB2005 (2005)) derived a set of parameters related to the structure and dynamical state of nearby OCs with ages in the range Myr and masses within , following most of the present methodology. To the original sample were added the very young OC (age Myr) NGC 6611 (Bonatto, Santos Jr. & Bica BSJB05 (2006)) and the young one (age Myr) NGC 4755 (Bonatto et al. 2006b ). The evolutionary parameter (col. 11 of Table 4), where is the relaxation time, was found to be a good tracer of dynamical states. In general terms, is a measure of the dynamical age of a cluster as a whole or of a cluster’s internal region. In this sense, effects of dynamical processes such as mass segregation and low-mass star evaporation on MF slopes are expected to become more conspicuous with increasing . In particular, Bonatto & Bica (BB2005 (2005)) observed that significant flattening in core and overall MFs due to dynamical effects occurs for and , respectively. The difference in core and overall threshold is associated with the different average physical conditions in both regions, such as density and gravitational potential, which in turn affect . Further discussions and details on parameter correlation in the reference sample are in Bonatto & Bica (BB2005 (2005)).
Core and overall radii in the reference sample are related by the equation . Despite the small sizes of BH 63 and Lyngå 2, the present OCs have and consistent with that relation at the level (panel a of Fig. 7). The same occurs for the core and overall (extrapolated) mass (, panel b). Within uncertainties, both slopes are the same which is probably a consequence of scaling, in the sense that on average massive clusters tend to be big. About of the reference sample suggests a trend of increasing core radius with age (panel c), while the remaining ones - Lyngå 2 and BH 63 in particular - appear to follow a sequence of decreasing with age. Except for the steep overall MF of Lyngå 12, the remaining OCs have MF slopes consistent with those of the reference sample (panel d).
Relations involving MF slope and dynamical-evolution parameter (Fig. 8) can be used for inferences on dynamical states. Panels (a) and (b) suggest that both the core and overall MF slopes decay with the evolutionary parameter according to (Bonatto & Bica BB2005 (2005)), where represents the MF slope at cluster birth, while gives the amount of slope flattening for advanced evolutionary states. Panel (c) suggests a systematic flattening of the core MF slope with cluster age, particularly for the less-massive OCs777The deviant object is the Gyr, massive OC NGC 188 whose orbit avoids the inner regions of the Galaxy for most of the time (Bonatto, Bica & Santos Jr. BBS2005 (2005) and references therein).. Except for NGC 188, the age dependence of the core MF slope can be parameterised by the linear-decay function , where may be interpreted as the core MF slope in the early phases of the cluster, and is the flattening time scale associated mostly with mass segregation. We find Myr and , a value significantly flatter than that of Salpeter IMF. Core and overall evolutionary parameters (panel d) are related by . Further discussions are in Bonatto & Bica (BB2005 (2005)).
As shown in all panels of Fig. 8, BH 63 presents clear signs of accelerated dynamical evolution, particularly in the core. With flat MF slopes and large dynamical evolution parameters, the core and overall regions of BH 63 appear to be extreme cases of OC dynamical evolution (especially in panels a and b). One possibility is that interaction with the nebula FeSt 1-108 (Sect. 2) may have accelerated its dynamical evolution. Although to a lesser degree, similar evidence for the core and overall regions of King 20 is provided in all panels. The cores of Lyngå 2 and Lyngå 12 show marginal evidence of dynamical evolution (flat MF slopes).
6 Concluding remarks
In this paper, we derived photometric and structural parameters of the faint open clusters BH 63, Lyngå 2, Lyngå 12, and King 20 with , and 2MASS photometry, restricted to stars with observational uncertainties mag. BH 63 is significantly more reddened than the others, with . Distance from the Sun ranges from kpc (Lyngå 2) to kpc (BH 63). Lyngå 2 and Lyngå 12 are located inside the Solar circle.
The use of C-MFs allowed us to obtain accurate parameters for such faint clusters including mass function slopes for the core and halo. In particular, radial density profiles built with C-MF photometry are better defined and yield more constrained structural parameters than the observed ones. The RDPs of Lyngå 12 and King 20 are well-represented by a King profile. Lyngå 2 and BH 63 appear to be very small, with core and limiting radii of pc and pc. However, they fit in the small core and limiting radii tail of the OC distribution. Lyngå 12 and King 20 have pc and pc.
The open clusters of the present sample have flat core MFs, suggesting dynamically evolved systems, particularly BH 63, which has a flat MF in its halo as well. The total mass locked up in stars (extrapolated down to ) ranges from (BH 63) to (Lyngå 12).
We also analysed the clusters with dynamical and structural diagnostic diagrams. BH 63 appears to be an extreme case of OC dynamical evolution both in its core and halo, perhaps due to interaction with the nebula FeSt 1-108. King 20 shows signs of dynamical evolution as well, but to a lesser degree. The cores of Lyngå 2 and Lyngå 12 present marginal evidence of dynamical evolution.
The present work shows that it is possible to explore faint OCs with 2MASS photometry, provided care is taken to identify probable member stars (to better define the cluster sequence on CMDs) and discard stars with discordant colour (for more intrinsic cluster RDPs and MFs). The use of field-star decontamination and colour-magnitude filters on the fields of BH 63, Lyngå 2, Lyngå 12 and King 20 allowed us to obtain good results for the fundamental, structural and dynamical-evolution related parameters.
Acknowledgements.
We thank the anonymous referee for helpful suggestions. This publication makes use of data products from the Two Micron All Sky Survey, which is a joint project of the University of Massachusetts and the Infrared Processing and Analysis Center/California Institute of Technology, funded by the National Aeronautics and Space Administration and the National Science Foundation. This research has made use of the WEBDA database, operated at the Institute for Astronomy of the University of Vienna. CB and EB acknowledge support from the Brazilian Institution CNPq, and RB a CNPq/UFRGS PIBIC fellowship.References
- (1) Alter, G., Balazs, B., Ruprecht, J. & Vanysek, J. in Catalogue of star clusters and associations, Budapest: Akademiai Kiado, 1970, 2nd ed., edited by G. Alter, B. Balazs, J. Ruprecht
- (2) Bessel, M.S. & Brett, J.M. 1988, PASP, 100, 1134
- (3) Bica, E., Bonatto, C. & Dutra, C.M. 2003, A&A, 405, 991
- (4) Bica, E., Bonatto, C. & Dutra, C.M. 2004, A&A, 422, 555
- (5) Bica, E. & Bonatto, C. 2005, A&A, 443, 465
- (6) Bica, E., Bonatto, C., Barbuy, B. & Ortolani, S. 2006, A&A, 450, 105
- (7) Bonatto, C. & Bica, E. 2003, A&A, 405, 525
- (8) Bonatto, C., Bica, E. & Girardi, L. 2004, A&A, 415, 571
- (9) Bonatto, C., Bica, E. & Pavani, D.B. 2004, A&A, 427, 485
- (10) Bonatto, C. & Bica, E. 2005, A&A, 437, 483
- (11) Bonatto, C., Bica, E. & Santos Jr., J.F.C. 2005, A&A, 433, 917
- (12) Bonatto, C., Santos Jr., J.F.C. & Bica, E. 2006, A&A, 445, 567
- (13) Bonatto, C., Kerber, L.O., Santiago, B.X. & Bica, E. 2006a, A&A, 446, 121
- (14) Bonatto, C., Bica, E., Ortolani, S. & Barbuy, B. 2006b, A&A, 453, 121
- (15) Bonatto, C. & Bica, E. 2006, A&A, in press
- (16) Dias, W.S., Alessi, B.S., Moitinho, A. & Lépine, J.R.D. 2002, A&A, 389, 871
- (17) Dutra, C.M., Santiago, B.X. & Bica, E. 2002, A&A, 383, 219
- (18) Dutra, C.M. & Bica, E. 2002, A&A, 381, 631
- (19) Feitzinger, J.V. & Stüwe, J.A. 1984, A&AS, 58, 355
- (20) Friel, E.D. 1995, ARA&A, 33, 38
- (21) Girardi, L., Bertelli, G., Bressan, A., et al. 2002, A&A, 391, 195
- (22) Janes, K.A. & Phelps, R.L. 1994, AJ, 108, 1773
- (23) Kharchenko, N.V., Piskunov, A.E., Röser, S., Schilbach, E. & Scholz, R.-D. 2005, A&A, 438, 1163
- (24) Kharchenko, N.V., Piskunov, A.E., Röser, S., Schilbach, E. & Scholz, R.-D. 2004, AN, 325, 740
- (25) King, I. 1966a, AJ, 71, 64
- (26) King, I. 1966b, AJ, 71, 276
- (27) Kroupa, P. 2001, MNRAS, 322, 231
- (28) Lindoff, U. 1968, ArA, 4, 471
- (29) Lyngå, G. 1982, A&A, 109, 213
- (30) Mermilliod, J.C. 1996, in The Origins, Evolution, and Destinies of Binary Stars in Clusters, ASP Conference Series, eds. E.F. Milone & J.-C. Mermilliod, 90, 475
- (31) Nilakshi, S.R., Pandey, A.K. & Mohan, V. 2002, A&A, 383, 153
- (32) Piskunov, A.E., Kharchenko, N.V., Röser, S., Schilbach, E., Scholz, R.-D. 2006, A&A, 445, 545
- (33) Reid, M.J. 1993, ARA&A, 31, 345
- (34) Ruprecht, J. 1966, BAICz, 17, 33
- (35) Salpeter, E. 1955, ApJ, 121, 161
- (36) Skrutskie, M., Schneider, S.E., Stiening, R., et al. 1997, in The Impact of Large Scale Near-IR Sky Surveys, ed. Garzon et al., Kluwer (Netherlands), 210, 187
- (37) Soares, J.B. & Bica, E. 2002, A&A 388, 172
- (38) Tadross, A.L., Werner, P., Osman, A. & Marie, M. 2002, NewAst, 7, 553
- (39) Trager, S.C., King, I.R. & Djorgovski, S. 1995, AJ, 109, 218
- (40) van den Bergh, S. & Hagen, G.L. 1975, AJ, 80, 11