A Subaru/Suprime-Cam wide-field survey of globular cluster populations around M87 - II: Colour and spatial distribution
Abstract
We have performed a wide-field imaging survey of the globular cluster (GC) populations around M87 with Suprime-Cam on the 8.2m Subaru Telescope. A field extending from the centre of M87 out to a radius of 0.5 Mpc was observed through the filters. By investigating the GC colour distribution as a function of distance from M87 and NGC 4552, another luminous Virgo elliptical in our survey field, it is found that clear bimodality ( and 1.2) is seen only in the inner regions ( kpc) of the host galaxies and that it becomes weaker with radius due to the decreasing contribution of the red GC () subpopulation. It is also found (both around M87 and NGC 4552) that while the spatial distribution of the red GCs is as centrally concentrated as the host galaxy halo light distribution, the distribution of the blue GCs () tends to be more extended. However, the blue GC distribution around M87 is not as extended as the Virgo cluster mass density profile. Based on these facts, we argue that the contribution of GCs associated with the Virgo cluster (e.g., intergalactic GCs) is not significant around M87 and is not the primary reason for the high value of M87. Instead, most of the blue GCs around luminous ellipticals, as well as the red GCs, are presumed to be associated with the host galaxy.
We model the radial profile of GC surface densities out to 0.5 Mpc from M87 by a superposition of the GC populations associated with M87 and with NGC 4552. It is found that there are some regions where the GC surface densities are larger than expected from this model, suggesting the existence of an additional intergalactic GC (i-GC) population independent of the luminous ellipticals. By comparing the estimated i-GC surface density with the luminosity density of the intracluster stellar population inferred from the intergalactic planetary nebulae in the Virgo cluster, we obtain a crude estimate of i-GC specific frequency . If this value represents the stellar population tidally stripped by a massive central galaxy from other (less luminous) galaxies, the contribution of tidally captured GCs in the GC population of M87 would need to be low to be consistent with the high value of M87.
keywords:
galaxies: elliptical and lenticular, cD — galaxies: star clusters — galaxies: evolution — galaxies: formation — galaxies: individual: NGC 4486, NGC 4552— galaxies: clusters: individual: Virgo cluster.1 INTRODUCTION
Globular cluster (GC) populations are one of the key probes of the archeology of their host galaxy because GCs contain stars with a single age and metallicity and are therefore in principle simpler to interpret than the integrated light of field stars. One of the most exciting recent developments in the study of extragalactic GCs is the discovery that many luminous elliptical galaxies have bimodal or multimodal colour distributions of GCs (e.g., Gebhardt & Kissler-Patig 1999; Larsen et al. 2001; Brodie et al. 2005). Since this is unlikely to be produced in a model of elliptical galaxy formation with a simple monolithic collapse and subsequent star formation, more elaborate models have been proposed. One is the multiphase collapse scenario (Forbes, Brodie & Grillmair 1997), where all GCs are presumed to form coevally with the host galaxy in a massive burst of star formation within a short time scale at high redshift and are therefore expected to be uniformly old. Since the starburst is presumed to be split into several discrete phases, some of the GCs will form in gas clouds more polluted by earlier star formation, which could result in a red GC subpopulation. Another proposed model is the merger scenario (Ashman & Zepf 1992), where luminous ellipticals are presumed to have formed via gas-rich galaxy mergers which induce the formation of additional red GCs, while the blue ones originate in the progenitor galaxies. In this case, the blue and red GC subpopulations would contain predominantly old/metal-poor GCs and younger/metal-rich GCs, respectively. Beasley et al. (2002) found that GC bimodality was a general characteristic of hierarchical merging models in which the formation of blue GCs was truncated at high redshift.
However, most of the elliptical galaxies whose GC populations have so far been intensively studied reside in high density environments. The GC properties upon which the proposed scenarios are based may therefore not be intrinsic but may have been substantially modified by environmental effects. Field stars in the outer parts of galaxies can be stripped off into intergalactic space due to tidal interactions between galaxies and the cluster potential, and as a result of high-speed encounters between galaxies. In fact, observations have now provided direct evidence for such an intracluster stellar population in the form of planetary nebulae (PNe) (e.g., Theuns & Warren 1997; Feldmeier et al. 2004a; Arnaboldi et al. 2004), red giant branch stars (Durrell et al. 2002), and diffuse light (e.g., Feldmeier et al. 2002, 2004b). It is believed that GCs may also be stripped from galaxies by tidal interactions, suggesting that intergalactic space may harbour a potential reservoir of GCs which needs to be taken into account to understand the evolution of GC populations. In an alternative explanation of the bimodality of GCs known as the accretion scenario (Côté, Marzke, & West 1998), the blue (metal-poor) GCs are assumed to have been captured from other (presumably less luminous) galaxies through tidal stripping and/or accretion. A population of intergalactic GCs (“i-GC” hereafter) may naturally explain the fact that GCs tend to be extremely populous around central cluster galaxies, because they would be most likely to be surrounded by a significant population of i-GCs (West et al. 1995). By surveying directly for i-GCs and characterizing this population, it is possible to test the validity of the accretion scenario and improve our understanding of the formation of GC populations. Furthermore, the i-GC specific frequency could be estimated by comparing the luminosity of the intracluster stellar population with the total number of i-GCs. Since GC specific frequency is considered to depend on galaxy morphology, this would give an insight into the parent galaxy type and luminosity of i-GCs and the physical processes of galaxy interactions.
To date, however, there is no firm evidence for or against the existence of i-GCs (Bassino et al. 2003; Jordán et al. 2003; Marín-Franch & Aparicio 2003). In fact, several technical difficulties must be overcome to find i-GCs. Firstly, the surface number density of i-GCs is inferred to be highest around the cluster centre because tidally stripped GCs are expected to be distributed like the mass distribution of the host galaxy cluster (White 1987; Muzzio 1987; West et al. 1995), but a cD galaxy or giant elliptical is located at the cluster centre in many cases. Since luminous ellipticals are normally surrounded by thousands of GCs, a large area needs to be surveyed to see whether there are additional i-GCs and to discriminate them from GCs associated with the central galaxy. This search needs to extend over several hundred kilo-parsecs from the cluster centre, since the GC population in a luminous elliptical galaxy may extend out to 100 kpc (Rhode & Zepf 2001; Dirsch et al. 2003). By surveying a contiguous region around the central galaxy, one may be able to detect an apparent change in the slope of the radial profile of GC surface number densities due to the presence of i-GCs. Secondly, GCs need to be probed down to a very low surface number density to investigate the spatial structure of their distribution out to such large radii. It is suggested by recent wide-field studies of GC populations in luminous ellipticals that the GC surface number density in the outer halos is 1 arcmin-2 (Rhode & Zepf 2001, 2004; Dirsch et al. 2003; Dirsch, Schuberth & Richtler 2005). If this is a mixture of GCs associated with the host galaxy and i-GCs, the i-GC surface number density would be even lower. In fact, a recent study of GC populations in the Fornax cluster has suggested an i-GC surface number density of arcmin-2 (Bassino et al. 2003). Accordingly, selection of GCs and statistical subtraction of foreground and background contamination will have to be carefully performed.
In this paper and a companion paper (Tamura et al. 2006; Paper I hereafter), we report a wide-field imaging survey in the , , and bands of the GC populations around M87, the luminous elliptical galaxy at the centre of the Virgo cluster, conducted with Suprime-Cam on the Subaru Telescope. The survey area is (560 kpc 140 kpc) which is the widest survey yet undertaken of the GC populations around luminous ellipticals (the survey depth is similar or slightly deeper than the previous ground-based surveys). We also make use of wide-field imaging data on control fields taken with Subaru/Suprime-Cam to correct for foreground and background contamination. The observations, data reduction and data analyses including the selection of GC candidates, incompleteness corrections, and subtraction of foreground and background contamination in the GC candidates are presented in Paper I, where we also present GC luminosity functions and global GC specific frequencies of M87 and NGC 4552. The present paper is dedicated to the investigation of the colour distribution and spatial distribution of GCs. Observational results are presented in the next section and are discussed further in § 3. We summarize this paper in § 4. We adopt a distance of 16.1 Mpc (distance modulus of 31.03) to M87, and 15.4 Mpc (distance modulus of 30.93) to NGC 4552, based on measurements using the surface brightness fluctuation method (Tonry et al. 2001). An angular scale of 1′ corresponds to 4.7 kpc and 4.5 kpc at the distance of M87 and NGC 4552, respectively.
2 RESULTS
2.1 Colour Distribution
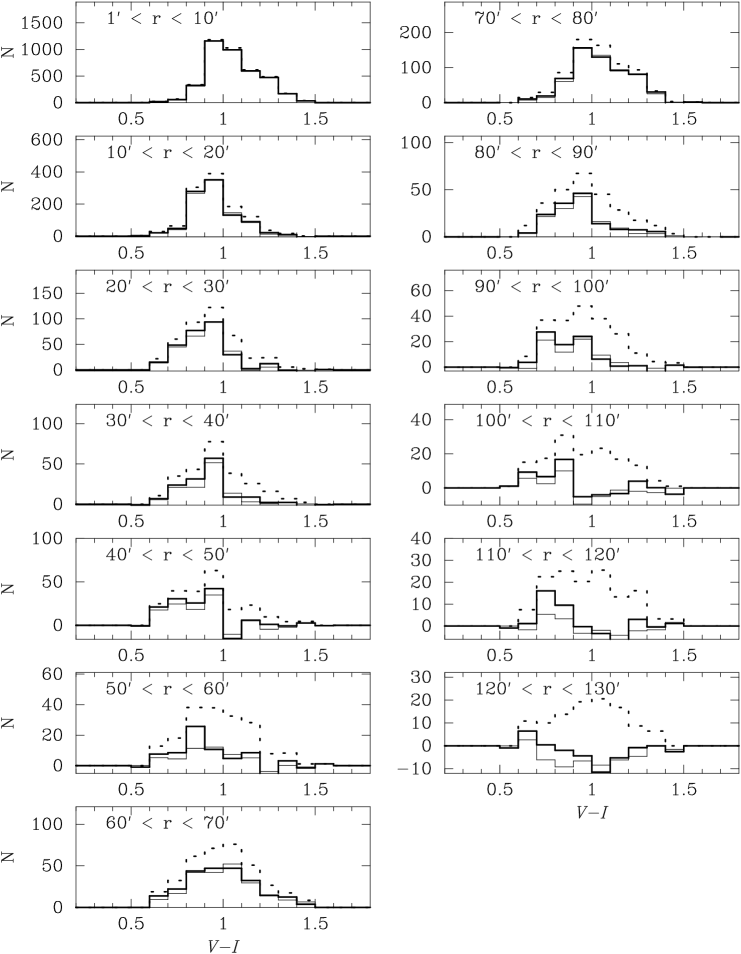
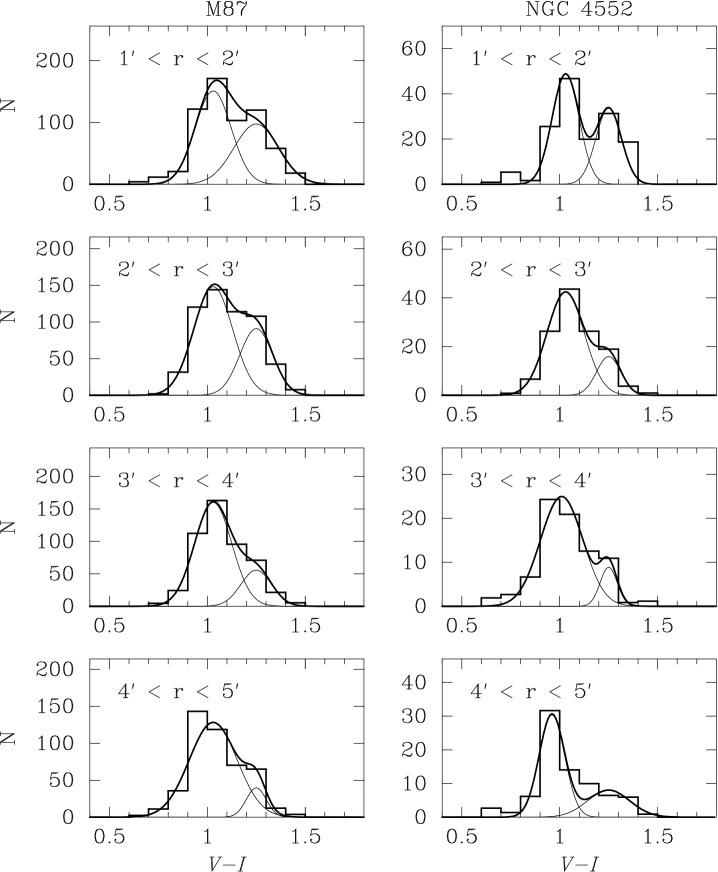
Since the errors in the colours tend to be smaller than those of (see Paper I), we investigate trends of GC colour distributions with distance from the host galaxy using colours. Also, in order to keep as much sensitivity as possible to any features in the GC colour distribution, we restrict the GC sample to those brighter than mag, where incompleteness corrections are not significant (Paper I). In Fig. 1, GC colour distributions within annuli centered on M87 are shown. The dotted lines indicate raw GC colour distributions without incompleteness correction and control field subtraction. The thick (thin) lines show results after incompleteness correction and control field subtraction using the data from the HDF-N (LH) field, respectively. Most of these colour distributions show deviations from a single Gaussian and the sum of two Gaussians give a better fit as indicated by KMM tests (Ashman, Bird & Zepf 1994). However, the presence of a clearly defined red peak at is confined primarily to the inner regions of both galaxies. In Fig. 2, the GC colour distributions within a restricted distance of ( kpc) from each galaxy centre are shown. Double Gaussians are fitted to these colour distributions and are shown as smooth curves. In both M87 and NGC 4552, evidence for bimodality is seen with peaks at 1.2 mag and 1.0 mag, respectively, as previously found in the core regions () with HST (Whitmore et al. 1995; Elson & Santiago 1996a; Elson & Santiago 1996b; Neilsen & Tsvetanov 1999; Kundu et al. 1999; Kundu & Whitmore 2001; Larsen et al. 2001; Jordán et al. 2002). Using simple stellar population models by Vazdekis et al. (1996) with an age of 12.6 Gyr and a Salpeter initial mass function, a linear relationship between colour and metallicity111Yoon, Yi & Lee (2006) have recently suggested a non-linearity in the relationship between GC colour and metallicity driven by metallicity dependence of horizontal branch morphology. This would need to be considered when GC metallicity is discussed in detail, whilst we use the linear approximation in this paper because almost all the discussions are on a colour basis and do not depend on calibration of colour to metallicity. is found to be as follows:
| (1) |
The metallicities corresponding to the peak colours are therefore estimated to be and . Fig. 2 also suggests that the bimodality is less clear in the outer regions due mainly to the decreasing contribution of red GCs (see also Dirsch et al. 2003; Forbes et al. 2004).222This trend is similar to the global trend seen in individual galaxies for which the red GC subpopulation is less significant in less luminous early-type galaxies (e.g., Peng et al. 2006). Both may reflect a decrease of average GC metallicity with decreasing galaxy mass and increasing galactocentric distance, given the colour-metallicity calibration by Yoon et al. (2006). We note that the peak colours of the GC colour distributions in Fig. 2 tend to be slightly ( mag) redder than the estimates using the HST data corrected for Galactic extinction ( mag, which is considered in our study). This difference may be attributed to a calibration error, giving an uncertainty of 0.2 dex in metallicity estimated from . This discrepancy however does not affect any discussions hereafter.
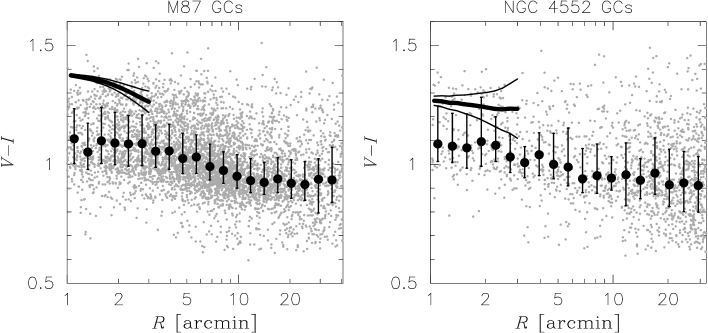
In Fig. 3, colours of GC candidates with mag are plotted against distance from M87 and NGC 4552. The average GC colour is calculated in a radial bin and is indicated with a circle. The 25- and 75-percentiles of the colour distributions in each radial bin are shown by the top and bottom of error bars, respectively. This figure suggests that the mean GC colour becomes bluer with increasing distances from the host galaxy centres. The colour gradient is estimated to be or for the M87 GC population and or for the NGC 4552 GC population. These estimations are performed using the GC colours within 15′ from the host galaxy centre. These colour gradients are probably due to a combination of the decreasing fraction of red GCs with radius and a colour gradient within each subpopulation. The latter is clearly suggested by Fig. 3 at least for the blue GC subpopulation; whereas 45 % of the blue GCs () are bluer than mag near the galaxy centre (e.g., ), the fraction increases (i.e. the average colour of the blue GCs becomes bluer) with radius and it becomes 80 % at . This is the case both in M87 and NGC 4552.
However, GC colour gradients seem to be much less significant outside of ( kpc) in both of the luminous ellipticals. The absence of a colour gradient outside a certain radius is qualitatively consistent with the result for NGC 4472 by Rhode & Zepf (2001) who find a marginal colour gradient () within or kpc, but no significant colour gradient outside of this radius. These results suggest that the blue GC population has no metallicity gradient in the outer region of a luminous elliptical galaxy. We note that the colour selection of GC candidates is not designed to sample GCs bluer than , but this colour corresponds to if GCs are old (see equation (1)) and GCs with this extremely low metallicity are expected to be rare.
The solid line overplotted in Fig. 3 shows the colour profile of the host galaxy halo light; the thick line indicates the measured colour profile and the thin lines show the envelope due to errors in the background estimation, which is represented by the standard deviation of pixel values on a CCD frame in the same field as the galaxy but with no very bright stars or galaxies present. The colour gradient of the host galaxy halo light is estimated to be in M87 and in NGC 4552 within . This indicates that in M87, the colour gradient of the host galaxy tends to be steeper than the GC colour gradient, while both are mutually consistent within the errors for NGC 4552. We note that the colour gradient of the M87 halo light is steeper than previous estimates in the core region () e.g. in Peletier et al. (1990) and in Goudfrooij et al. (1994), so even less steep gradients are expected in colour. 333Using simple stellar population models by Vazdekis et al. (1996) with an age of 12.6 Gyr old and a Salpeter initial mass function, the sensitivities of , and to metallicity variation are compared as and . These can be used to convert a or colour gradient to that in , assuming that colour gradients are driven by metallicity variations (e.g., Tamura et al. 2000). The difference probably comes from the significant bluing of colour with increasing radius exhibiting in our data especially at (Fig. 3), which has not been investigated in the previous studies. Fig. 3 also indicates that the host galaxy colour, varying at radii between and from 1.37 mag to 1.26 mag in M87, and 1.27 mag to 1.24 mag in NGC 4552, is slightly redder than the mean colour of the red GC subpopulation ( mag). We restrict the host galaxy colour profiles to those inside because they are highly uncertain outside of this radius.
2.2 Spatial Distribution
2.2.1 Radial profiles of GC surface densities
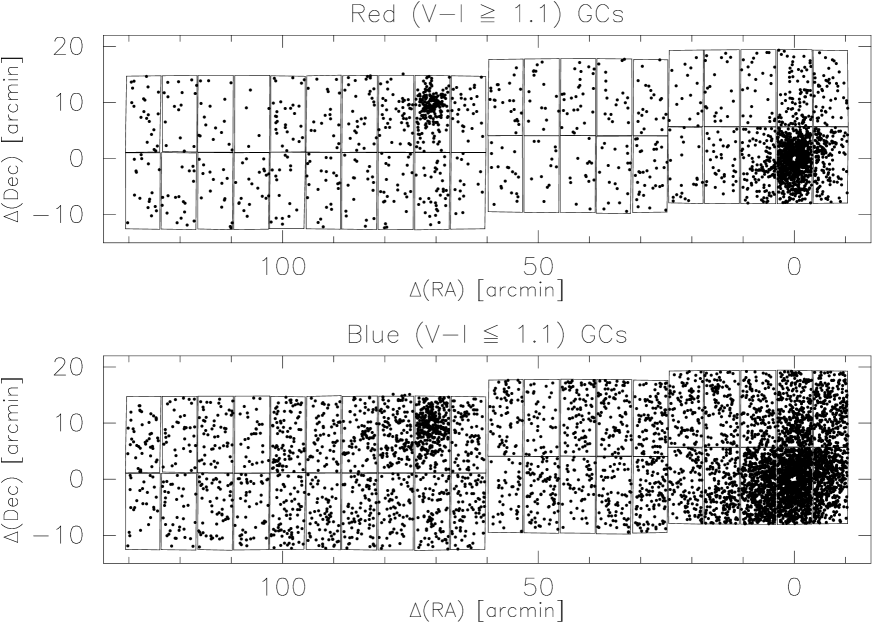
The spatial distribution of the GC candidates with mag is shown in Fig. 4. The red GCs () are plotted in the upper panel, and the blue GCs () are plotted in the lower panel (the boundary of the colour between red GCs and blue GCs approximately separates the two peaks in the bimodal colour distribution). M87 is at coordinates (0, 0), and NGC 4552 is at (72, 10). This figure indicates that the red GCs exist only near the luminous ellipticals, while the blue GCs tend to be extended out to larger distances. This trend can be more clearly seen in a plot of GC surface densities as a function of distance from the host galaxy, which is shown below. We use the HDF-N data to subtract the foreground and background contamination but our results and subsequent discussions do not change if the LH data are used.
In order to compute the total number of GCs as a function of distance from the host galaxy (M87 or NGC 4552), we integrate the GCLF in each radial bin down to either the magnitude where the completeness in that radial bin is 50 % or mag whichever is the brighter. We then multiply the number of GCs by a correction factor to take into account the GCs fainter than this magnitude limit. This correction factor is calculated using the Gaussian fit to the GCLF in the inner regions of M87 and NGC 4552 (Paper I) and it is used independently of the radial bin. Since the shapes of the GCLFs for the red and blue GC subpopulations appear to be different (Paper I), the correction factor for each subpopulation is calculated from the Gaussian fit to the GCLF of that subpopulation.

Radial profiles of GC surface number densities are presented in Fig. 5 for the M87 GCs in the left panel and the NGC 4552 GCs in the right panel. Filled triangles and open circles are the number densities of the red and blue GC subpopulation, respectively, and solid circles are those of the total GC population. The error bar represents a Poisson error at a given radius estimated from the number of GCs in this annulus and the number of contaminating objects in the control field normalized to the same area. The slopes of these radial profiles are calculated by fitting regression lines. For M87, the slope of the red, blue, and total GC density profile () is , , and , respectively. The slopes for the NGC 4552 GC profiles are quite similar to those for the M87 GCs; , , and for the red, blue, and total GC density profile, respectively. The host galaxy halo light distributions in the band are also shown by dashed lines. These are arbitrarily shifted in the vertical direction to enable comparison with the GC distributions. The slope of the surface brightness distribution () is calculated to be for M87 and for NGC 4552.
Figure 5 therefore demonstrates that the GC distribution tends to be more extended than the host galaxy halo light, which has also been found in NGC 4472 (Harris 1986), NGC 1399 (Dirsch et al. 2003), NGC 4649 (Forbes et al. 2004) and NGC 4374 (Gómez & Richtler 2004). It also indicates that while the distribution of the red GC subpopulation is as centrally concentrated as (or possibly slightly more concentrated than) that of the halo light, the distribution of the blue GC subpopulation tends to be more extended as has been pointed out previously not only for M87 (Côté et al. 2001) but also for some other luminous ellipticals: NGC 4472 (Lee, Kim & Geisler 1998), NGC 4649 (Forbes et al. 2004) and NGC 1399 (Bassino et al. 2006). We investigate the GC distribution in further detail using the full radial coverage of our data in § 3.1. In contrast to these results, no clear difference is found in another luminous Virgo elliptical, NGC 4374 (Gómez & Richtler 2004). This may indicate that the spatial distribution of GCs varies from galaxy to galaxy. It should be mentioned, however, that the control field used in the Gómez & Richtler (2004) study is relatively close to the host galaxy; ( 53 kpc) from NGC 4374, where a number of blue GCs may still exist. Contamination of the control fields by blue GCs would tend to steepen the radial profile of the blue GC surface densities, making it more similar to that of red GC subpopulation.
2.2.2 Local GC Specific frequency
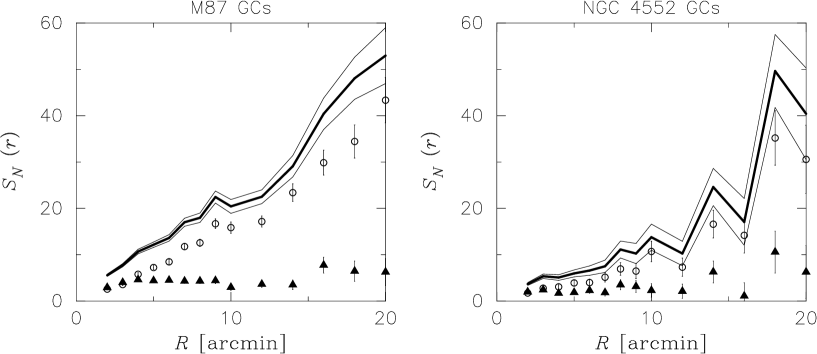
In order to convert the radial profiles of GC surface densities to those of local GC specific frequency (), the luminosity of host galaxy halo light within an annulus is calculated using a de Vaucouleurs law fitted to the -band surface brightness distribution measured using our data (Fig. 5). The results are shown in Fig. 6. The solid line indicates the measured variation with radius and the thin lines show the 1 uncertainty according to the errors in the GC surface densities. We also calculate the values for only the red GCs or blue GCs shown by filled triangles and open circles, respectively. This figure indicates that the increasing trend of local with distance from the host is primarily due to the fact that the blue GC distribution tends to be more extended than the host galaxy halo light distribution. As suggested by the similarity of the red GC distribution to the halo light distribution, there is no clear trend of with radius for the red GCs. This is the case both in M87 and NGC 4552.
3 DISCUSSION
3.1 Detailed Analysis of GC Surface Density Profiles
3.1.1 Host of the blue GCs
The extended nature of the blue GCs compared to the host galaxy halo light distribution may imply the existence of a number of GCs which are not associated with any luminous galaxies. In order to examine the validity of an idea that i-GCs exist in a galaxy cluster (e.g., White 1987; Muzzio 1987), which could apparently enhance the number of GCs in a luminous elliptical galaxy and its by superposition, West et al. (1995) predict the local number densities of i-GCs at the locations of 14 giant cluster ellipticals by assuming that i-GCs are distributed in a galaxy cluster following the mass distribution of the cluster and that a more massive galaxy cluster possesses a larger number of i-GCs (therefore the apparent enhancement of GC number due to i-GCs would depend both on the mass of the host cluster and the location of the galaxy in the cluster). They find that higher i-GC densities are predicted for those giant ellipticals with larger excess numbers of GCs compared to the predictions from a typical value for normal ellipticals and claim that this correlation is evidence for the existence of such i-GCs.
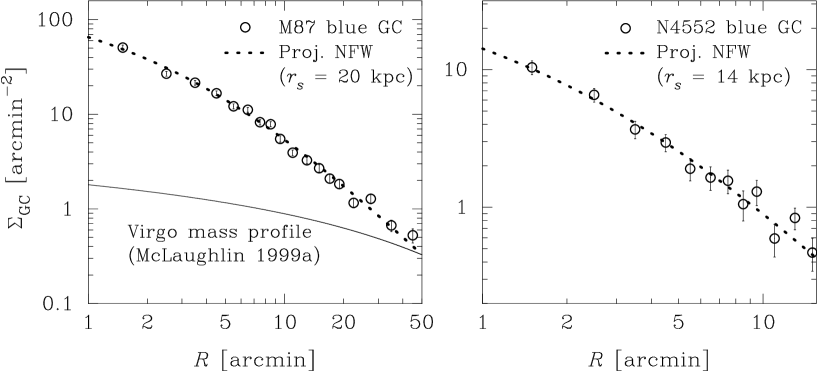
Harris et al. (1998) argue against this idea by comparing the radial surface density profile of all the M87 GCs within from the centre with that of the GCs around NGC 4472, which has a similar luminosity to M87 but is located in the outer region of the Virgo cluster and has a normal value. They demonstrate that the excess number of GCs in M87 compared to that in NGC 4472 is seen at all radii, in the sense that an additional GC population to explain the excess would need to be highly concentrated around M87, which is unlikely for an i-GC population. This argument still holds based on more recent GC data (this study for M87 GCs and Rhode & Zepf (2001) for NGC 4472 GCs). Our data also suggest that while the blue GC distribution around M87 is more extended than the halo light distribution (Fig. 5), it is significantly more concentrated toward the galaxy centre compared to the radial profile of the dark matter surface mass density in the Virgo cluster derived by McLaughlin (1999a), which is indicated in the left panel of Fig. 7. The cluster mass distribution in this case is described by an NFW profile (Navarro, Frenk & White 1997), where kpc, that is constrained over a large range of distance from the cluster centre by the stellar mass distribution of M87 (de Vaucouleurs & Nieto 1978), the surrounding X-ray hot gas distribution (Nulsen & Böringher 1995), the surface density profile of dwarf elliptical galaxies (Binggeli, Tammann & Sandage 1987), and the kinematics of Virgo early-type galaxies (Girardi et al. 1996). The solid line in the left panel of Fig. 7 shows the 2D projection of this NFW profile444In this radial range, this model exhibits a radial profile steeper than other formulae used to represent the cluster mass distribution such as a King profile fitted to the galaxy distribution (nearly constant with radius; Binggeli et al. 1987) and that determined by the GC kinematics within ( kpc) of M87 (; Cohen & Ryzhov 1997; Côté et al. 1998). The surface brightness distribution in the faint envelope of M87 () is however similar to this projected Hernquist profile (Carter & Dixon 1978; see also Harris et al. 1998). with the normalization scaled arbitrarily for comparison with the GC profile and can be seen to be significantly more extended than the blue GC distribution. It should also be pointed out that such an extended distribution of blue GCs is seen not only around M87 but also NGC 4552 (Fig. 5), NGC 4472 (Lee et al. 1998) and NGC 4649 (Forbes et al. 2004) which are located in the outer regions of the Virgo cluster. Both of these facts suggest that the contribution of i-GCs existing on the cluster scale is insignificant around M87 and most of the blue GCs as well as the red GCs must be associated with the host galaxy.
3.1.2 Blue GC distribution and host galaxy dark matter halo
The next question would then be what the blue GC distribution represents. One interesting possibility is that the blue GCs are associated with the dark matter halo of the host galaxy itself. There are at least some suggestions that dark matter halos of luminous (massive) ellipticals are more spatially extended than their stellar contents from gravitational lens analyses of early-type galaxies at intermediate redshifts (Rusin, Kochanek & Keeton 2003; Treu & Koopmans 2004; Ferreras, Saha & Williams 2005) and X-ray hot gas analyses of nearby ellipticals (Fukazawa et al. 2006). Our data suggest that the blue GC distributions around M87 and NGC 4552 can be modelled by NFW profiles. In Fig. 7, the dotted lines show projected NFW profiles with scale radii () of 20 kpc and 14 kpc fitted to the blue GC distribution of M87 and NGC 4552, respectively. The 1 fitting errors in are estimated to be 1 kpc for M87 and 3 kpc for NGC 4552 by Monte Carlo simulations.
Now we examine whether the extents of the blue GC distributions are consistent with those of the dark matter halos of M87 and NGC 4552. It is difficult to investigate the dark matter distribution of M87 itself because it is confused with the mass distribution of the Virgo cluster; the continuously rising velocity dispersion of the M87 GCs out to large radii implies that the Virgo cluster potential already dominates at 5′ 23 kpc (Romanowsky & Kochanek 2001). Meanwhile, there is no study so far of the dark matter profile of NGC 4552. Hence, we will refer to investigations of other galaxies and compare the blue GC distributions with estimates of the dark matter halos of galaxies with comparable luminosities to M87 and NGC 4552.
From weak lensing analysis of field galaxies, Hoekstra, Yee & Gladders (2004) derived an average scale radius in the NFW profile of 23 kpc for a galaxy with , which corresponds to mag. If we use the same scaling relation as adopted by Hoekstra et al. (2004), which is suggested by the observed relations among galaxy mass, luminosity and velocity dispersion, the scale radii of the dark matter halos in M87 and NGC 4552 can be calculated. Since the -band absolute magnitude of M87 (NGC 4552) is mag ( mag), respectively, the scale radii would be 56 kpc for M87 and 21 kpc for NGC 4552. The blue GC distributions may therefore be less extended than the dark matter halos of these ellipticals, although the discrepancy is much less significant for NGC 4552. Alternatively, cluster galaxies may have more compact dark matter halos than field galaxies (Natarajan et al. 1998; Limousin, Kneib & Natarajan 2006). This environmental dependence could be expected due to, e.g., earlier collapse epochs of dark matter halos in denser environments resulting in more compact mass density profiles (e.g., Diemand, Madau & Moore 2005) and/or effects of tidal interactions in clusters which can strip off the outer part of a galaxy halo (e.g., Bullock et al. 2001; Avira-Reese et al. 2005). Observational evidence for the tidal stripping scenario has been presented by Natarajan, Kneib & Smail (2002), who estimated sizes of dark matter halos of galaxies in several rich clusters at intermediate redshifts by analysing galaxy lensing signals on the HST/WFPC2 images and found that the size of a galaxy halo with a certain velocity dispersion depends on the mass density of the galaxy cluster. While both of these effects may have been at work for NGC 4552, the latter would be less likely for M87 because tidal stripping is ineffective for a massive galaxy located at the centre of a galaxy cluster. Further investigations of GC populations and mass profiles of ellipticals both in the field and clusters will be needed to see whether the blue GC distribution is as extended as the dark matter halo.
3.1.3 Is there any evidence for intergalactic GCs?
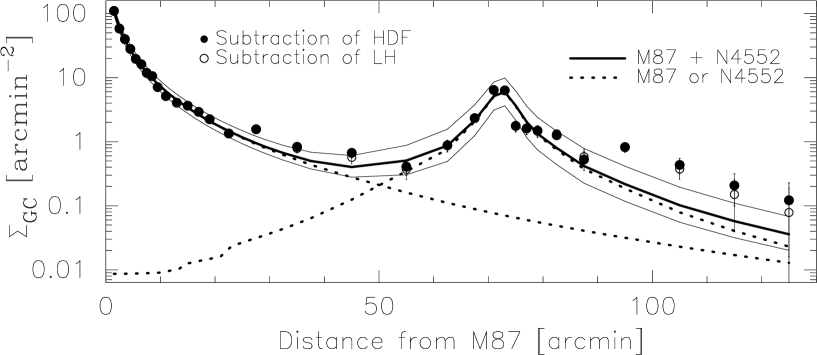
Given that the majority of the blue GCs as well as the red GCs appear to belong to the host galaxy, is there any clear evidence for an intergalactic GC (i-GC) population in the GC spatial distribution? In Fig. 8, the GC surface densities for the whole coverage of our data are plotted as a function of distance from M87. The dotted line near M87 represents the GC distribution associated with M87 obtained by fitting a de Vaucouleurs law to the radial profile of total GC surface densities within and extrapolating to larger distances. This is repeated for NGC 4552 using the GC profile within of the centre and the dotted line peaking around 75′ from M87 shows this component. The thick solid line shows the sum of these two GC distributions. The thin solid lines around this thick line show the 1 envelope due to the fitting errors of the de Vaucouleurs laws to the measured GC densities around M87 and NGC 4552. This plot indicates that the GC surface densities around from M87 most clearly exceed those expected from just the M87 GCs and NGC 4552 GCs, suggesting that an additional i-GC population may exist with a surface density of 0.2 arcmin-2. Our data do not exclude the possibility that i-GCs exist not only around from M87 but at all radii, provided the surface density is less than arcmin-2.
The estimated i-GC surface density depends sensitively on the assumed radial distributions of GCs associated with M87 and NGC 4552. For example, the GC distributions may not follow the de Vaucouleurs laws and any deviations from this assumption would be a source of uncertainty in the existence and amount of possible i-GCs. Even if the de Vaucouleurs laws are good approximations of the galactic GC distributions, we need to consider the fitting errors. When we adopt the upper end of the envelope (i.e. ) as the galactic GC distribution, the excess GC number density would be reduced down to 0.1 arcmin-2. On the contrary, the galactic GCs may not be distributed out to such large radii and their distribution may be truncated at a certain distance from the host galaxy. If this is the case, all the GCs found at distances larger than from M87 could be i-GCs and the number density would be increased up to arcmin-2. While these systematic effects dominate the uncertainty of the i-GC surface number density, the effect of foreground and background subtraction error is another concern. The 1 Poisson error calculated from the numbers of GC candidates and contaminating objects is 0.1 arcmin-2. In addition, there is a difference of 0.05 arcmin-2 in the surface density of contaminating objects between HDF-N and LH, which is presumed to be due to cosmic variance of the two control fields and/or difference of data quality. Therefore the GC surface density of 0.2 arcmin-2 estimated at a distance of from M87 is a detection at a level of significance, although this significance level depends on the adopted model for the galactic GC distributions.
In the following discussions, we will adopt 0.2 arcmin-2 as the best estimate of the i-GC number density from our survey with the lower (upper) limit of 0.1 (0.5) arcmin-2, respectively. These numbers are tentative and need to be confirmed with future observations. Spectroscopy would be a promising way to identify true i-GCs in the candidates and their line-of-sight velocity distribution would be evidence that they are not associated with any luminous galaxies. Since the i-GCs are expected to be associated with the Virgo cluster potential, their velocity distribution should be similar to the dynamics of the Virgo member galaxies which have a dispersion km s-1 at 110′ from M87, depending on the morphological types of the galaxies used in the calculation (Binggeli, Sandage & Tammann 1985). In fact, Arnaboldi et al. (2004) measured radial velocities for a dozen Virgo intracluster PNe (i-PNe) and found km s-1. More accurate determinations of i-GC surface densities would allow one to address whether the distribution of the i-GC population in the Virgo cluster is just a function of distance from M87, or is inhomogeneous. This could be compared with the recent study of the i-PNe population in the Virgo cluster, which shows a significant field-to-field variation and no clear radial trend in the surface number density (Feldmeier et al. 2004a).
3.2 Comparison with Studies of Intergalactic PNe: Constraints on for Intergalactic GC populations
Although the i-GC surface number density estimated in the previous section is preliminary, it provides a useful upper limit. The surface number density of i-PNe has recently been estimated in several fields of the Virgo cluster (Feldmeier et al. 2004b; Aguerri et al. 2005) and the associated amount of intracluster stellar population in the Virgo cluster has been inferred by means of stellar evolution theory. This enables one to calculate an expected surface number density of i-GCs using as a free parameter, provided that i-GCs and i-PNe follow a similar spatial distribution (this needs to be confirmed in future surveys of both i-GCs and i-PNe in the same area of sky). In the following, we derive an for the i-GC population by comparing the observed and predicted i-GC number densities. While several sources of large uncertainty are expected to exist in this calculation, it gives a useful insight into which galaxy populations furnish intracluster stars and GCs, because is believed to be correlated with galaxy type (e.g., Harris 1991).
In order to infer an i-GC surface number density from the distribution of i-PNe, we start from the bolometric surface luminosity density of intracluster stellar light which is estimated using the luminosity function of PNe to be kpc-2 where detected (Feldmeier et al. 2004b). The lower bound value corresponds to arcmin-2. Assuming a bolometric correction for intracluster stars of (Jacoby, Ciardullo & Ford 1990; Feldmeier et al. 2004b), this can further be transformed to a surface density of -band luminosity of mag arcmin-2. The predicted i-GC surface number density is therefore arcmin-2. According to our analyses of the GC surface number density profiles, the i-GC surface number density is 0.2 arcmin-2 where they are likely to exist. Therefore, the results from i-GCs and i-PNe would be mutually consistent if for the i-GC population. Considering that GCs tend to be more extended than halo stars and may be more easily tidally stripped than stars, the value of 2.9 seem to be unexpectedly low. However, our understanding of such extended GC distributions comes mainly from observations of luminous galaxies and GC distributions in less luminous early-type galaxies and spiral galaxies, which are the more common galaxy populations in clusters, are much less well studied. The for i-GCs could also depend on the type of galaxy cluster; since the Virgo cluster is a spiral-rich cluster, a significant amount of stars and GCs may have been provided by spiral galaxies whose is low () resulting in a modest average for i-GCs.
There are a number of sources of uncertainty in for i-GC populations included in the above derivation. One is obviously the i-GC surface density. If we adopt 0.1 (0.5) arcmin-2 as the i-GC surface density (see the last section), the would be 1.4 (7.1), respectively. In addition, the luminosity function of i-PNe and the bolometric corrections for intracluster stellar populations are not very well constrained and their uncertainties are expected to be added to those already accounted for. The of i-GC populations will therefore need to be updated by forthcoming GC and PNe surveys.
3.3 Implications for the Origin of GC Populations
In § 3.1, we suggest that most of the blue GCs around M87 are associated not with the Virgo cluster but with the host galaxy, based on the fact that the spatial distribution of blue GCs around M87 is not as extended as the Virgo cluster mass distribution, and that such an extended distribution of blue GCs is not a special characteristic of M87. The extended distribution of blue GCs could therefore be an intrinsic property of the host galaxy and this dependence of spatial distribution on GC colour (metallicity) should therefore be explained by models of GC and elliptical galaxy formation. In addition, recent observations suggest that the spectroscopic ages of both metal-rich and metal-poor GCs in ellipticals are as old as those of Milky Way GCs (Strader et al. 2005a) and that the mean colours of the red GCs and the blue GCs are both correlated with host galaxy properties (Larsen et al. 2001; Strader, Brodie & Forbes 2004; Strader et al. 2005b; Peng et al. 2006). We now examine the existing scenarios of GC and elliptical galaxy and try to constrain the physical processes involved with all of these recent observatios considered.
In the multiphase collapse scenario, the blue GC subpopulation is considered to have formed in situ during a dissipative collapse of the protogalactic cloud at high redshift but this occurred before the bulk of the halo stars and red GCs formed (Forbes et al. 1997). All GCs and their host elliptical galaxy would form within a short time scale and GCs would therefore be uniformly old. Since GC formation is presumed to be affected by the depth of the potential well of the host galaxy, the average metallicities of metal-rich and metal-poor GCs should correlate with the host galaxy properties. This scenario also appears to be supported by the possible evidence for a metallicity gradient in the blue GCs (§ 2.1), suggesting that the GC formation was accompanied by a dissipative collapse of the protogalactic gas cloud. The absence of a metallicity gradient at the large distances from the host galaxy centre does not necessarily contradict such a dissipative process; it may be due to the presence of lower limit in GC metallicity at (Cayrel 1986; Burgarella, Kissler-Patig & Buat 2001; Woodley, Harris & Harris 2005; Harris et al. 2006). However, the physical mechanism for this in situ formation to produce metal-poor and metal-rich GCs remains unclear. Numerical simulations seem to indicate that when a massive elliptical galaxy forms at high redshift following the dissipative collapse of a protogalactic gas cloud, most of the stars (and probably GCs as well) formed in a single episode of intense star formation (e.g., Chiosi & Carraro 2002), which is unlikely to create separate metal-rich and metal-poor GC subpopulations. Even if the starburst could be split into two phases, still missing would be clues to explain why GCs rather than halo stars are formed predominantly in the early phase of star formation and why the distribution of these metal-poor GCs is more extended than that of the metal-rich GCs.
In fact, these problems could be resolved at least to some extent by incorporating some effects of galaxy mergers. Instead of mergers of mature spirals as originally proposed by Ashman & Zepf (1992), here we consider galaxy mergers accompanied by starbursts and red GC formation to be complete at high redshift, since no clear evidence for red GCs to be significantly younger than blue GCs has so far been found from observations (Cohen, Blakeslee & Ryzhov 1998; Strader et al. 2005a). These high redshift mergers could play a key role in the formation of a massive elliptical galaxy and its metal-poor GC subpopulation as follows: (1) Around the peak of the primordial density fluctuations where a massive elliptical galaxy will subsequently form, sub-galactic clumps collapse first; (2) these sub-galactic clumps are presumably gas-rich and stars and GCs form therein, both of which are expected to be metal-poor; (3) when these sub-galactic clumps merge into a massive elliptical galaxy, the metal-poor GCs also assemble and result in a substantial fraction of the blue GC subpopulation of the host galaxy (see also discussions by Harris et al. 2006). The metal-poor GCs are expected to behave as collisionless particles in this assembly and their spatial distribution when assembled could therefore follow a mass distribution of the host galaxy at this time. Since this assembly is expected to take place in the dark matter potential of a massive elliptical galaxy, the distribution of metal-poor GCs should be similar to a dark matter distribution of the host galaxy and explain why an NFW profile can give a good fit to the blue GC subpopulation. Note that the presence of a metallicity gradient in the blue GCs might constrain such a dissipationless assembly of the metal-poor GCs. The average metallicity of the blue GCs should correlate with the host galaxy mass if a more massive elliptical galaxy forms through an assembly of more massive building blocks, which are expected to possess more metal-rich GCs as suggested for nearby dwarf ellipticals (Lotz, Miller & Ferguson 2004). Meanwhile, the bulk of field stars and red GCs are presumed to have formed in the starbursts following dissipative mergers of these gas-rich sub-galactic clumps. Their spatial distributions could therefore be similar to each other and more compact than that of the blue GCs due to the effect of dissipation.
On the other hand, the high values observed in giant ellipticals located at the cluster centres would need to be explained by biased GC formation in denser (presumably more gas-rich) environments (West 1993; Blakeslee 1999; McLaughlin 1999b). Rhode, Zepf & Santos (2005) investigate GC populations in several ellipticals and spirals and find that the number of blue (metal-poor) GCs normalized by the stellar mass of the host galaxy tends to increase with the host galaxy stellar mass, which may also be evidence that formation of metal-poor GCs was more biased around more massive galaxies. In the high redshift merger scenario proposed above, this correlation could be explained if a more massive elliptical formed from sub-galactic clumps with a higher GC formation efficiency. In this regard, however, mergers of more massive sub-clumps to form a more massive elliptical appear to be implausible because less luminous local dwarf ellipticals tend to have higher (Durrell et al. 1996; Miller et al. 1998). Also, it is unclear if the dominant metal-poor GCs assembled in this way would be found in spiral galaxies. Another process to form metal-poor GCs surrounding more massive galaxies independent of galaxy morphology therefore seems necessary. One candidate may be additional GC formation triggered by the cosmological reionization (Cen 2001; see also discussions by Rhode et al. (2005) and references therein). More theoretical work and numerical experiments will be needed to predict the GC properties and their evolution within a framework of structure and galaxy formation for these proposed mechanisms of GC formation to be compared with the observations quantitatively.
Finally, we comment on the presence of tidally stripped (blue) GCs from other (less luminous) galaxies found preferentially in the outer regions of luminous ellipticals. In galaxy clusters, the tidal force from the cluster potential is expected to act on galaxies to remove halo stars and GCs most efficiently around the core radius of a galaxy cluster (e.g., Merritt 1984), which is 45 kpc () for the Virgo cluster (Nulsen & Böhringer 1995). The GC surface density around a central cluster galaxy like M87 may therefore be enhanced around this radius by tidal capture. For luminous ellipticals located in the outer region of a galaxy cluster or in even less dense environments, only galaxy-galaxy interactions could perhaps be at work. Detailed predictions of the spatial distribution of GCs expected from tidal interactions would be useful to place constraints on the accretion scenario. Our estimate of for i-GCs is another observational constraint on the validity of this tidal capture model around M87 and other giant ellipticals with high values. If the estimated for the i-GC population represents the true ratio of GCs to tidally stripped stars, the of a central galaxy would be expected to decrease as the number of interactions increases, which is perhaps hard to be reconciled with the observed high for the M87 GCs.
4 SUMMARY AND CONCLUSION
We have performed a wide-field imaging survey of the globular cluster (GC) populations around M87 with Suprime-Cam on the 8.2m Subaru Telescope. A (560 kpc 140 kpc) field extending from M87 to the east was observed through the filters. GC candidates are selected not only with an extended source cut but also with a colour selection which includes almost all the Galactic GCs but minimizes the contamination of foreground stars and background galaxies. We also analyze archival imaging data of the control fields (HDF-N and Lockman hole) to assess foreground and background contamination in the GC candidates which needs to be statistically subtracted from the GC candidates.
In this paper, we investigate the colour distribution, surface number density, and local specific frequency () of GC candidates as a function of distance from two luminous elliptical galaxies M87 and NGC 4552. In investigating these statistical properties, we subtract foreground and background contamination using both the HDF-N data and the Lockman Hole data but we find that the results do not depend significantly on choice of the control fields. The main results are summarized as follows:
-
•
The colour distributions of GCs in the innermost region (within or kpc from the galaxy centre) shows bimodality both in M87 and NGC 4552. This bimodality becomes less clear in the outer regions due to a decreasing contribution of the red GC subpopulation. The colour of the host galaxy halo light is slightly redder ( mag) than that of the red GC subpopulation.
-
•
The average colour of GCs becomes bluer with increasing distance from the host galaxy. The colour gradient within 15′ from the host galaxy is estimated to be for the M87 GC population and for the NGC 4552 GC population. The GC colour gradient may be due to a combination of the decreasing contribution of red GCs and a colour gradient in each GC subpopulation. At radii larger than , however, the radial gradient of GC colour seems much less significant in both of M87 and NGC 4552. The colour gradient of the host galaxy halo light is found to be steeper than the GC colour gradient in M87, while both are consistent with each other in NGC 4552.
-
•
The spatial distribution of the GC population as a whole is more extended than the host galaxy halo light both in M87 and NGC 4552. This is primarily due to the extended distribution of the blue GCs, while the distribution of the red GC subpopulation is as centrally concentrated as that of the halo light. Accordingly, the local for the blue GCs increases with radius, whereas that for the red GCs is nearly constant.
-
•
Although the spatial distribution of blue GCs around M87 is more extended than that of the host galaxy halo light and the red GCs, it appears to be less extended than the mass distribution of dark matter in the Virgo cluster. Furthermore, the extended distribution of blue GCs does not seem to be a special characteristic of giant ellipticals at the cluster centres like M87. Both of these facts do not support the idea that the high value of M87 is due to the superposition of intergalactic GCs (i-GCs). Instead, we suggest that most of the blue GCs as well as the red GCs are associated with the host galaxy.
-
•
We find marginal evidence for the existence of intracluster GCs (i-GCs) with a surface density of arcmin-2. Comparison with the predicted surface luminosity density of intracluster stars gives a crude estimate of for this i-GC population . If this represents the true ratio of GCs to tidally stripped stars, the fraction of GCs captured by this process would be low in the GC population of M87.
ACKNOWLEDGEMENTS
We are grateful to the referee, Dr. Terry Bridges, for careful reading of our manuscript and for insightful comments which significantly improved this paper. This work was based on data collected at Subaru Telescope operated by National Astronomical Observatory of Japan and those obtained from the SMOKA system operated by the Astronomical Data Center, National Astronomical Observatory of Japan . We appreciate the members of the Subaru Telescope operation team, especially Dr. Hisanori Furusawa for supports during the observation. This work was partly supported by Grants-in-Aid for Scientific Research (Nos. 16540223 and 17540216) by the Japanese Ministry of Education, Culture, Sports, Science and Technology.
References
- (1) Aguerri, J. A. L., Gerhard, O. E., Arnaboldi, M., Napolitano, N. R., Castro-Rodriguez, N., Freeman, K. C. 2005, AJ, 129, 2585
- (2) Arnaboldi, M., Gerhard, O., Aguerri, J. A. L., Freeman, K. C., Napolitano, N. R., Okamura, S., Yasuda, N. 2004, ApJ, 614, L33
- (3) Ashman, K. M., Bird, C. M., Zepf, S. E. 1994, AJ, 108, 2348
- (4) Ashman, K. M., Zepf, S. E. 1992, ApJ, 384, 50
- (5) Avila-Reese, V., Colín, P., Gottlöber, S., Firmani, C., Maulbetsch, C. 2005, ApJ, 634, 51
- (6) Bassino, L. P., Cellone, S. A., Forte, J. C., Dirsch, B. 2003, A&A, 399, 489
- (7) Bassino, L. P., Faifer, F. R., Forte, J. C., Dirsch, B., Richtler, T., Geisler, D., Schuberth, Y. 2006, A&A, 451, 789
- (8) Beasley, M., Baugh, C. M., Forbes, D. A., Sharples, R. M., Frenk, C. S. 2002, MNRAS, 333, 383
- (9) Binggeli, B., Sandage, A., Tammann, G. A. 1985, AJ, 90, 1681
- (10) Binggeli, B., Tammann, G. A., Sandage, A. 1987, AJ, 94, 251
- (11) Blakeslee, J. P. 1999, AJ, 118, 1506
- (12) Brodie, J. P., Strader, J., Denicoló, G., Beasley, M. A., Cenarro, A. J., Larsen, S. S., Kuntschner, H., Forbes, D. A. 2005, AJ, 129, 2643
- (13) Bullock, J. S., Kolatt, T. S., Sigad, Y., Somerville, R. S., Kravtsov, A. V., Klypin, A. A., Primack, J. R., Dekel, A. 2001, MNRAS, 321, 559
- (14) Burgarella, D., Kissler-Patig, M., Buat, V. 2001, AJ, 121, 2647
- (15) Carter, D., Dixon, K. L. 1978, AJ, 83, 574
- (16) Cayrel, R. 1986, A&A, 168, 81
- (17) Cen, R. 2001, ApJ, 561, 592
- (18) Chiosi, C., Carraro, G. 2002, MNRAS, 335, 335
- (19) Cohen, J. G., Ryzhov, A. 1997, ApJ, 486, 230
- (20) Cohen, J. G., Blakeslee, J. P., Ryzhov, A. 1998, ApJ, 496, 808
- (21) Côté, P., Marzke, R. O., West, M. J. 1998, ApJ, 501, 554
- (22) Côté, P., et al. 2001, ApJ, 559, 828
- (23) de Vaucouleurs, G., Nieto, J. -L. 1978, ApJ, 220, 449
- (24) Diemand, J., Madau, P., Moore, B. 2005, MNRAS, 364, 367
- (25) Dirsch, B., Richtler, T., Geisler, D., Forte, J. C., Bassino, L. P., Gieren, W. P. 2003, AJ, 125, 1908
- (26) Dirsch, B., Schuberth, Y., Richtler, T. 2005, A&A, 433, 43
- (27) Durrell, P. R., Ciardullo, R., Feldmeier, J. J., Jacoby, G. H., Sigurdsson, S. 2002, ApJ, 570, 119
- (28) Durrell, P. R., Harris, W. E., Geisler, D., Pudritz, R. E. 1996, AJ, 112, 972
- (29) Elson, R. A. W., Santiago, B. X. 1996a, MNRAS, 278, 617
- (30) Elson, R. A. W., Santiago, B. X. 1996b, MNRAS, 280, 971
- (31) Feldmeier, J. J., Mihos, J. C., Morrison, H. L., Rodney, S. A., Harding, P. 2002, ApJ, 575, 779
- (32) Feldmeier, J. J., Ciardullo, R., Jacoby, G. H., Durrell, P. R. 2004a, ApJ, 615, 196
- (33) Feldmeier, J. J., Mihos, J. C., Morrison, H. L., Harding, P., Kaib, N., Dubinski, J. 2004b, ApJ, 609, 617
- (34) Ferreras, I., Saha, P., Williams, L. L. R. 2005, ApJ, 623, L5
- (35) Forbes, D. A., Brodie, J. P., Grillmair, C. J. 1997, AJ, 113, 1652
- (36) Forbes, D. A., et al. 2004, MNRAS, 355, 608
- (37) Fukazawa, Y., Betoya-Nonesa, J. G., Pu, J., Ohto, A., Kawano, N. 2006, ApJ, 636, 698
- (38) Gebhardt, K., Kissler-Patig, M. 1999, AJ, 118, 1526
- (39) Girardi, M., Fadda, D., Giuricin, G., Mardirossian, M., Mezzetti, M., Biviano, A. 1996, ApJ, 457, 61
- (40) Gómez, M., Richtler, T. 2004, A&A, 415, 499
- (41) Goudfrooij, P., Hansen, L., Jørgensen, H. E., Nørgaard-Nielsen, H. U., de Jong, T., van den Hoek, L. B. 1994, A&AS, 104, 179
- (42) Harris, W. E. 1986, AJ, 91, 822
- (43) Harris, W. E. 1991, ARA&A, 29, 543
- (44) Harris, W. E., Harris, G. L. H., McLaughlin, D. E. 1998, AJ, 115, 1801
- (45) Harris, W. E., Whitmore, B. C., Karakla, D., Okoń, W., Baum, W. A., Hanes, D. A., Kavelaars, J. J. 2006, ApJ, 636, 90
- (46) Hoekstra, H., Yee, H. K. C., Gladders, M. D. 2004, ApJ, 606, 67
- (47) Jacoby, G. H., Ciardullo, R., Ford, H. C. 1990, ApJ, 356, 322
- (48) Jordán, A., Côté, P., West, M. J., Marzke, R. O. 2002, ApJ, 576, L113
- (49) Jordán, A., West, M. J., Côté, P., Marzke, R. O. 2003, AJ, 125, 1642
- (50) Kundu, A., Whitmore, B. C. 2001, AJ, 121, 2950
- (51) Kundu, A., Whitmore, B. C., Sparks, W. B., Macchetto, F. D., Zepf, S. E., Ashman, K. M. 1999, ApJ, 513, 733
- (52) Larsen, S. S., Brodie, J. P., Huchra, J. P., Forbes, D. A., Grillmair, C. J. 2001, AJ, 121, 2974
- (53) Lee, M. G., Kim, E., Geisler, D. 1998, AJ, 115, 947
- (54) Limousin, M., Kneib, J. -P., Natarajan, P. 2006, to appear in Proceedings of the XLIst Rencontres de Moriond “From Dark Halos to Light”, eds. L. Tresse, S. Maurogordato and J. Tran Thanh van (astro-ph/0606447)
- (55) Lotz, J. M., Miller, B. W., Ferguson, H. C. 2004, ApJ, 613, 262
- (56) Marín-Franch, A., Aparicio, A. 2003, ApJ, 585, 714
- (57) McLaughlin, D. E. 1999a, ApJ, 512, L9
- (58) McLaughlin, D. E. 1999b, AJ, 117, 2398
- (59) Merritt, D. 1984, ApJ, 276, 26
- (60) Miller, B. W., Lotz, J. M., Ferguson, H. C., Stiavelli, M., Whitmore, B. C. 1998, ApJ, 508, L133
- (61) Muzzio, J. C. 1987, PASP, 99, 245
- (62) Natarajan, P., Kneib, J. -P., Smail, I., Ellis, R. S. 1998, ApJ, 499, 600
- (63) Natarajan, P., Kneib, J. -P., Smail, I. 2002, ApJ, 580, L11
- (64) Navarro, J. F., Frenk, C. S., While, S. D. M. 1997, ApJ, 490, 493
- (65) Neilsen, E. H., Tsvetanov, Z. I. 1999, ApJ, 515, L13
- (66) Nulsen, P. E. J., Böhringer, H. 1995, MNRAS, 274, 1093
- (67) Peletier, R. F., Davies, R. L., Illingworth, G. D., Davis, L. E., Cawson ,M. 1990, AJ, 100, 1091
- (68) Peng, E. W., et al. 2006, ApJ, 639, 95
- (69) Rhode, K. L., Zepf, S. E. 2001, AJ, 121, 210
- (70) Rhode, K. L., Zepf, S. E. 2004, AJ, 127, 302
- (71) Rhode, K. L., Zepf, S. E., Santos, M. R. 2005, ApJ, 630, L21
- (72) Romanowsky, A. J., Kochanek, C. S. 2001, ApJ, 553, 722
- (73) Rusin, D., Kochanek, C. S., Keeton, C. R. 2003, ApJ, 595, 29
- (74) Strader, J., Brodie, J. P., Forbes, D. A. 2004, AJ, 127, 3431
- (75) Strader, J., Brodie, J. P., Cenarro, A. J., Beasley, M. A., Forbes, D. A. 2005a, AJ, 130, 1315
- (76) Strader, J., Brodie, J. P., Spitler, L., Beasley, M. A. 2005b, AJ, submitted (astro-ph/0508001)
- (77) Tamura, N., Kobayashi, C., Arimoto, N., Kodama, T., Ohta, K. 2000, AJ, 119, 2134
- (78) Tamura, N., Sharples, R. M., Arimoto, N., Onodera, M., Ohta, K., Yamada, Y. 2006, MNRAS, submitted (Paper I)
- (79) Theuns, T., Warren, S. J. 1997, MNRAS, 284, L11
- (80) Tonry, J. L., Dressler, A., Blakeslee, J. P., Ajhar, E. A., Fletcher, A. B., Luppino, G. A., Metzger, M. R., Moore, C. B. 2001, ApJ, 546, 681
- (81) Treu, T., Koopmans, L. V. E. 2004, ApJ, 611, 739
- (82) Vazdekis, A., Casuso, E., Peletier, R. F., Beckman, J. E. 1996, ApJS, 106, 307
- (83) West, M. J. 1993, MNRAS, 265, 755
- (84) West, M. J., Côté, P., Jones, C., Forman, W., Marzke, R. O. 1995, ApJ, 453, L77
- (85) White, R. E. 1987, MNRAS, 227, 185
- (86) Whitmore, B. C., Sparks, W. B., Lucas, R. A., Macchetto, F. D., Biretta, J. A. 1995, ApJ, 454, L73
- (87) Woodley, K. A., Harris, W. E., Harris, G. L. H. 2005, AJ, 129, 2654
- (88) Yoon, S. -J., Yi, S. K., Lee, Y. -W. 2006, Science, 311, 1129