Cryogenic tests of volume-phase holographic gratings: results at 100
Abstract
We present results from cryogenic tests of Volume-Phase Holographic (VPH) gratings at 100 . The aims of these tests are to see whether the diffraction efficiency as a function of wavelength is significantly different at a low temperature from that at room temperature and to see how the performance of a VPH grating is affected by a number of thermal cycles. We have completed 10 cycles between room temperature and 100 , and find no clear evidence that the diffraction efficiency changes with temperature or with successive thermal cycle.
1 Introduction
Volume-Phase Holographic (VPH) gratings potentially have many advantages over classical surface-relief gratings (Barden, Arns & Colburn 1998; Barden et al. 2000). They are already in operation in some existing astronomical spectrographs (Kashiwagi et al. 2004) and their use is also planned for a number of forthcoming instruments (Smith et al. 2004). While the main applications of VPH gratings are currently for optical spectrographs, they will also be useful for near-infrared (NIR) spectrographs if the performance at low temperatures is satisfactory. In particular, diffraction efficiency and its dependency on wavelength should be confirmed. Contraction of dichromated gelatin with decreasing temperature could cause variations in line density and the diffraction efficiency profile (the thickness of the gelatin layer is one of the parameters that define diffraction efficiency). Since thermal cycling may cause some deterioration of a VPH grating and reduce its operational life time, we also need to investigate whether the characteristics vary with successive thermal cycles. Previously, we tested a VPH grating at 200 and confirmed that the performance is nearly independent of temperature during 5 thermal cycles (Tamura et al. 2003, 2004). While cooling to 200 can be sufficient for a spectrograph operating at wavelengths out to 1.8 m ( band) such as Fiber Multi Object Spectrograph (FMOS; e.g. Kimura et al. 2003), a much lower temperature (e.g., 100 ) is required to extend the spectral coverage of a spectrograph out to 2.4 m ( band).
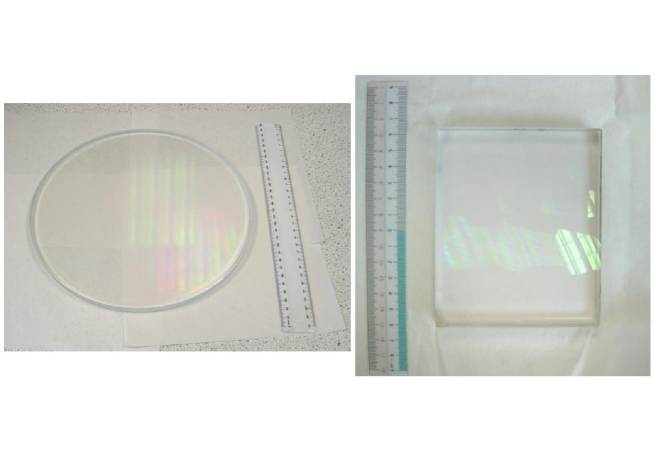
In this paper, measurements of diffraction efficiency of VPH gratings at 100 and at room temperature are reported. Pictures of the gratings investigated are shown in Fig. 1, both of which were manufactured by Ralcon Development Lab. The one in the left panel of Fig. 1 has a line density of 385 lines/mm and the peak of diffraction efficiency exists around 1.3 m at the Bragg condition when the incident angle of an input beam to the normal of the grating surface is 15∘. The measurements of this grating are performed at wavelengths from 0.9 m to 1.6 m. Since it is important to see whether the performance at low temperatures is different from grating to grating (Bianco et al. 2003; Blais-Ouellette et al. 2004; Branche et al. 2004) we also investigate a different VPH grating, which is shown in the right panel of Fig. 1. (This grating was provided as a free sample for demonstration purposes only.) The line density is 300 lines/mm and the peak efficiency is obtained around 0.7 m for an incident angle of 6∘. The measurements of this grating are performed at wavelengths from 0.5 m to 0.9 m.
2 The test facility and measurements
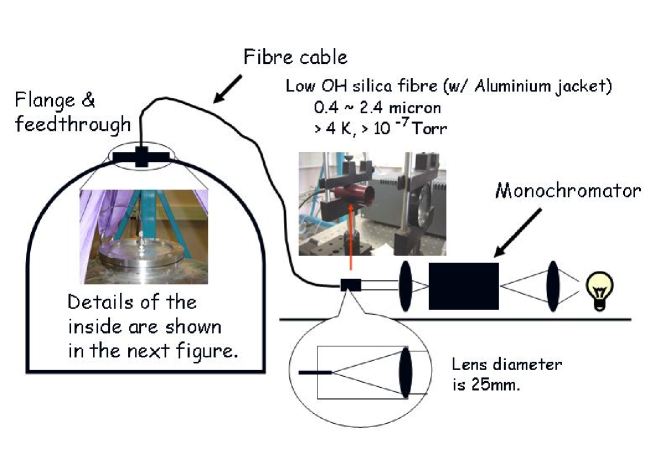
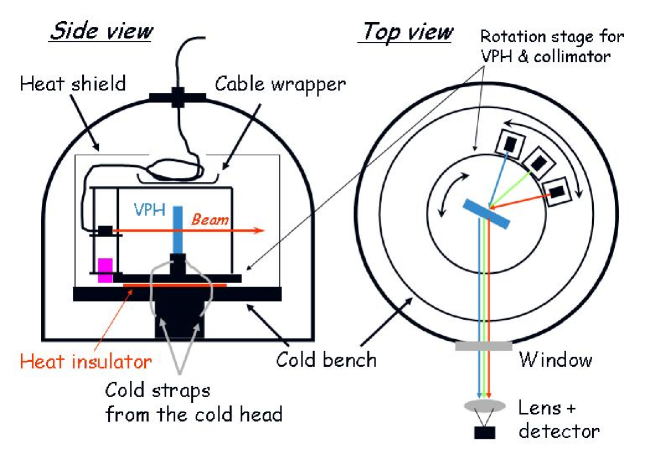
In Fig. 2 and 3, the overall configuration of the optical components used for the measurements is indicated (detailed information for the main components is given in Table Cryogenic tests of volume-phase holographic gratings: results at 100 ). Light exiting from the monochromator is fed into the cryogenic chamber through the fiber cable (Fig. 2). Lenses with the same specifications are attached to both ends of this fiber cable so that a collimated beam received at one end exits from the other end in the cryogenic chamber. This beam is directed towards the central axis of the cold bench with parallel to the bench and illuminates the central part of the VPH grating at a controlled incident angle. The spectral band-width of this input beam is set by the slit width at the exit of the monochromator. The slit width and the corresponding spectral band-width are set to 0.5 mm and 0.01 m, respectively, throughout the measurements. The input beam diameter is mm which is defined by the lens diameter of the fiber cable assembly. The incident beam is then diffracted by the grating. The position of the output collimator lens and the VPH grating are rotated independently around the central axis of the cold bench so that the diffracted beam for a certain combination of incident angle and wavelength goes through the window towards the camera section consisting of lenses and a detector (Fig. 3). The output fiber core is thus re-imaged on the detector.
The basic measurement procedures are as follows: First, the brightness of the lamp and the wavelength of light exiting from the monochromator are fixed (the brightness of the lamp is kept constant by a stabilized power supply), and the total intensity included in the image of the fiber core is measured without a VPH grating. This measurement is performed at all the sampling wavelengths and is also carried out both at room temperature and cold temperature. The brightness of the lamp can be changed when moving from one wavelength to another; a higher brightness is used at the shortest and longest wavelengths because the system throughput is lower. These data are used to normalize the intensities measured when a VPH grating is inserted into the test set-up and to calculate the diffraction efficiency. Since marginal differences (%) were found in the intensities measured without a VPH grating between room temperature and cold temperature, we use the intensities taken at room (cold) temperature to normalize those measured with a VPH grating at room (cold) temperature, respectively.
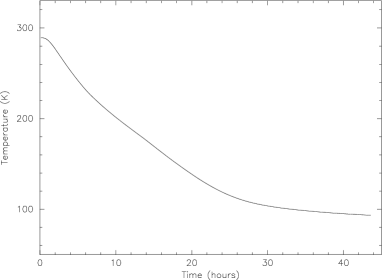
Next, a VPH grating is inserted and the intensity of the first order () diffracted light is measured for an incident angle of 10∘, 15∘, and 20∘ at all the sampling wavelengths. Once all these measurements are performed, a cooling cycle of the VPH grating is started. The temperature of the grating is monitored with a calibrated silicon diode sensor on the grating surface, close to the edge of the grating but unilluminated by the input beam. For a good thermal contact between the grating and the sensor and accurate measurements of the grating temperature, we put a thin layer of grease to increase the contact area between the two surfaces. We also use a device to keep pushing the sensor against the grating lightly during a thermal cycle, which is thermally insulated from the metal components of the test facility. An example of the temperature variation is shown in Fig. 4. When the temperature of the grating becomes lower than 100 , we start the same sequence of measurements as above with running the compressor and cold heads. There is no closed loop control of the grating temperature as the rate of temperature variation is very low at 100 . The temperature of the grating therefore stays approximately at 90 100 for the duration of the measurements. After the measurements at 100 , the compressor and cold heads are switched off and the VPH grating is allowed to warm up passively. The measurements are repeated when the temperature is back to the ambient temperature. During these thermal cycles, the cryogenic chamber is kept evacuated to 10-7 Torr.
3 Results and discussions
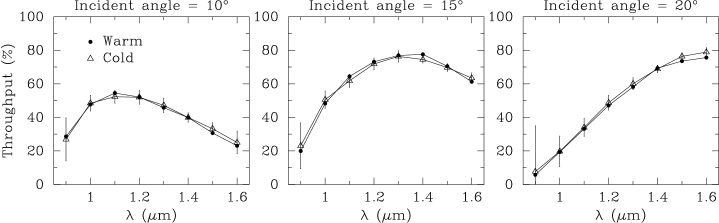
First, we show results from the VPH grating for NIR wavelengths. In Fig. 5, measured efficiency of the first order () diffraction is plotted against wavelength for an incident angle of 10∘, 15∘, and 20∘ in the left, middle, and right panel, respectively. The circles indicate the data points at room temperature, and the triangles are those at 100 . The error bars indicate estimated random errors in the measurements expected due to pixel-to-pixel variation of background intensities in the images of the fiber core and subsequent uncertainty of background subtraction. Note that the large error at m is due to the lower sensitivity of the detector at the edge of the spectral coverage. For clearer presentation, these error bars are attached only to the data points for a cold test, but those for a warm test are similar. These results suggest that a VPH grating can withstand cryogenic temperatures in vacuum and that its performance at 100 is similar to that at room temperature.
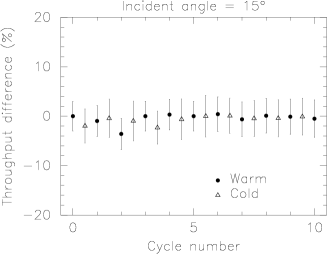
In order to see whether the performance of this VPH grating deteriorated with successive thermal cycling, the differences in diffraction efficiency for an incident angle of 15∘ between the first warm test and subsequent tests are averaged over the wavelength range investigated and plotted against cycle number in Fig. 6. Circles and triangles indicate the measurements at room temperature and those at 100 , respectively. The error bar represents a combination of the standard deviation of the differences around the average value and the typical uncertainty ( 3 %) in the measurement of diffraction efficiency. Similar results are obtained from the data for the other incident angles (10∘ and 20∘). This result suggests that no significant deterioration of a VPH grating is caused by thermal cycling.
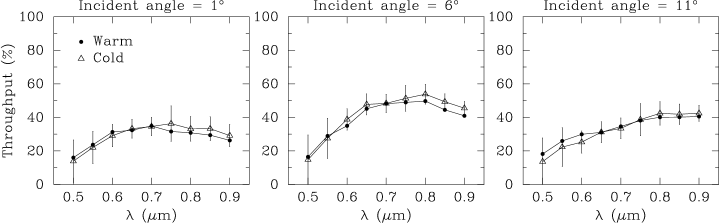
Next, we present results from the VPH grating for visible wavelengths. The measurement procedure is the same as that in the NIR except that a CCD camera is used and the grating is accommodated with a different mount on the cold bench. In Fig. 7, the measurements of diffraction efficiency at 100 are compared with those at room temperature for an incident angle of 1∘, 6∘, and 11∘ in the left, middle, and right panel, respectively. In Fig. 8, the average difference from the first warm test is plotted against cycle number for an incident angle of 6∘. These results again suggest that the performance does not largely depend on temperature or the number of thermal cycles. We note that the throughput is significantly lower than the NIR grating. The reason for this is unknown, but this grating was for demonstration purposes only and hence the low throughput may be due to, e.g., severe internal absorption and/or imperfect fringes.
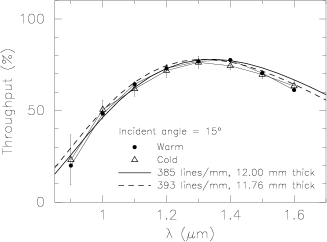
This robustness of diffraction efficiency to temperature variation is expected for these VPH gratings in theory, provided that the linear thermal expansion coefficient of gelatin at 100 200 is similar to that at 200 300 , i.e., in the range of . Given a linear thermal expansion coefficient of 10-4 , a gelatin thickness would be 2 % smaller at 100 compared to that at 300 . Considering the VPH grating for NIR wavelengths and assuming a 12 m thickness at room temperature, which gives a good fit of the predicted throughput curve to the measurements for this NIR VPH grating (Tamura et al. 2003), the thickness at 100 would be 11.76 m. Also, the line density would be increased by the same fraction. Since the line density of this grating is 385 lines/mm in the specification, it would be 393 lines/mm at 100 . In Fig. 9, the diffraction efficiency predicted with coupled wave analysis (Kogelnik 1969) is plotted against wavelength for the two sets of line density and gelatin thickness; one is 385 lines/mm and 12 m, and the other is 393 lines/mm and 11.76 m. The fringe amplitude in refractive index is assumed to be 0.055 in both calculations. An incident angle of 15∘ is also assumed, but the difference between the two calculations is similarly small for incident angles of and . Note that the predicted diffraction efficiencies are scaled by a factor of 1.2 to fit them to the measurements, indicating that the throughput is % lower than the theoretical prediction. About half of this discrepancy can be explained by energy loss due to reflections at interfaces between glass substrate and ambient space. The other half has not been identified but it perhaps includes, e.g., internal absorption (identifying the source of this energy loss is beyond the scope of this paper). These calculations suggest that the expected change in throughput is as small as confirmed by the measurements.
4 Summary & conclusion
In this paper, we present results from cryogenic tests of VPH gratings at 100 . The aims of these tests are to see whether the diffraction efficiency at a low temperature as a function of wavelength is significantly different from that at room temperature and to see whether the grating can withstand a number of thermal cycles. Having exposed VPH gratings to 10 cycles between room temperature and 100 , we find that diffraction efficiency measured at 100 agrees with that at room temperature within the errors. We also find no clear evidence that the performance changes with the successive thermal cycles. These results were found for both of the two different VPH gratings investigated here, which may imply that VPH gratings can withstand such cryogenic temperatures in general. Ideally, an investigation of more gratings, in particular from different manufacturers and with different substrate materials, should be carried out to confirm this point.
It needs to be emphasized that we have only confirmed the performance of a low dispersion VPH grating at cryogenic temperature. It would be useful to repeat the same experiments for high dispersion VPH gratings. Since the band-width of a throughput curve is narrower for high dispersion gratings, some changes of physical properties (e.g., gelatin thickness) due to temperature variations are expected to be revealed much more clearly in the form of a shift of the throughput peak and/or a global decrease of the throughput. In this case, one would have to predict the change of characteristics due to temperature variations and take them into account in the design and fabrication of a VPH grating so that it could work with the optimal performance at the operating temperature.
Acknowledgements
We thank colleagues in Durham for their assistance with this work, particularly Jürgen Schmoll, Daniel Gedge, and the members of the mechanical workshop. We are also grateful to Ian Parry for letting us use his VPH grating for visible wavelengths. This work was funded by PPARC Rolling Grant PPA/G/O/2003/00022.
References
- (1) S. C. Barden, J. A. Arns, and W. S. Colburn, “Volume-phase holographic gratings and their potential for astronomical applications,” in Optical Astronomical Instrumentation, S. D’Odorico, ed., Proc. SPIE 3355, 866–876 (1998).
- (2) S. C. Barden, J. A. Arns, W. S. Colburn, and J. B. Williams, “Volume-Phase Holographic Gratings and the Efficiency of Three Simple Volume-Phase Holographic Gratings,” Publication of Astronomical Society of Pacific 112, 809–820 (2000).
- (3) A. Bianco, E. Molinari, P. Conconi, G. Crimi, E. Giro, C. Pernechele, and F. M. Zerbi, “VPHG in the cold,” in Specialized Optical Developments in Astronomy, E. Atad-Ettedgui, and S. D’Odorico, eds., Proc. SPIE 4842, 22–30, (2003).
- (4) S. Blais-Ouellette, D. Guzman, A. Elgamil, and R. Rallison, “Cryogenic VPH gratings for the CELT/TMT,” in Optical Fabrication, Metrology, and Material Advancements for Telescopes, E. Atad-Ettedgui and P. Dierickx, eds., Proc. SPIE 5494, 278–284, (2004).
- (5) P. -A. Blanche, P. Gailly, S. Habraken, P. Lemaire, and C. Jamar, “Mosaiced and high line frequency VPH gratings for astronomy” in Optical Fabrication, Metrology, and Material Advancements for Telescopes, E. Atad-Ettedgui and P. Dierickx, eds., Proc. SPIE 5494, 208–216, (2004).
- (6) M. Kashiwagi, K. Oka, M. Irisawa, N. Ebizuka, M. Iye, and K. Kodate, “Optimal design and fabrication of high-dispersion VPH grism for Subaru Telescope,” in Optical Fabrication, Metrology, and Material Advancements for Telescopes, E. Atad-Ettedgui and P. Dierickx, eds., Proc. SPIE 5494, 217–227 (2004)
- (7) H. Kogelnik, “Coupled-wave theory for thick hologram gratings,” Bell System Tech. J. 48, 2909–2947, (1969).
- (8) M. Kimura, T. Maihara, K. Ohta, F. Iwamuro, S. Eto, M. Iino, D. Mochida, T. Shima, H. Karoji, J. Noumaru, M. Akiyama, J. Brzeski, P. R. Gillingham, A. M. Moore, G. Smith, G. B. Dalton, I. A. J. Tosh, G. J. Murray, D. J. Robertson, and N. Tamura, “Fibre-Multi-Object Spectrograph (FMOS) for Subaru Telescope,” in Instrument Design and Performance for Optical/Infrared Ground-based Telescopes, M. Iye, and A. F. M. Moorwood, eds., Proc. SPIE 4841, 974–984, (2003).
- (9) G. A. Smith, W. Saunders, T. Bridges, V. Churilov, A. Lankshear, J. Dawson, D. Correll, L. Waller, R. Haynes, and G. Frost, “AAOmega: a multipurpose fiber-fed spectrograph for the AAT,” in Ground-based Instrumentation for Astronomy, A. F. M. Moorwood, and M. Iye, eds., Proc. SPIE 5492, 410–420, (2004).
- (10) N. Tamura, G. J. Murray, P. Luke, C. Blackburn, D. J. Robertson, N. A. Dipper, R. M. Sharples, and J. R. Allington-Smith, “Cryogenic Tests of Volume-Phase Holographic Gratings I. Results at 200 ,” Experimental Astronomy, 15, 1–12, (2003).
- (11) N. Tamura, G. J. Murray, P. Luke, C. Blackburn, D. J. Robertson, N. A. Dipper, R. M. Sharples, and J. R. Allington-Smith, “Cryogenic tests of volume-phase holographic gratings,” in Ground-based Instrumentation for Astronomy, A. F. M. Moorwood and M. Iye, eds., Proc. SPIE 5492, 634-642 (2004)
Table 1: The main components used for the measurements.
| Manufacturer | Product ID | Comments | |
|---|---|---|---|
| Light source | Comar | 12 LU 100 | Tungsten-halogen lamp |
| Monochromator | Oriel Instruments | Cornerstone 130, | 600 lines/mm grating, |
| Model 74000 | Blaze at 1 m | ||
| Fiber cable | Fiberguide Industries | Custom assembly | : 0.4 2.4 m |
| , Torr | |||
| - Fiber | AFS200/240A | Aluminium-jacketed | |
| low OH silica fiber | |||
| - Collimators | Custom assembly | Plano convex lenses | |
| (BK7, mm) | |||
| at both ends of the cable | |||
| Near-infrared detector | Indigo Systems | AlphaNIR | 320 256 InGaAs array |
| CCD camera | Starlight Xpress | MX516 | 500 290 pixels |