Radial variation of attenuation and star formation in the largest late-type disks observed with GALEX
Abstract
For a sample of 43 nearby, late-type galaxies, we have investigated the radial variation of both the current star formation rate and the dust-induced UV light attenuation. To do this we have cross-correlated IRAS images and GALEX observations for each of these galaxies, and compiled observations of the gas (CO and HI) and metal-abundance gradients found in the literature. We find that attenuation correlates with metallicity. We then use the UV profiles, corrected for attenuation, to study several variants of the Schmidt law and conclude that our results are compatible with a simple law similar to the one of Kennicutt (1998a), extending smoothly to lower surface densities, but with considerable scatter. We do not detect an abrupt break in the UV light at the threshold radius derived from H data (at which the H profile shows a break and beyond which only a few HII regions are usually found). We interpret the H sudden break not as a change in the star formation regime (as often suggested) but as the vanishingly small number of ionizing stars corresponding to low levels of star formation.
1 Introduction
Interstellar dust affects our view of galaxies from the UV to the near-infrared. High-redshift galaxies are commonly studied in the rest-frame UV where dust effects can be extremely severe, and our estimation of the “cosmic” star formation rate (SFR) (e.g. Schiminovich et al., 2005) crucially depends on the corrections applied to account for the dust attenuation of starlight.
Radiative transfer models suggest that the ratio of far-infrared to UV radiation is a reliable measure of the UV attenuation (Buat & Xu, 1996; Witt & Gordon, 2000; Panuzzo et al., 2003), depending weakly upon the geometry of stars and dust, the extinction law, or the nature of the underlying stellar population. Since this ratio is not always available, the slope of the UV spectrum reddening with respect to local starbursts (Calzetti et al., 1994; Meurer et al., 1995, 1999) has been commonly used as a metric to estimate the amount of attenuation. This allows one to compare the attenuation (as measured by the far infrared/UV ratio) to the slope of the UV spectrum in a diagnostic plot, the commonly-called “IRX- relationship”. Several recent works, mostly based on GALEX observations, cast doubt on the IRX- relation that has been most commonly used during the recent years (Buat et al., 2005; Cortese et al., 2006; Seibert et al., 2005; Gil de Paz et al., 2006). Independent studies have come to similar conclusions, e.g. Bell (2002) for normal spirals and Bell et al. (2002) for individual regions in the LMC.
These works suggests either that there is no relationship (or a very noisy one) or that a relationship exists but differs from the starbursts one, depending on the selection of the sample (infrared vs UV or optically-selected).
The largest angular sized galaxies in the GALEX Atlas of Nearby Galaxies (Gil de Paz et al., 2006) allow us to revisit the IRX- relationship. Indeed, several tens of nearby galaxies observed by GALEX are large enough to have been resolved even by IRAS. The combination of the UV data of GALEX and infrared of IRAS opens up the possibility of looking at the spatially resolved IRX- relationship across a relatively large sample of galaxies. Even if the number of resolved objects in this study is smaller than the total number of objects used in the global studies, each of our galaxies provides a number of independent points along the radial profile. Regions situated at the same radius within a galaxy are relatively homogeneous (for instance similar metallicities), thus radial profiles are physically relevant.
Another compelling reason to study attenuation111 “Attenuation” is the loss of flux due to the presence of dust. It is sometimes considered that “extinction” should be used only for the dust properties and not the global effect of dust on the galaxy light, also depending on e.g. the geometry of the system. “Extinction” is nevertheless often used with the same meaning as “attenuation”. in these galaxies is that, as our closest neighbors, they have been extensively surveyed at other wavelengths, and in the published literature there are metallicity gradient and gas density profiles, etc. that allow us to go one step further and try to characterize how the properties of dust might depend on these other physical quantities. We also produce star formation rate radial profiles derived from the UV (and not H data), corrected for the dust attenuation for all our galaxies. These profiles can be used to study how the star formation rate depends on the gas density, i.e. the so-called Schmidt law. We will be able to use these star formation rate profiles to finally study the threshold radius beyond which little (if any) star formation is observed. Many studies suggest that the threshold radius corresponds to the point where gas density becomes lower than a critical density for star formation (e.g. Martin & Kennicutt, 2001). It is important to bring as many constraints as possible to bear on the complex problem of star formation and this paper brings its share, by using UV GALEX data. Indeed, while many other studies of the Schmidt law (Kennicutt, 1998a; Boissier et al., 2003; Wong & Blitz, 2002) are based on H data, the star formation rate in this paper is derived from the UV, which “averages” the star formation on longer time-scales than H. Recombination lines as H are emitted only in presence of a large ionizing flux, coming mostly from massive stars () with lifetimes shorter than 2 years. On the contrary, the UV continuum is emitted by stars with lifetimes up to years (a review of the various star formation indicators and their associated lifetimes is given in Kennicutt, 1998b). Because of the scarcity of UV data before GALEX, little work had been done in the UV on the star formation law. Some exceptions are, that of Buat et al. (1989), Bersier et al. (1994) concerning respectively M81 and M51, or Buat (1989) and Donas et al. (1987) for studies using sample of nearby galaxies but these papers looked only at the integrated properties of galaxies, and employed rather simple recipes for dust correction. The radial variation of the UV-derived star formation rate, correctly dust-corrected via the far-infrared to UV ratio, is the subject of this paper. This is an important work as we now know that the UV also shows us low levels of star formation (XUV galaxies, e.g. Gil de Paz et al., 2005; Thilker et al., 2005), in regions with such low dust content that the far-infrared emission is undetected by IRAS, and that the UV is likely to be weakly affected by extinction.
In section 2, we discuss how the data-sets were assembled and prepared in order to undertake this study of the radial variation of the attenuation, of the star formation, and of their relation to other physical quantities in those same galaxies. In section 3, we present our study of the attenuation derived from these data, and the consequences concerning the resulting star formation law are presented in section 4.
| Name | E(B-V) | T | D | PA | D25 | d25 | Res. | References | |||
| (mag) | (Mpc) | (deg) | (’) | (’) | (”) | [O/H] | HI | CO | V(R) | ||
| IC 1613 (catalog ) | 0.025 | 10 | 0.8 | 50 | 16 | 15 | 106 | d | 24 | 24 | |
| IC 2574 (catalog ) | 0.036 | 9 | 4.0 | 50 | 13 | 5 | 110 | e | 25 | 25 | |
| M31 (catalog ) | 0.062 | 3 | 0.8 | 35 | 190 | 60 | 108 | i | 28 | 28 | 18, 27 |
| M33 (catalog ) | 0.042 | 6 | 0.8 | 23 | 71 | 42 | 108 | i | 17 | 19 | 17 |
| M51a (catalog ) | 0.035 | 4 | 8.4 | -17 | 11 | 7 | 117 | i | 5 | 30 | 40 |
| M64 (catalog ) | 0.041 | 2 | 17.0 | -65 | 10 | 5 | 116 | 10 | 36 | 10 | |
| M81 (catalog ) | 0.080 | 2 | 3.6 | -23 | 27 | 14 | 111 | i | 5 | 5 | 40 |
| M83 (catalog ) | 0.066 | 5 | 4.5 | 0 | 13 | 12 | 106 | i | 6 | 6 | 6 |
| M101 (catalog ) | 0.009 | 6 | 7.5 | 90 | 29 | 27 | 88 | b | 23 | 23 | 23 |
| NGC 0055 (catalog ) | 0.013 | 9 | 2.0 | -72 | 32 | 6 | 96 | i | 33 | 33 | |
| NGC 0247 (catalog ) | 0.018 | 7 | 3.1 | -6 | 21 | 7 | 107 | 14 | 14 | ||
| NGC 0253 (catalog ) | 0.019 | 5 | 3.9 | 52 | 28 | 7 | 114 | i | 34 | 41 | 34 |
| NGC 0300 (catalog ) | 0.013 | 7 | 2.0 | -69 | 22 | 16 | 106 | i | 32 | 32 | |
| NGC 0628 (catalog ) | 0.070 | 5 | 11.2 | 25 | 11 | 10 | 111 | a, h, i | 39 | 36 | 39 |
| NGC 0660 (catalog ) | 0.065 | 1 | 12.4 | -10 | 8 | 3 | 108 | 46 | 43 | ||
| NGC 0891 (catalog ) | 0.065 | 3 | 9.6 | 22 | 14 | 3 | 111 | 38 | 37 | 37, 38 | |
| NGC 0925 (catalog ) | 0.076 | 7 | 9.3 | -78 | 11 | 6 | 110 | h, i | 5 | 5 | 31 |
| NGC 1097 (catalog ) | 0.027 | 3 | 15.3 | -50 | 9 | 6 | 103 | g | 46 | 29 | |
| NGC 1291 (catalog ) | 0.013 | 0 | 9.7 | -15 | 10 | 8 | 88 | 42 | |||
| NGC 1512 (catalog ) | 0.011 | 1 | 10.4 | 90 | 9 | 6 | 95 | ||||
| NGC 1566 (catalog ) | 0.009 | 4 | 17.5 | 60 | 8 | 7 | 95 | i | 2 | ||
| NGC 2366 (catalog ) | 0.036 | 10 | 3.4 | 25 | 8 | 3 | 95 | f | 20 | 20 | |
| NGC 2403 (catalog ) | 0.040 | 6 | 3.2 | -53 | 22 | 12 | 103 | h, i | 5 | 5 | 3 |
| NGC 2841 (catalog ) | 0.016 | 3 | 14.1 | -33 | 08 | 4 | 105 | 3,9 | 45 | 3 | |
| NGC 2903 (catalog ) | 0.031 | 4 | 8.9 | 17 | 13 | 6 | 106 | h, i | 5 | 5 | 3 |
| NGC 3198 (catalog ) | 0.012 | 5 | 16.7 | 35 | 9 | 3 | 103 | i | 4 | 8 | |
| NGC 3521 (catalog ) | 0.058 | 4 | 9.0 | -17 | 11 | 5 | 104 | i | 36 | 15 | |
| NGC 3621 (catalog ) | 0.080 | 7 | 8.3 | -21 | 12 | 7 | 105 | i | |||
| NGC 3627 (catalog ) | 0.032 | 3 | 9.1 | -07 | 9 | 4 | 110 | 47 | 36 | 47 | |
| NGC 4216 (catalog ) | 0.032 | 3 | 17.0 | 19 | 8 | 2 | 108 | 16 | 22 | ||
| NGC 4236 (catalog ) | 0.015 | 8 | 4.5 | -18 | 22 | 7 | 102 | 11 | |||
| NGC 4395 (catalog ) | 0.017 | 9 | 4.2 | -33 | 13 | 11 | 104 | h, f | 44 | 44 | |
| NGC 4438 (catalog ) | 0.028 | 0 | 17.0 | 27 | 9 | 3 | 106 | ||||
| NGC 4559 (catalog ) | 0.018 | 6 | 17.0 | -30 | 11 | 4 | 104 | i | 12 | 12 | |
| NGC 4569 (catalog ) | 0.046 | 2 | 17.0 | 23 | 10 | 4 | 110 | 7 | 7 | 7 | |
| NGC 4594 (catalog ) | 0.051 | 1 | 9.1 | 90 | 9 | 4 | 108 | 1 | 1 | ||
| NGC 4631 (catalog ) | 0.017 | 7 | 9.0 | 86 | 16 | 3 | 106 | 35 | |||
| NGC 4656 (catalog ) | 0.013 | 9 | 9.0 | 33 | 15 | 3 | 106 | ||||
| NGC 4736 (catalog ) | 0.018 | 2 | 5.2 | -75 | 11 | 9 | 104 | i | 26 | 36 | 26 |
| NGC 5055 (catalog ) | 0.018 | 4 | 8.2 | -75 | 13 | 7 | 105 | i | 9 | 36 | 9 |
| NGC 7331 (catalog ) | 0.091 | 7 | 14.9 | -09 | 11 | 4 | 104 | i | 3 | 45 | 3 |
| NGC 7793 (catalog ) | 0.019 | 7 | 2.0 | -82 | 9 | 6 | 108 | i | 13 | 13 | |
| WLM (catalog ) | 0.037 | 10 | 1.0 | -20 | 12 | 4 | 104 | c | 21 | ||
Note. — The columns give (1) Object name, (2) Galactic color excess (Schlegel et al., 1998) , (3) RC3 morphological type, (4) Distance (Mpc) taken from the GALEX Atlas of nearby galaxies (Gil de Paz et al., 2006), (5) Position Angle (degree), (6) D25: major axis diameter (minutes), (7) d25: minor axis diameter (minutes), (8) FWHM of the restored 100 microns beam in arcsec (see section 2 for details), (9) References for O/H gradients, (10), (11), (12) References for HI, CO, and rotation curve data.
References. — References for Abundance Gradients [O/H]: a Belley & Roy (1992) ; b Kennicutt et al. (2003a) ; c Lee et al. (2003) ; d Lee et al. (2003) ; e Masegosa et al. (1991) ; f Roy et al. (1996) ; g Storchi-Bergmann et al. (1996) ; h van Zee et al. (1998) ; i Zaritsky et al. (1994). References for Gas [HI, CO] and Kinematic [V(R)] Data: 1 Bajaja et al. (1984) ; 2 Bajaja et al. (1995) ; 3 Begeman (1987) ; 4 Begeman (1989) ; 5 Boissier et al. (2003), and references within ; 6 Boissier et al. (2005), and references within ; 7 Boselli et al. (2006), and references within ; 8 Bosma (1978) ; 9 Bosma (1981) ; 10 Braun et al. (1994) ; 11 Braun (1997) ; 12 Broeils & van Woerden (1994) ; 13 Carignan & Puche (1990a); 14 Carignan & Puche (1990b) ; 15 Casertano & van Gorkom (1991) ; 16 Cayatte et al. (1994) ; 17 Corbelli (2003) ; 18 Dame et al. (1993) ; 19 Heyer et al. (2004) ; 20 Hunter et al. (2001) ; 21 Jackson et al. (2004) ; 22 Kenney & Young (1988) ; 23 Kenney et al. (1991) ; 24 Lake & Skillman (1989) ; 25 Martimbeau et al. (1994) ; 26 Mulder & van Driel (1993) 27 Newton & Emerson (1977) ; 28 Nieten et al. (2006) ; 39 Ondrechen et al. (1989) ; 30 Paglione et al. (2001) ; 31 Pisano et al. (1998) ; 32 Puche et al. (1990) ; 33 Puche, Carignan & Wainscoat (1991) ; 34 Puche, Carignan & van Gorkom (1991) ; 35 Rand (1994) ; 36 Regan et al. (2001) ; 37 Sakamoto et al. (1997) ; 38 Sancisi & Allen (1979) ; 39 Shostak & van der Kruit (1984) ; 40 Sofue (1997) ; 43 Sorai et al. (2000) ; 44 van Driel et al. (1988) ; 45 van Driel et al. (1995) ; 46 Wevers et al. (1986) ; 48 Young & Scoville (1982) ; 50 Young et al. (1995) ; 51 Zhang et al. (1993).
2 Profiles: Data and Procedure
Our initial sample consists of 48 late-type galaxies (RC3 T type going from 0 to +10, thus including all spirals from S0/a to Sm and magellanic irregulars Im) with UV data in the GALEX Atlas of nearby galaxies (Gil de Paz et al., 2006), larger than 8 arcmin (as measured by diameter corresponding to the B-band isophote of 25 mag arcsec-2.) This size allows for spatial resolution of these galaxies at all the wavelengths needed, including the 60 and 100 m IRAS data.
All the IRAS images were obtained using HIRES requests to the IPAC web page222http://irsa.ipac.caltech.edu/IRASdocs/hires_over.html. The method used in HIRES is described in Aumann, Fowler and Melnyk (1990); examples of images obtained with HIRES have been presented by Rice (1993) for a sample of nearby galaxies (The HIRES procedure failed to converge for NGC 3109, and this galaxy was removed from our analysis). Because of the IRAS aperture itself and the complex pattern of observations, the resulting HIRES images can be quite asymmetric. HIRES produces simulated images of point sources distributed into the image at the sky position of the targeted object. The first step in our procedure was to apply an asymmetric Gaussian convolution in order to produce a circular image at 60 m and 100 m of these point sources, and to apply the same convolution to the HIRES reconstructed image of the galaxy.
In the UV, the GALEX FUV and NUV (Far and Near UV, respectively around 1516 and 2267 Å) images of the Atlas (Gil de Paz et al., 2006) were used. For four galaxies, no FUV data were available (NGC 1365, NGC 3628, M98, M106), and they are excluded from our analysis which in fine includes 43 galaxies. Given this selection process, this sample is not complete in any sense, although it should be representative of optically selected galaxies (a comparison of the GALEX Atlas of nearby galaxies and the Nearby Field Galaxy Survey of Jansen et al. 2000 is given in Gil de Paz et al., 2006).
Stars were removed using the star masks of the Atlas and then interpolated over. Foreground Galactic extinction was corrected as in Gil de Paz et al. (2006) : using the values of the color excess E(B-V) given by the maps of Schlegel et al. (1998) and a Galactic extinction curve.
Images in FUV, NUV, and at 60 m were then convolved with an elliptical Gaussian function in order to match the resolution to the one measured in the HIRES simulation of point-sources at 100 m (after the asymmetric Gaussian convolution discussed above). The spatial resolution of IRAS is relatively poor. However, this might help us to avoid difficulties in interpreting the UV/IR balance since the dust of small regions could be heated by the UV emission from neighboring regions.
Profiles were finally computed within elliptical annuli with ELLIPSE in IRAF333 IRAF is distributed by the National Optical Astronomy Observatories, which are operated by the Association of Universities for Research in Astronomy, Inc., under cooperative agreement with the National Science Foundation. using convolved images, with fixed center, ellipticity and position angles (as given in Gil de Paz et al. 2006 and Table 1). The step in major axis radius between isophotes was chosen to be the measured resolution (close to 1.5 arcmin on average, and given in Table 1).
The infrared profiles were combined as in Dale et al. (2001) in order to compute a “far-infrared” profile ( in W m-2 arcsec-2) and a “total-infrared” profile (), as described below:
| (1) |
( are the IRAS flux surface densities in Jy arcsec-2) and
| (2) | |||||
where
Attenuation profiles (expressed in magnitude) were then computed using the fit of Buat et al. (2005)
| (3) | |||||
where ; and is the FUV flux surface density in W m-2 Hz-1 arcsec-2. Other expressions linking and do exist (e.g. Burgarella et al., 2005) with subtle differences, and since this kind of calibration might also be subject to future revisions, we included in our figures both scales (observed , calibrated ).
Given the long chain of operations in computing , we estimated in a simple way its uncertainty by computing the extremal values it can take when moving the UV and infrared fluxes by 1 from their observed values. FIR and UV data are moreover uncertain by 15 % on average, (see e.g. Morrissey et al. 2005 for an assessment of the quality of the GALEX photometry, and Rice 1993 for the photometry of IRAS extended galaxies).
The additional uncertainty in the calibration of the relation given in equation 3 itself is not taken into account. Points and error-bars were not allowed to include negative attenuations. In the few cases where the obtained in this way was unphysical (e.g. for numerical reason), the last consistent estimated error was used for points at larger radii (this only affects a few outer points where error-bars are anyway large as can be seen in the profiles given in the appendix).
The FUV observed profiles were finally corrected for attenuation using , corrected for inclination, and converted to a star formation rate using the Kennicutt (1998b) calibration. The inclination correction accounts for the fact that the thickness of a galaxy (and thus the amount of stars) along the line of sight has to be multiplied by ( being the inclination of the galaxy) to obtain the same values for a face-on orientation (=0). The adopted inclination is given by the ratio of and from Table 1, assuming the objects are intrinsically circular. Note that this procedure assumes that we computed the correct for the inclination of the galaxy. Panuzzo et al. (2003) showed that the relation between and the ratio actually depends on inclination. Their fit for edge-on galaxies differs from the fit for moderately inclined galaxies by up to about 0.3 magnitude of extinction at 2000 Å. There are other reasons why we should be cautious about very inclined galaxies: i) Our data points are separated by one element of resolution along the major axis. In the case of inclined galaxies, the ellipses along the minor axis will be closer to each other than the resolution. Outer regions might therefore be contaminated by inner regions. ii) In an edge-on disk, the amount of material along the line of sight is such that only a full radiative-transfer modeling can be used to reconstruct the UV to sub-millimeter spectral energy distribution of galaxies (e.g. Popescu et al., 2000). For this reason, our data are presented when possible with different symbols for various axis ratio ranges, and we discussed in the text when the inclination affected our results.
Corollary data were collected from the literature, concerning the gaseous content (HI, CO, Rotation curve) and the oxygen abundance gradient of the galaxies. CO data were converted to molecular H2 using the conversion factor of Boselli et al. (2002), dependent on the metallicity when an abundance gradient was available. For the seven galaxies without metallicity gradient, we used the conversion factor corresponding to the H-band luminosity of each galaxy, using the calibration of Boselli et al. (2002).
The gas profiles taken from the literature were converted to the same inclination as mentioned before (indicated by the index “inc”). We also determined face on values (index “0”) of the same quantities performing a similar correction than the one applied to the UV surface brightness (equivalent to a star formation rate surface density). Note that face-on values should be used to compare star formation rate and gas surface densities; while the extinction profiles obtained for the observed galaxy inclination should be compared to the column densities along the line of sight, i.e. the ones with the “inc” index. While we corrected the original gas data to have consistent inclination with our own UV and far-infrared computations, we must acknowledge that this compilation introduces some level of uncertainty since all observations were not performed with the same instruments, spatial resolution, etc. We however consider that this effect is included within the typical uncertainties discussed below.
Typical uncertainties are 0.15 dex for abundances, about 10 % for HI data and 50 % for H2. The fact that we used a constant CO-to-H2 conversion factor when we had no abundance gradient for 7 galaxies must introduce an error in their molecular gas column densities. However, Fig. 1 of Boissier et al. (2003) shows that usually the difference between a constant and a metallicity-dependent conversion factor is lower than 0.5 dex. When computing the total gas density (HI+H2), a significant number of points have only HI data, and the contribution of H2 was then assumed to be negligible. This of course introduces another uncertainty on the total gas density, however: i) Most of those points correspond to outer regions of disks in which CO is detected and measured only for the inner portion of that same galaxy. It is reasonable to assume that the molecular fraction is small in these outer regions. ii) In 13 galaxies, we only have HI data (even in the center of the galaxy) but taking into account that only a minor fraction of the total gas is usually in the form of molecules (about 15 %, see Boselli et al., 2002) and that when we do have both profile, H2 dominates only for a few central points, and in most cases by only a factor a few; we must conclude that the error we commit is relatively small in most cases. We will nevertheless keep in mind these drawbacks when discussing our results.
When we found several sets of data, we usually adopted one (that seemed better -more recent, better sensitivity), and checked the consistency between them. In a few cases, we adopted an average or a combination of several references. Note that we interpolated the profiles given in the literature at the resolution adopted in our work. The original resolutions are very variable, but usually better than the IRAS one. The gaseous profiles obtained following this procedure are given in the figures in the appendix for each individual galaxy (at the same resolution as for the rest of our work). Table 1 gives the references for all of these data.
3 Attenuation in the disk of late type galaxies
3.1 Attenuation radial profiles
The attenuation profiles are shown for each individual galaxy in the appendix. Most of them present a global decrease of extinction with radius. At large radii, error-bars are very large due to low levels of measured infra-red emission, so that the data are always consistent with no attenuation in the outer disks. The central value of the estimated FUV attenuation is typically of a few magnitudes (ranging from virtually 0 to about 6 magnitudes). The most central point of our profiles could be affected by the presence of a bulge with e.g. UV upturn, or of a AGN. The fact that we see in the individual profiles continuous trends with radius let us think that on average our extinction gradients are not much affected by such cases (in the figure of the appendix, only M31 and NGC0253 do present a strong disturbance in the central part of the profile).
A similar trend of decreasing extinction gradients was present in the six galaxies of the FOCA/IRAS study of Boissier et al. (2004). Holwerda et al. (2005b) used counts of distant galaxies, with a “synthetic field method” (Holwerda et al., 2005a) to estimate extinction gradients. Their totally independent results are consistent with ours, although the uncertainties are larger in their method.
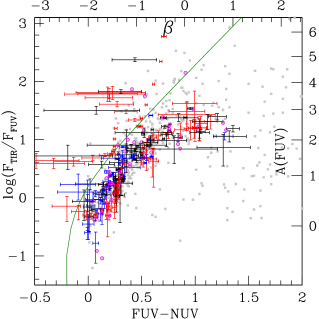
At this point, we would like to include some warning concerning the derived extinction . By adopting the Buat et al. (2005) calibration, we assume that the star formation histories they adopted are representative of real galaxies. However, it is probably not the case for a few galaxies (or at least, parts of galaxies) suffering heavy quenching of the star formation rate (that could be induced, for instance by ram pressure in clusters, e.g. Boselli et al. 2006). In such galaxies, the GALEX FUV-NUV color would be intrinsically red (close to or above 1), with a different relationship between and than the one we adopted. Such situations will be studied in Cortese et al. (in preparation). Part of the scatter in the right part of Fig. 1 could be due to such effects. As a result, applying extinction correction to individual galaxies (or profiles) should still be done with caution, especially for red FUV-NUV colors. In our approach, the number of galaxies is sufficiently large so that such effects should be minor on our global results.
3.2 The Infrared Excess - UV Slope (IRX-) Relationship
Heckman et al. (1995) and Meurer et al. (1995, 1999) demonstrated with IUE data the existence of a relation between the slope of the UV spectrum () and the TIR / UV ratio (so called IRX- relationship) for starburst galaxies. It has been common thereafter (especially for high redshift objects) to estimate the extinction from the UV slope using the IRX- relationship (e.g. Schiminovich et al., 2005). In the recent years, however, several studies have shown that this relation does not hold for all galaxies. For example, Bell (2002) showed that it fails in nearby galaxies, and Buat et al. (2005) came to the same conclusion for samples of UV and far-infrared-selected galaxies. Kong et al. (2004) proposed models with a large variety of star formation histories, demonstrating that they could span a large portion of the IRX- plane. In this framework, the starburst relation would hold for galaxies with extremely large current-to-past-average star-formation rates (birthrate parameter), while galaxies with less activity would lie systematically below the relation. However, it seems that a relation can be found in nearby galaxies (see e.g. Gil de Paz et al., 2006; Cortese et al., 2006; Seibert et al., 2005), given a simple offset with respect to the original relation proposed for starbursts. This means that the range of star formation histories among real galaxies is probably not as wide as among models of Kong et al. (2004) and that the parameter might not be the driver of the IRX- relationship. Actually, Burgarella et al. (2005) showed that the slope of the extinction and the presence or not of a bump has a larger impact on the position in the IRX- plane than the star formation history (and the parameter). As discussed in Gil de Paz et al. (2006), Cortese et al. (2006) and Seibert et al. (2005), the difference in the IRX- relation for starbursts and normal galaxies might be due to geometrical effects, aperture effects present in the IUE data. The relative calibrations in the computation of with IUE’s data and GALEX FUV-NUV color index could also play a role. More work remains to be done.
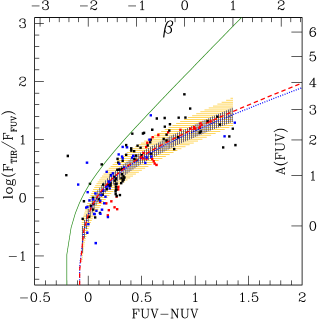
In this context, our nearby galaxies have the advantage of being close enough so that we can spatially resolve the IRX- relationship. While this has been done by looking at individual regions in a few galaxies already, for instance M51 (Calzetti et al., 2005), we present for the first time the IRX- relationship for the profiles of all the large late-type galaxies of the GALEX Nearby Galaxies Atlas in Figure 1. It is particularly interesting to note that while outliers are present (with correspondingly larger error-bars), most of the points describe a very tight relation, but shifted from the classical relation derived for/from starbursts, similar to the recent works of Gil de Paz et al. (2006); Cortese et al. (2006); Seibert et al. (2005) (see discussion above for the possible reasons for this shift). In order to quantify the relationship, we performed a nonlinear least squares fit of the form (with =FUV-NUV, the color between the two galex bands, and =, after rejecting quite edge-on galaxies(NGC 0055, NGC 0253, NGC 0660, NGC 0891, NGC 4216, NGC 4621, NGC 4656a). We obtained for respectively 0.570, 0.671 and 3.220 using y-uncertainties as weight, and 0.561, 0.713, 3.136 using no weights. These fits and their associated 1 sigma dispersion are shown in the right part of Fig. 1.
The fact that our IRX- relationship is quite tight is also interesting as there is much more scatter when individual regions are looked at, see for instance Calzetti et al. (2005) in M51a, or Thilker et al. (2006) in NGC 7331, both studies based on the GALEX/SINGS joint analysis of GALEX and Spitzer data from the SINGS project (Kennicutt et al., 2003b). By azimuthally averaging profiles, we remove the effects due to small-scale star-formation histories (affecting the UV slope), and is likely to reduce the effect of radiative transfer peculiarities on small scales: that is, the dust in some small regions may well be heated by the UV emission from neighboring regions. Using the low resolution of IRAS (coupled with azimuthally averaging) may turn out to be an advantage in this respect.
Figure 1 also presents the integrated values for the galaxies of the Atlas (Gil de Paz et al., 2006) as grey squares. The squares overploted with a circle correspond to the integrated value given in the Atlas for the galaxies of the present study. The relation of our study seems tighter than the one for the integrated galaxies of the Atlas. This can be explained by the combination of several effects: i) For all our galaxies, we followed exactly the same procedure from scratch, i.e. we do not use published fluxes but rather re-derive them ab initio, in contrast the UV Atlas for which fluxes were compiled from a wide variety of sources. ii) In integrated galaxies, centers with activity might affect the whole flux if they are strong enough, while they probably influence only the central point in a profile like the one we compile. About half of our galaxies have a sign of central activity (AGN, LINER, Seyfert indicated in NED), but precisely because it is confined to the central point, it should not affect much our profiles.
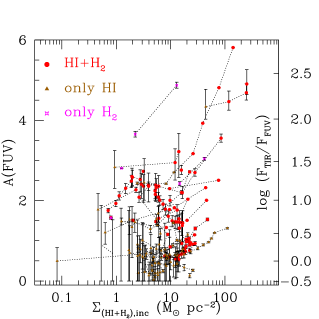
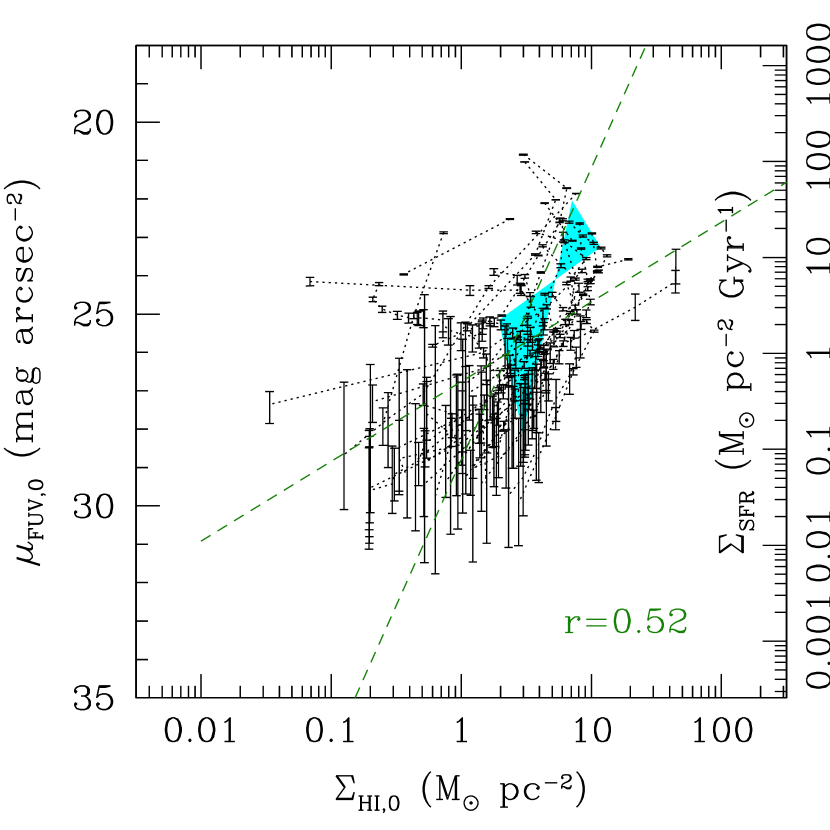
3.3 The Absence of a trend between Attenuation and Gas Column Density
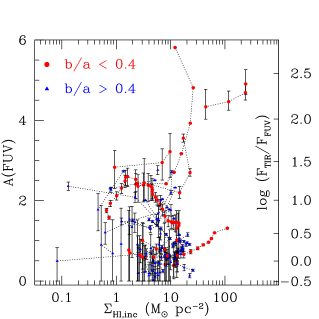
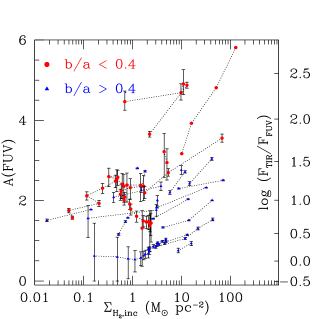
It is relatively common to consider the attenuation to gas density ratio as being constant. For instance, Komugi et al. (2005) adopt . This is essentially inspired by studies in the Milky Way such as Bohlin et al. (1978). Under this assumption, one would expect a strong correlation between gas density and attenuation, what is not supported by our results (see Fig. 2, 3). Thus, attenuation (and therefore the existence of dust) is probably affected by various processes not directly related to the gas density. In Fig. 2, we show the amount of extinction as a function of the gas in the form of neutral hydrogen (HI, left) and in the form of molecular hydrogen (H2, right). Within individual galaxies (points connected by one dotted curve), a trend of increasing attenuation with gas densities is generally visible (specially with H2). However, the differences from one galaxy to another are large, so that globally no relation is clearly emerging. The fact that the amount of attenuation does not seem to correlate with the HI colum density was also found by Holwerda et al. (2005b). A small trend can be seen between the molecular gas and the extinction. While this seems reasonable (inner regions are denser, have larger extinction and higher molecular fraction) and is observed in most galaxies individually, the variations from one galaxy to another are still extremely large. In Fig. 3, we compare the ultraviolet attenuation to the total gas density. In this case, we are in an intermediate situation. At low gas column densities, which correspond usually to the outer part of galaxies (where errors are larger), no trend is observed. In the inner parts of galaxies, the situation is the same as for H2 since the molecular gas often dominates the total gas density or at least appears to compensate for the central plateau or the observed decrease of HI in the central regions of galaxies.
In conclusion, our data do not support any relation of the type (commonly used in the literature). This is actually not surprising as is not a measure of the dust mass, but of the amount of dust heated by nearby young massive stars. As such, it will be largely affected by geometrical effects, and the physical properties of the dust grains (type, size distribution…), what would probably erase any underlying relation between the dust and gas masses. Because the dust mass is dominated by cold dust, is just not a good measure of it. Estimating the dust mass, and thus the dust to gas mass ratio is out of the scope of this paper since IRAS wavelengths do not allow us to probe the cold dust.
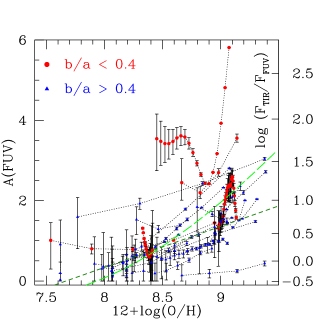
3.4 The Attenuation-Metallicity Relationship
While the relation observed with the gas is ill-defined, the attenuation seems to depend in a clearer way on the metallicity (Fig. 4). Indeed, for a given abundance of oxygen, the scatter in observed extinction is smaller than at any given gas surface density. This is especially true if we exclude the galaxies with the largest inclinations in which the method used to derive the attenuation might suffer from various problems as commented in section 2. We performed a least squares minimization fit to the points within galaxies with axis ratio larger than 0.4 and found:
| (4) |
(the dispersion around this fit is =0.5 mag, and the correlation coefficient is 0.65).
This is qualitatively consistent with the earlier work of Boissier et al. (2004). Albeit a bit shallower, this relation is characterized by similar attenuations in the high metallicity range (at 9.3). Due to the limited number of galaxies, there were no points at the lower metallicities (7.5-8.5) in Boissier et al. (2004). A source of potential difference between this earlier study and the present one is that it was performed at the FOCA wavelength rather than GALEX. In Boissier et al. (2004), the extinction determined in the integrated star forming galaxies of Buat et al. (2002) with metallicities of Gavazzi et al. (2004) were also shown to exhibit a similar trend. Our results are also in good agreement with the recent study of Cortese et al. (2006) (although their trend is slightly stronger than ours), for a sample of integrated cluster galaxies observed with GALEX (their fit of the TIR-to-FUV ratio is converted to our scale in Fig. 4).
Note that the attenuation-metallicity relationship we found concerns galaxies forming stars in a relatively quiescent (disk)-mode. Heckman et al. (1998) have shown that the UV slope is correlated with the metallicity in starbursts, also corresponding to a metallicity-extinction relationship among starburst, shifted however with respect to the spirals to higher extinctions (and presented in Boissier et al., 2004).
4 Star Formation Law
4.1 The Theoretical Star Formation Laws
The star formation on galactic scales is obviously a crucial phenomenon in the evolution of galaxies. As a result, it is also a fundamental element of any galaxy evolutionary model, e.g. N-body/semi-analytical models like GALICS (Hatton et al., 2003), SPH/chemical evolution models (Lia et al., 2002), chemical / spectrophotometric evolution models (Boissier & Prantzos, 1999). Despite its importance, only rough theories exist and a few empirical relationships have been looked for (e.g. Madore, 1977; Buat et al., 1989; Kennicutt, 1998a; Wong & Blitz, 2002). An excellent review of the empirical situation is given in Kennicutt (1998b), while Elmegreen (2002) consider the possible physical origin of the empirical laws. The reader is refereed to these works for an extensive discussion on the topic. Here, we only come back rather quickly on a few of the relations proposed for the “star formation law”. These “laws” should allow us to predict the star formation rate from other physical quantities, as shown below. Especially, we will look for relations between the star formation rate surface density () and the gas surface density in its various phases (neutral, molecular) as well as in total gas (neutral + molecular), under the form of a traditional “Schmidt law” (see Schmidt, 1959 for the original work):
| (5) |
It is reasonable to expect a more direct relationship with the molecular gas rather than the neutral gas since this phase is more closely in the sequence related to the ensuing star formation event. For instance, in their disk model consisting of self-gravitating clouds interacting to produce a turbulent viscosity, Vollmer & Beckert (2002) found that the star formation rate and molecular gas surface densities should follow the same dependence with galactic radius. On the observational side, while a relation between star formation rate and molecular mass was not initially confirmed (Kennicutt, 1989; Boselli et al., 1995), Boselli et al. (2002) showed that using a luminosity or metallicity-dependent CO-to-H2 conversion factor provides a better relation than using HI alone.
While this suggests a more direct connection between the star formation rate and the molecular gas, the cause for star formation could still be related to the total gas. Indeed, a basic model of self gravitating disk would suggest a Schmidt law with the total gas density as the main control parameter (Kennicutt, 1998a).
The other model we will consider here is a Schmidt law modulated by a dynamical factor:
| (6) |
where is the rotational velocity at radius (where the surface densities are determined). The ratio can be considered either as representing the frequency of the passage of density waves enhancing star formation (Ohnishi, 1975; Wyse & Silk, 1989) or a dynamical time-scale (Kennicutt, 1998b). In their model of the chemical evolution of the Milky Way, Prantzos & Aubert (1995) found that an another factor in addition to a simple Schmidt law was necessary and opted for a relation of the type given by equation 6 with a constant, and 1. Subsequent models of the Milky Way and spirals used a similar SFR law (Boissier & Prantzos, 1999, 2000) but with . This was found to give agreement with the H profiles of 16 nearby spirals studied by Boissier et al. (2003) although other laws could not be excluded. Boissier et al. (2003), had also tested a dependence on the stellar surface density in addition to the gas, as proposed by Dopita & Ryder (1994). Despite having an additional free parameter, this formulation did not offer a better fit to their data. To explore this further we would need near-infrared surface brightnesses for our galaxies. Unfortunately 2MASS data are not sufficiently deep in outer parts of our galaxies, and we decided to omit consideration of this law in our present study.
Before testing the above proposed laws, we should note that the field of galactic star formation is not lacking new ideas. For instance, Elmegreen (2005) proposed that a combination of processes trigger star formation, conforming to the observed relations and thresholds (densities below which no star formation would occur). Seigar (2005) presented an interesting correlation between the specific star formation rate and the shear rate, stressing the possible role of shear in star formation; however the shear versus average star formation rate (his Figure 4) has large dispersion. Our rotation curves do not have the necessary resolution or homogeneity to explore trends involving the shear rate. It has also been recently suggested (Barnes, 2004) that star formation may depend not only on the local gas density but may also be induced by shocks, especially in the case of interacting galaxies (we do not have such violently interacting systems in our sample). Testing this kind of star formation law requires detailed dynamical modelling on a case by case basis. Barnes (2004) showed that this idea is promising by reproducing observations of the Mice. It would be however hard to implement such a law in e.g. semi-analytic model since it needs a detailed dynamical modelling of each interacting systems (including their precise geometry and details of the encounter).
In any case, a best possible law for star formation should still properly reproduce the relation observed between gas, dynamics and star formation indicators that we compiled for our GALEX galaxies, whatever the physical causes are. Thus, this purely empirical work provides additional constraints for future theoretical work and galaxy evolution models.
4.2 Our constraints on the star formation laws
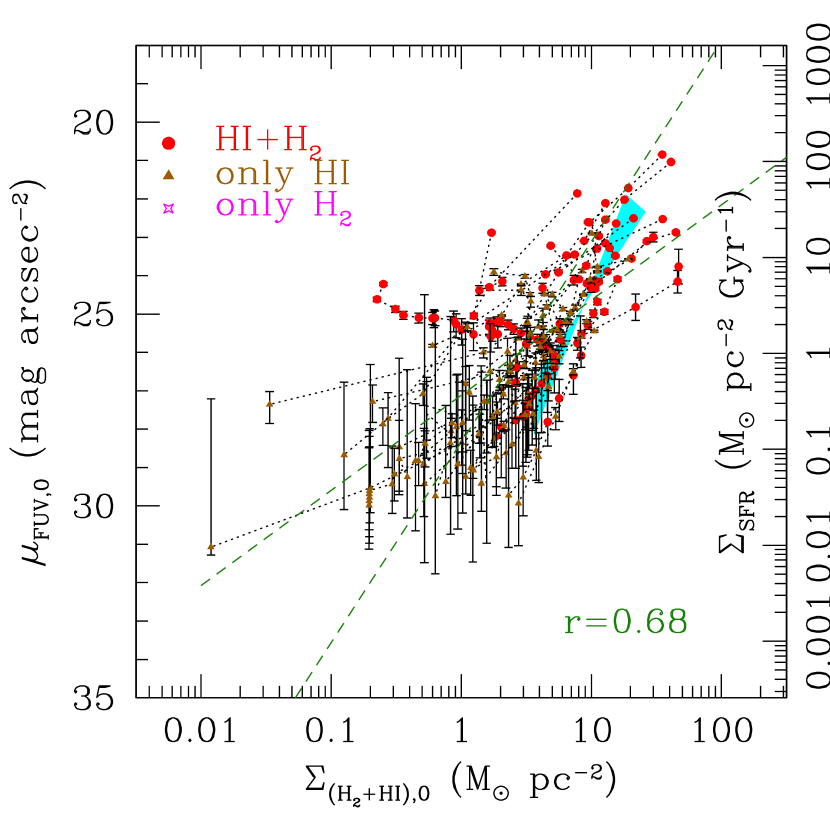
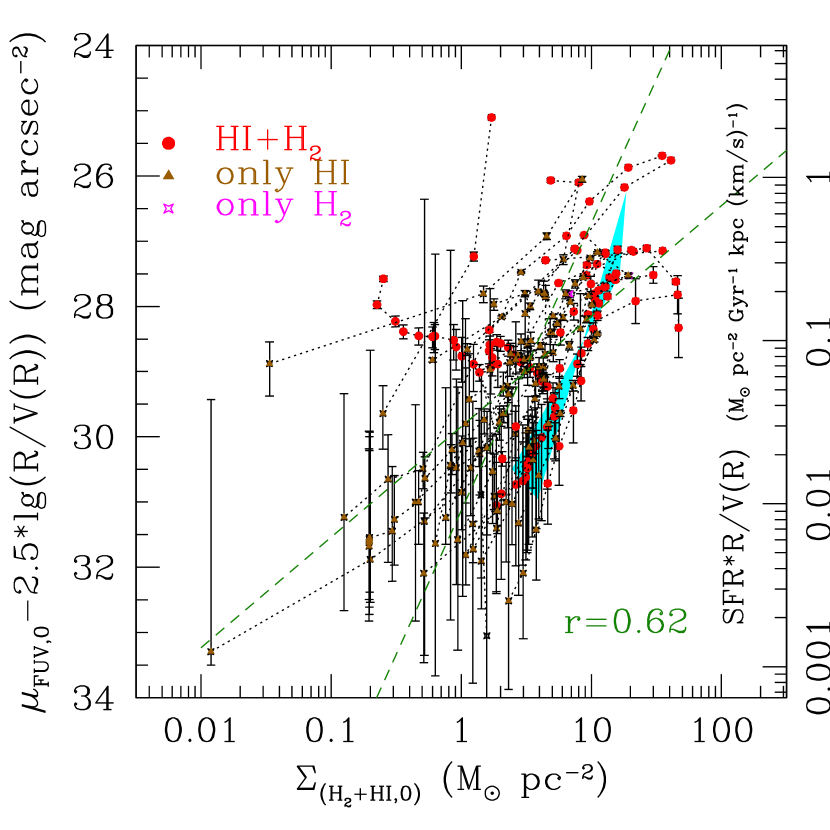
In each panel of Fig. 5 we show a variant of the simple Schmidt law (SFR versus neutral gas, molecular gas, total gas), testing equation 5 and a combination of the SFR + dynamical factor versus total gas testing the relation of equation 6. In this figure, the internal contributions of individual galaxies are connected by dotted lines. Individual SFR and gas profiles, as well as SFR vs gas are given for each galaxy individually in the Appendix. Correlation coefficients are indicated in each panel, as well as the two (dashed) regression lines whose coefficients are given in Table 2. For each relation, the first regression line is obtained by performing a least square fit of the star formation rate surface densities with the gas surface densities being given (minizing the errors on the Y axis), and the other one by performing a least square fit of the gas surface densities with the star formation rate surface densities being given (minimizing the errors on the X axis).
| N | |||||||
|---|---|---|---|---|---|---|---|
| 0.83 | -0.30 | 3.04 | -1.11 | 0.52 | 232 | ||
| 0.57 | 0.58 | 1.26 | 0.63 | 0.67 | 108 | ||
| 0.99 | -0.44 | 2.09 | -0.92 | 0.68 | 236 | ||
| R / V(R) | 0.68 | -1.53 | 1.76 | -2.04 | 0.62 | 228 |
It is obvious from this figure that the form of the observed star formation laws differs from one spiral galaxy to another. This was already known and discussed earlier (e.g., Boissier et al., 2003; Kennicutt, 1998a). It is hoped that averaging over many galaxies is equivalent to averaging the radial star formation history of any given galaxy over time. The trend with H2 seems relatively good on the high density side (larger than 1 M⊙ pc-2) but the number of points with molecular gas alone is very small, and the results are inconclusive, especially given the additional uncertainty on the conversion factor. As in the case of extinction vs H2, however the scatter seems too large to be caused by this factor alone. We note that Komugi et al. (2005) show that H2 is very well correlated with the star formation rate but they are interested in high-density regions and galactic nuclei, working at high resolution. In our case, to the contrary, the central parts of the galaxies have little influence in our plots since we are working at low resolution and looking at the largest possible radii. When the total gas is used, as in the study of the attenuation, we acknowledge that the absence of molecular gas data can affect the precise value of the slope and the intercept; however, the scatter seems too large to be entirely due to the uncertainties in the H2 content alone. Boissier et al. (2003) showed that the extrapolation (or not) of CO data, and the use of a metallicity-dependent or a constant conversion factor did change significantly their results, but mostly influenced the star formation threshold (without much affecting the rate exponent ).
Among all of the Schmidt law variants that we tried, the simple Schmidt law (with a dependence on the total gas density) gives the best results, although the correlation coefficient for the molecular gas and the “dynamical” law (respectively 0.67 and 0.62) are close to the one for the total gas (0.68). Komugi et al. (2005) have shown that the simple Schmidt law extends to higher gas surface densities when smaller and central regions (assumed to be dominated by H2) are considered. If added to our diagrams, their data would go from about 10 to 1000 for the gas, corresponding to a range in star formation rate from about 1 to 1000 . This is compatible with an extrapolation of our adopted Schmidt law (using the total gas) to larger surface densities, with a similar slope. We notice however a shift to lower star formation rates for the same gas density. In their study, the SFR is derived from H, which might explain this offset (see below for a discussion on this point).
In all panels of Fig. 5, we also show for comparison the results of Boissier et al. (2003), in the form of a hourglass-shaped shaded area (the extent of the hourglass being the extent of the observations, and the diagonals the regression lines found in this work). This study used H profiles for 16 spiral galaxies. There are some systematic differences: on average they found lower star formation rates for the same gas density than in our present study, except with HI. The slope of a simple Schmidt law was also slightly steeper than what we find. Overall, taking into account the large dispersion, the differences are not dramatic and may be caused by i) inadequate/uncertain corrections: for instance, in Boissier et al. (2003) H was corrected for extinction and [NII] contamination by standard factors depending only on the galaxies type (a common procedure), but not considering possible radial variations, ii) calibration issues : the conversion of H and UV light to star formation rates depends on the initial mass function adopted for converting the observed fluxes (Kennicutt, 1998b). For example, if the assumed IMF overestimates the number of ionizing stars, the star formation rate derived from H will be underestimated. Another difference, that cannot be explained by these effects is the fact that the gas extent was smaller, i.e. with our UV profile, we detect low levels of star formation, corresponding to lower levels of gas surface densities.
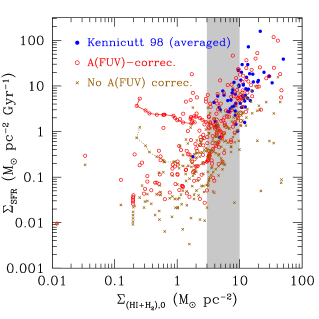
In Fig. 6, we compare the simple Schmidt law (obtained from our UV radial profiles versus total gas) to the galaxies of Kennicutt (1998a), obtained from H imaging of spiral galaxies, averaged within their optical disk. Considering the scatter, the agreement between both studies is quite good. Here again, however, we have many more points at low gas densities. We also include in this diagram the star formation rate values derived from the UV assuming zero attenuation (crosses). These are lower limits on the star formation rate, showing that a significant amount of star formation is detected at low gas densities, and this result does not depend on the attenuation correction. This comes from several facts: i) Kennicutt’s estimates are averages within R25, where densities are on average higher ii) In the UV, we do find emission at low levels of star formation (in stark contrast to H observations), corresponding to gas surface densities below the putative threshold for star formation.
In this figure, we also connected the points corresponding to M31. The inner 50” of this galaxy are orthogonal to the usual Schmidt relation (and the one found in the rest of the sample). We leave for later studies to interpret this untypical behavior of one of our nearest neighbor.
Our plots might appear more highly dispersed than other studies (e.g. Komugi et al., 2005; Kennicutt, 1998a) but this is mainly because we do not work on a large range of gas densities (i.e., the scatter only seems smaller in Kennicutt (1998a) because of the larger dynamic range introduced into the plots when circumnuclear starbursts are included), and we are working primarily at low densities where stochastic effects and larger uncertainties may have a larger impact. Another possible cause of the dispersion is that we are using UV data, and as Buat et al. (1989) noted, the time-scales we are probing is significantly longer than with H, probably making the underlying “causal” relations harder to catch (Madore, 1977).
4.3 Concerning the Notion of a Threshold
Star formation rate profiles, derived from H data are known to frequently present an abrupt break, while atomic gas is generally much more spread than the star forming and the stellar disc (e.g. Martin & Kennicutt, 2001). This observation is traditionally interpreted as the result of local instabilities developing in differentially rotating discs within a threshold radius where the gas density is larger than a critical density (Toomre, 1964). More complex physics has also been suggested (e.g. the onset of thermal instability of Schaye, 2004).
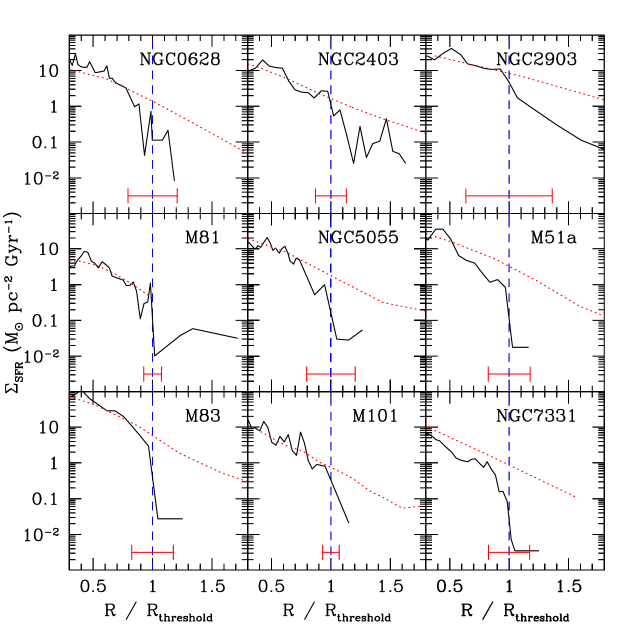
The above-described observation of a Schmidt-like behavior at very low gas densities as derived from UV radial profiles suggests that low-levels of star formation are in fact common beyond the usual threshold radius, where H emission ceases or is not (as easily) observed. We can verify that this is actually the case by taking the 9 galaxies for which we have UV and infrared data, H profiles from Martin & Kennicutt (2001), and for which the threshold radius given in Martin & Kennicutt (2001) is larger than 90 arcsec. This last condition ensures that we would resolve the threshold at our low resolution. The star formation rate profiles derived from the UV and the H emissions are presented in Figure 7. Within the threshold radius , they are in rough agreement, while a systematic difference occurs beyond it: eight out of the nine galaxies show no truncation (or any change of slope) in the UV profiles at the position of the H threshold. The last one is M81, for which our UV profiles ends at the position of the threshold. Note that we are limited for this galaxy by its large angular size: the south outer part of the galaxy is getting close to the limit of the GALEX field of view. The infrared background is also relatively bad so that we cannot extend the profiles very far out in the disk. However, an inspection of the FUV image (at full resolution) clearly reveals two spiral arms extending in the area between equals 1 and 1.5.
The apparent absence of threshold may seem at odds with the figures presented in the appendix, in which an abrupt drop of the UV surface brightness (or SFR surface density) is visible for a few galaxies. This is the case for instance of NGC0891. However, for this galaxy, the UV drop is concomitant with a drop in the gas density, and occurs at quite large radius (35 kpc). Various reasons may affect the gas at large radii (e.g. gravitational interactions, ram-pressure), and obviously no star formation would occur when the gas reservoir was removed. Thus, while abrupt drops exist in the UV for some galaxies, they do not always correspond to a “threshold” of star formation. NGC0925 presents a more interesting case where no UV is detected beyond about 20 kpc, while HI is still observed. Even if this indicates for this galaxy a “UV threshold”, our analysis includes galaxies with detected star formation at similar gas densities. Detailed studies of individual galaxies with high resolution may help to understand the peculiarities of system like this. This kind of analysis is beyond the scope of this paper.
Despite these questions on possible “UV thresholds”, it is clear from figure 7 that beyond the usual threshold radius, we frequently see UV radiation when H ceased to be steadily found. While many reasons for this are possible, including a variation in the initial mass function, the simplest explanation is that at some radius, star formation levels are so low that the number of high-mass (short-lived) ionizing stars visible at any time becomes vanishingly small, while slightly longer-lived stars, emitting in the UV for a correspondingly longer time, are more frequent. If this interpretation is correct, the origin of the threshold of star formation, largely debated on theoretical grounds (Toomre, 1964; Quirk, 1972; Wang & Silk, 1994; Martin & Kennicutt, 2001; Wong & Blitz, 2002; Boissier et al., 2003; Schaye, 2004) on the basis of H observations would be simply the lack of ionizing stars.
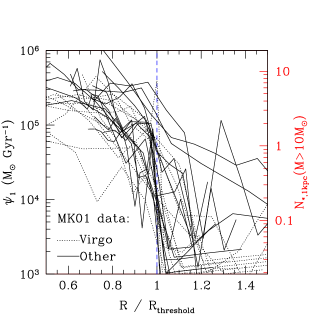
To test further this idea, we took the H profiles of Martin & Kennicutt (2001) around the threshold radius they defined. Since profiles are usually computed within annular ellipses, we converted them to star formation rate integrated whithin 1 kpc wide annular ellipses (that we will call ), what is shown in figure 8. For galaxies at 17 Mpc (distance of the Virgo galaxies, dotted lines), the resolution of 10 arcsec of Martin & Kennicutt (2001) correspond to 0.8 kpc, thus is actually close to the quantity really involved in measurements.
This star formation rate at the threshold curiously shows very low scatter around 4 104 M⊙ Gyr-1. The right axis of Fig. 8 shows in the unit of number of massive stars present at any time within the 1 kpc wide annular ellipse. To compute this number, we integrated the initial mass function (assumed to be a Salpeter function over the range 0.1 and 100 ) above 10 , and assumed a lifetime for these stars (107 yr). Our adopted limit of 10 being conservative, our estimate should be an upper limit. Note that the prediction of the number of O stars using Starburst 99 (Leitherer et al., 1999) with Solar metallicity, and a Salpeter initial mass function between 1 and 100 is very close to the numbers we obtained in that way. Introducing lower mass stars into the initial mass function would reduce this number; thus once again, our number is probably an upper limit to the number of ionizing stars.
From this Figure 8, we conclude that the threshold of star formation found by Martin & Kennicutt (2001) corresponds to the radius where the number of ionizing stars at any given time within 1 kpc wide ellipses becomes lower than about 1. At the position of the threshold, we would expect to find more than one star in only about 19 % of the galaxies of the galaxies of Martin & Kennicutt (2001). For three stars, the percentage drops to about 6 %. It is thus natural that this radius will be the one where we stop finding HII regions, not because of the absence of star formation, but because there is a diminishingly small chance of catching a massive star in our annuli, even with a normal initial mass function.
Although the threshold radius is defined by an abrupt drop in the H surface brightness profile, Martin & Kennicutt (2001) themselves noticed that many galaxies exhibit a few HII regions well beyond this radius, where star formation does seem more stochastic (see also the HII regions found in extreme outer parts of disk galaxies by Ferguson et al., 1998). The presence of resolved young blue B stars in the outskirts of M31 (Cuillandre et al., 2001) also shows that some star formation occurs below the critical gas surface density. Similarly, Davidge (2003) has shown that intermediate age stars are presents at large radii in M33 and NGC2403, suggesting again that star formation has proceeded in the past beyond the current threshold radius. All these facts are totally consistent with our hypothesis that the threshold radius is only marking the last radius where HII regions are found in sufficient numbers to compute an H profile, and not the end of star formation.
This is certainly relevant to the phenomenon of extended UV (XUV hereafter) disks in which UV emission is observed at large radii (and associated with relatively recent star formation) but where H detections are rare (Gil de Paz et al., 2005; Thilker et al., 2005). The situation is however certainly not that simple since XUV disks are themselves not obvious extrapolations of the inner UV profiles. It will, of course, be interesting to compare our results with the relation between gas and star formation rate in XUV galaxies. We plan to start that analysis with the spectacular case of NGC 4625 (Gil de Paz et al., in preparation).
5 Conclusion
Using the galaxies of large angular size culled from the GALEX Atlas of Nearby Galaxies (Gil de Paz et al., 2006), we have compiled GALEX UV and IRAS IR images to compute profiles of attenuation and star formation in 43 galaxies. We find typically that UV attenuation decreases, from a few magnitudes of extinction in the centers of galaxies, to low values at larger radii. Combined with the metallicity gradients observed in those same galaxies, this gives rise to a attenuation-metallicity relationship, quantified in section 3.4. No clear correlation is found between the attenuation and the gas surface density.
Using the attenuation to correct the FUV profiles for dust, we derive star formation rate profiles with which we test several modern expressions of the classical “Schmidt law”. Our data overlap with those of Kennicutt (1998a) but extend to significantly lower gas densities suggesting that the UV light in general traces and reveals lower levels of star formation than H, in coincidence with the recent GALEX discoveries of UV extended (XUV) disks (e.g. Gil de Paz et al., 2005; Thilker et al., 2005). We suggest that the much-debated threshold of star formation might have been an observational selection effect caused by the extremely low number of ionizing stars expected to be found beyond the “threshold” radius. Indeed, for low levels of star formation, the H radiation in one elliptical annuli seems stochastic when the number of massive stars in this annuli becomes close to 1. The UV radiation coming from less massive and more long-lived stars (thus in larger number) does not present a break in its radial profile at the H threshold radius.
While these results are already interesting in their own right, it is obviously time to look to more galaxies, using Spitzer data in combination with GALEX. Spitzer will allow us to include many more galaxies in such studies owing to its better resolution than IRAS. Indeed, a joint analysis of GALEX and Spitzer data is already underway in a SINGS-GALEX collaboration. Note that the SINGS sample will only partially overlap with the one presented here as some of the closest galaxies were not included in SINGS.
Appendix A Appendix: individual profiles
The left panels of Figure 9 shows the profiles of UV attenuation, UV surface brightness (corrected for attenuation and inclination) equivalent to a star formation rate surface density, and of gas surface density used in this work. The right panels show gaseous hydrogen surface densities (HI, H2, HI+H2) vs the star formation rate surface density.
[included in electronic version]
References
- Aumann, Fowler and Melnyk (1990) Aumann, H. H., Fowler, J. W., & Melnyk, M. 1990, AJ, 99, 1674
- Bajaja et al. (1984) Bajaja, E., van der Burg, G., Faber, S. M., Gallagher, J. S., Knapp, G. R., & Shane, W. W. 1984, A&A, 141, 309
- Bajaja et al. (1995) Bajaja, E., Wielebinski, R., Reuter, H.-P., Harnett, J. I., & Hummel, E. 1995, A&AS, 114, 147
- Barnes (2004) Barnes, J. E. 2004, MNRAS, 350, 798
- Bell (2002) Bell, E. F. 2002, ApJ, 577, 150
- Bell et al. (2002) Bell, E. F., Gordon, K. D., Kennicutt, R. C., & Zaritsky, D. 2002, ApJ, 565, 994
- Belley & Roy (1992) Belley, J., & Roy, J.-R. 1992, ApJS, 78, 61
- Begeman (1987) Begeman, K. G. 1987, Ph.D. Thesis,
- Begeman (1989) Begeman, K. G. 1989, A&A, 223, 47
- Bersier et al. (1994) Bersier, D., Blecha, A., Golay, M., & Martinet, L. 1994, A&A, 286, 37
- Bohlin et al. (1978) Bohlin, R. C., Savage, B. D., & Drake, J. F. 1978, ApJ, 224, 132
- Boissier & Prantzos (1999) Boissier, S., & Prantzos, N. 1999, MNRAS, 307, 857
- Boissier & Prantzos (2000) Boissier, S., & Prantzos, N. 2000, MNRAS, 312, 398
- Boissier et al. (2003) Boissier, S., Prantzos, N., Boselli, A., & Gavazzi, G. 2003, MNRAS, 346, 1215
- Boissier et al. (2004) Boissier, S., Boselli, A., Buat, V., Donas, J., & Milliard, B. 2004, A&A, 424, 465
- Boissier et al. (2005) Boissier, S., et al. 2005, ApJ, 619, L83
- Boselli et al. (1995) Boselli, A., Gavazzi, G., Lequeux, J., Buat, V., Casoli, F., Dickey, J., & Donas, J. 1995, A&A, 300, L13
- Boselli et al. (2002) Boselli, A., Lequeux, J., & Gavazzi, G. 2002, A&A, 384, 33
- Boselli et al. (2006) Boselli, A., Boissier, S., Cortese, L., Gil de Paz, A., Seibert, M., Madore, B.F., Buat, V., Martin, D.C., 2006, submitted to ApJ
- Bosma (1978) Bosma, A. 1978, Ph.D. Thesis,
- Bosma (1981) Bosma, A. 1981, AJ, 86, 1791
- Broeils & van Woerden (1994) Broeils, A. H., & van Woerden, H. 1994, A&AS, 107, 129
- Braun et al. (1994) Braun, R., Walterbos, R. A. M., Kennicutt, R. C., & Tacconi, L. J. 1994, ApJ, 420, 558
- Braun (1997) Braun, R. 1997, ApJ, 484, 637
- Buat (1989) Buat, V. 1989a, A&A, 220, 49
- Buat et al. (1989) Buat, V., Deharveng, J. M., & Donas, J. 1989b, A&A, 223, 42
- Buat & Xu (1996) Buat, V., & Xu, C. 1996, A&A, 306, 61
- Buat et al. (2002) Buat, V., Boselli, A., Gavazzi, G., & Bonfanti, C. 2002, A&A, 383, 801
- Buat et al. (2005) Buat et al., 2005 TO CHECK
- Burgarella et al. (2005) Burgarella, D., Buat, V., & Iglesias-Páramo, J. 2005, MNRAS, 360, 1413
- Calzetti et al. (1994) Calzetti, D., Kinney, A. L., & Storchi-Bergmann, T. 1994, ApJ, 429, 582
- Calzetti et al. (2005) Calzetti, D., et al. 2005, ApJ, 633, 871
- Carignan & Puche (1990a) Carignan, C., & Puche, D. 1990, AJ, 100, 394
- Carignan & Puche (1990b) Carignan, C., & Puche, D. 1990, AJ, 100, 641
- Casertano & van Gorkom (1991) Casertano, S., & van Gorkom, J. H. 1991, AJ, 101, 1231
- Cayatte et al. (1994) Cayatte, V., Kotanyi, C., Balkowski, C., & van Gorkom, J. H. 1994, AJ, 107, 1003
- Corbelli (2003) Corbelli, E. 2003, MNRAS, 342, 199
- Cortese et al. (2006) Cortese, L., et al. 2006, ApJ, accepted, astro-ph/0510165
- Cuillandre et al. (2001) Cuillandre, J.-C., Lequeux, J., Allen, R. J., Mellier, Y., & Bertin, E. 2001, ApJ, 554, 190
- Dale et al. (2001) Dale, D. A., Helou, G., Contursi, A., Silbermann, N. A., & Kolhatkar, S. 2001, ApJ, 549, 215
- Dame et al. (1993) Dame, T. M., Koper, E., Israel, F. P., & Thaddeus, P. 1993, ApJ, 418, 730
- Davidge (2003) Davidge, T. J. 2003, AJ, 125, 3046
- Donas et al. (1987) Donas, J., Deharveng, J. M., Laget, M., Milliard, B., & Huguenin, D. 1987, A&A, 180, 12
- Dopita & Ryder (1994) Dopita, M. A., & Ryder, S. D. 1994, ApJ, 430, 163
- Elmegreen (2002) Elmegreen, B. G. 2002, ApJ, 577, 206
- Elmegreen (2005) Elmegreen, G., & Hunter, D., 2006, to appear in ApJ, astro-ph/0509190
- Ferguson et al. (1998) Ferguson, A. M. N., Wyse, R. F. G., Gallagher, J. S., & Hunter, D. A. 1998, ApJ, 506, L19
- Gavazzi et al. (2004) Gavazzi, G., Zaccardo, A., Sanvito, G., Boselli, A., & Bonfanti, C. 2004, A&A, 417, 499
- Gil de Paz et al. (2005) Gil de Paz, A., et al. 2005, ApJ, 627, L29
- Gil de Paz et al. (2006) Gil de Paz et al., 2006, in press. astro-ph/0606440
- Guelin et al. (1993) Guelin, M., Zylka, R., Mezger, P. G., Haslam, C. G. T., Kreysa, E., Lemke, R., & Sievers, A. W. 1993, A&A, 279, L37
- Hatton et al. (2003) Hatton, S., Devriendt, J. E. G., Ninin, S., Bouchet, F. R., Guiderdoni, B., & Vibert, D. 2003, MNRAS, 343, 75
- Heckman et al. (1995) Heckman, T., et al. 1995, ApJ, 452, 549
- Heckman et al. (1998) Heckman, T. M., Robert, C., Leitherer, C., Garnett, D. R., & van der Rydt, F. 1998, ApJ, 503, 646
- Heyer et al. (2004) Heyer, M. H., Corbelli, E., Schneider, S. E., & Young, J. S. 2004, ApJ, 602, 723
- Holwerda et al. (2005a) Holwerda, B. W., Gonzalez, R. A., Allen, R. J., & van der Kruit, P. C. 2005, AJ, 129, 1381
- Holwerda et al. (2005b) Holwerda, B. W., González, R. A., Allen, R. J., & van der Kruit, P. C. 2005, A&A, 444, 101
- Hunter et al. (2001) Hunter, D. A., Elmegreen, B. G., & van Woerden, H. 2001, ApJ, 556, 773
- Jackson et al. (2004) Jackson, D. C., Skillman, E. D., Cannon, J. M., & Côté, S. 2004, AJ, 128, 1219
- Jansen et al. (2000) Jansen, R. A., Fabricant, D., Franx, M., & Caldwell, N. 2000, ApJS, 126, 331
- Kennicutt (1989) Kennicutt, R. C. 1989, ApJ, 344, 685
- Kennicutt (1998a) Kennicutt, R. C. 1998a, ApJ, 498, 541
- Kennicutt (1998b) Kennicutt, R. C. 1998b, ARA&A, 36, 189
- Kennicutt et al. (2003a) Kennicutt, R. C., Bresolin, F., & Garnett, D. R. 2003a, ApJ, 591, 801
- Kennicutt et al. (2003b) Kennicutt, R. C., et al. 2003b, PASP, 115, 928
- Kenney & Young (1988) Kenney, J. D., & Young, J. S. 1988, ApJS, 66, 261
- Kenney et al. (1991) Kenney, J. D. P., Scoville, N. Z., & Wilson, C. D. 1991, ApJ, 366, 432
- Komugi et al. (2005) Komugi, S., Sofue, Y., Nakanishi, H., Onodera, S., & Egusa, F. 2005, PASJ, 57, 733
- Kong et al. (2004) Kong, X., Charlot, S., Brinchmann, J., & Fall, S. M. 2004, MNRAS, 349, 769
- Lake & Skillman (1989) Lake, G., & Skillman, E. D. 1989, AJ, 98, 1274
- Lee et al. (2003) Lee, H., Grebel, E. K., & Hodge, P. W. 2003, A&A, 401, 141
- Lee et al. (2003) Lee, H., McCall, M. L., Kingsburgh, R. L., Ross, R., & Stevenson, C. C. 2003, AJ, 125, 146
- Leitherer et al. (1999) Leitherer, C., et al. 1999, ApJS, 123, 3
- Lia et al. (2002) Lia, C., Portinari, L., & Carraro, G. 2002, MNRAS, 330, 821
- Madore (1977) Madore, B. F. 1977, MNRAS, 178, 1
- Martimbeau et al. (1994) Martimbeau, N., Carignan, C., & Roy, J.-R. 1994, AJ, 107, 543
- Martin & Kennicutt (2001) Martin, C. L., & Kennicutt, R. C. 2001, ApJ, 555, 301
- Masegosa et al. (1991) Masegosa, J., Moles, M., & del Olmo, A. 1991, A&A, 249, 505
- Meurer et al. (1995) Meurer, G. R., Heckman, T. M., Leitherer, C., Kinney, A., Robert, C., & Garnett, D. R. 1995, AJ, 110, 2665
- Meurer et al. (1999) Meurer, G. R., Heckman, T. M., & Calzetti, D. 1999, ApJ, 521, 64
- Morrissey et al. (2005) Morrissey, P., et al. 2005, ApJ, 619, L7
- Mulder & van Driel (1993) Mulder, P. S., & van Driel, W. 1993, A&A, 272, 63
- Newton & Emerson (1977) Newton, K., & Emerson, D. T. 1977, MNRAS, 181, 573
- Nieten et al. (2006) Nieten, C., Neininger, N., Guelin, M., Ungerechts, H., Lucas, R., Berkhuijsen E.m., Beck R., Wielebinski R. 2006, A&A, 453, 459
- Ohnishi (1975) Ohnishi, T. 1975, Progress of Theoretical Physics, 53, 1042
- Ondrechen et al. (1989) Ondrechen, M. P., van der Hulst, J. M., & Hummel, E. 1989, ApJ, 342, 39
- Paglione et al. (2001) Paglione, T. A. D., et al. 2001, ApJS, 135, 183
- Panuzzo et al. (2003) Panuzzo, P., Bressan, A., Granato, G. L., Silva, L., & Danese, L. 2003, A&A, 409, 99
- Pisano et al. (1998) Pisano, D. J., Wilcots, E. M., & Elmegreen, B. G. 1998, AJ, 115, 975
- Popescu et al. (2000) Popescu, C. C., Misiriotis, A., Kylafis, N. D., Tuffs, R. J., & Fischera, J. 2000, A&A, 362, 138
- Prantzos & Aubert (1995) Prantzos, N., & Aubert, O. 1995, A&A, 302, 69
- Puche et al. (1990) Puche, D., Carignan, C., & Bosma, A. 1990, AJ, 100, 1468
- Puche, Carignan & van Gorkom (1991) Puche, D., Carignan, C., & van Gorkom, J. H. 1991, AJ, 101, 456
- Puche, Carignan & Wainscoat (1991) Puche, D., Carignan, C., & Wainscoat, R. J. 1991, AJ, 101, 447
- Quirk (1972) Quirk, W. J. 1972, ApJ, 176, L9
- Rand (1994) Rand, R. J. 1994, A&A, 285, 833
- Regan et al. (2001) Regan, M. W., Thornley, M. D., Helfer, T. T., Sheth, K., Wong, T., Vogel, S. N., Blitz, L., & Bock, D. C.-J. 2001, ApJ, 561, 218
- Rice (1993) Rice, W. 1993, AJ, 105, 67
- Roy et al. (1996) Roy, J.-R., Belley, J., Dutil, Y., & Martin, P. 1996, ApJ, 460, 284
- Sakamoto et al. (1997) Sakamoto, S., Handa, T., Sofue, Y., Honma, M., & Sorai, K. 1997, ApJ, 475, 134
- Sancisi & Allen (1979) Sancisi, R., & Allen, R. J. 1979, A&A, 74, 73
- Schaye (2004) Schaye, J. 2004, ApJ, 609, 667
- Schiminovich et al. (2005) Schiminovich, D., et al. 2005, ApJ, 619, L47
- Schlegel et al. (1998) Schlegel, D. J., Finkbeiner, D. P., & Davis, M. 1998, ApJ, 500, 525
- Schmidt (1959) Schmidt, M. 1959, ApJ, 129, 243
- Seibert et al. (2005) Seibert, M., et al. 2005, ApJ, 619, L55
- Seigar (2005) Seigar, M. S. 2005, MNRAS, 361, L20
- Shostak & van der Kruit (1984) Shostak, G. S., & van der Kruit, P. C. 1984, A&A, 132, 20
- Storchi-Bergmann et al. (1996) Storchi-Bergmann, T., Wilson, A. S., & Baldwin, J. A. 1996, ApJ, 460, 252
- Sofue (1997) Sofue, Y. 1997, PASJ, 49, 17
- Sorai et al. (2000) Sorai, K., Nakai, N., Kuno, N., Nishiyama, K., & Hasegawa, T. 2000, PASJ, 52, 785
- Thilker et al. (2005) Thilker, D. A., et al. 2005, ApJ, 619, L79
- Thilker et al. (2006) Thilker et al., 2006, in preparation
- Toomre (1964) Toomre, A. 1964, ApJ, 139, 1217
- van Driel et al. (1988) van Driel, W., Rots, A. H., & van Woerden, H. 1988, A&A, 204, 39
- van Driel et al. (1995) van Driel, W., Valentijn, E. A., Wesselius, P. R., & Kussendrager, D. 1995, A&A, 298, L4 Van Driel et al. 95 FOR N0660 ;
- van Zee et al. (1998) van Zee, L., Salzer, J. J., Haynes, M. P., O’Donoghue, A. A., & Balonek, T. J. 1998, AJ, 116, 2805
- Vollmer & Beckert (2002) Vollmer, B., & Beckert, T. 2002, A&A, 382, 872
- Wang & Silk (1994) Wang, B., & Silk, J. 1994, ApJ, 427, 759
- Wevers et al. (1986) Wevers, B. M. H. R., van der Kruit, P. C., & Allen, R. J. 1986, A&AS, 66, 505
- Wilding et al. (1993) Wilding, T., Alexander, P., & Green, D. A. 1993, MNRAS, 263, 1075
- Witt & Gordon (2000) Witt, A. N., & Gordon, K. D. 2000, ApJ, 528, 799
- Wong & Blitz (2002) Wong, T., & Blitz, L. 2002, ApJ, 569, 157
- Wyse & Silk (1989) Wyse, R. F. G., & Silk, J. 1989, ApJ, 339, 700
- Young & Scoville (1982) Young, J. S., & Scoville, N. 1982, ApJ, 260, L41
- Young et al. (1983) Young, J. S., Tacconi, L. J., & Scoville, N. Z. 1983, ApJ, 269, 136
- Young et al. (1995) Young, J. S., et al. 1995, ApJS, 98, 219
- Zaritsky et al. (1994) Zaritsky, D., Kennicutt, R. C., & Huchra, J. P. 1994, ApJ, 420, 87
- Zhang et al. (1993) Zhang, X., Wright, M., & Alexander, P. 1993, ApJ, 418, 100