The coronal Ne/O abundance of Centauri††thanks: Based on observations obtained with XMM-Newton, an ESA science mission with instruments and contributions directly funded by ESA Member States and NASA
Recent improvements in the modeling of solar convection and line formation led to downward revisions of the solar photospheric abundances of the lighter elements, which in turn led to changes in the radiative opacity of the solar interior and hence to conflicts with the solar convection zone depth as inferred from helioseismic oscillation frequencies. An increase of the solar Ne/O abundance to values as observed for nearby stars has been proposed as a solution. Because of the absence of strong neon lines in the optical, neon abundances are difficult to measure and the correct solar and stellar Ne/O abundances are currently hotly debated. Based on X-ray spectra obtained with XMM-Newton, we determine a reference value of Ne/O for the inactive, solar-like star Cen (primarily Cen B, which is the dominant component in X-rays), with three independent, line-based methods, using differential emission measure reconstruction and an emission measure-independent method. Our results indicate a value of for / in Cen, approximately twice the value measured for the Sun, but still below the average value obtained for other stars. The low Ne/O abundance of the Sun is peculiar when compared to Cen and other stars; our results emphasize the necessity to obtain more and accurate Ne/O abundance measurements of low activity stars.
Key Words.:
stars: abundances – stars: activity – stars: coronae – X-rays: stars1 Introduction
The canonical values of the solar photospheric elemental abundances have recently become far less canonical. Starting from the work of Anders & Grevesse (1989), a standard reference for many years, the absolute abundance values of the more abundant trace elements like carbon, nitrogen, oxygen, neon, or iron have been significantly reduced over the past decade, initially by Grevesse & Sauval (1998), and again more recently (Asplund et al. 2005, and references therein). These lighter elements considerably influence the physics of the solar interior since they provide a substantial contribution to its radiative opacity. A change in the elemental abundances usually changes the depth of the solar convection zone, which can be inferred from the measured helioseismological oscillation frequencies. With the ”old” abundances by Grevesse & Sauval, good agreement could be found between the standard solar model of the appropriate age and the observed oscillation spectrum, while the ”new” but rather controversial abundances proposed by Asplund et al. and collaborators turned out to be inconsistent with helioseismology (Bahcall et al. 2005a).
In order to rescue the agreement between the standard solar model and helioseismology the opacity reduction by the downward revision of the CNO abundances must be sufficiently compensated by increased abundances of other elements. The only suitable element is neon, since its (photospheric) abundance is not well determined due to the absence of strong photospheric lines; rather, the solar neon abundance is obtained either from solar energetic particles or from coronal measurements in the X-ray or EUV bands. The solar neon abundance is usually quoted relative to oxygen, and the solar Ne/O abundance ratio has remained more or less constant during the course of the revisions of the solar photospheric abundances, with values ranging from 0.14 from the compilation of Anders & Grevesse, 0.18 from Grevesse & Sauval, and 0.15 for the new set from Asplund et al.. An increase of the solar Ne/O abundance by a factor of 2.5–3.5 (Antia & Basu 2005; Bahcall et al. 2005b) would provide sufficient opacity to reconcile the low oxygen abundance with helioseismology. Evidence for an increased neon abundance has been proposed by Drake & Testa (2005) in their survey of the coronal Ne/O abundance in a sample of nearby stars, finding an average value of .
On the other hand, a re-analysis of SOHO CDS spectra and re-investigation of archival solar coronal X-ray spectra confirm the long-established, ”canonical” lower values (Young 2005; Schmelz et al. 2005). Also, a closer look at the sample of stars used by Drake & Testa reveals that most of these stars are RS CVn systems or well-known young and active stars, known to show the inverse FIP effect (Brinkman et al. 2001), i. e., an enhancement of elements with high first ionization potential. Since neon is (apart from helium) the element with the highest FIP and the occurrence of the inverse FIP effect is related to activity (Güdel 2004, and references therein), the sample may be biased to higher neon abundances and not be representative of the ”true” cosmic neon abundance.
In order to settle the issue of a possible bias, a comparison to exclusively low-activity solar-like stars is needed. Due to their low X-ray luminosity, high-resolution X-ray spectra with reasonable signal-to-noise ratio of such inactive stars can be obtained only for very few objects, like Eri, Procyon, or Cen. Additionally, their low coronal temperatures complicate the measurement of the otherwise prominent Ne ix and Ne x He-like and H-like lines that have peak formation temperatures of and respectively; for example, the Chandra LETGS spectra of Cen A and B presented by Raassen et al. (2003)) do not show the Ne x Ly line. Our new XMM RGS spectra of Cen provide good sensitivity and signal-to-noise to detect and measure the relevant H- and He-like lines of O and Ne to allow an accurate determination of its neon-to-oxygen abundance.
2 Observations and data analysis
Centauri is target of an XMM-Newton monitoring campaign of its long-term X-ray behavior. Since March 2003 X-ray observations have been performed regularly at intervals of approximately six months, lasting between 5 and 9 ks each. Results from the first five observations of the program focusing on variability and possible activity cycles of both components have been presented by Robrade et al. (2005). Two additional datasets (ObsIDs 0143630201 and 0202611201) are now available, resulting in 52 ks of accumulated observing time. All seven datasets were reduced with the XMM-Newton Science Analysis System (SAS) software, version 7.0, making use of standard selection and filtering criteria.
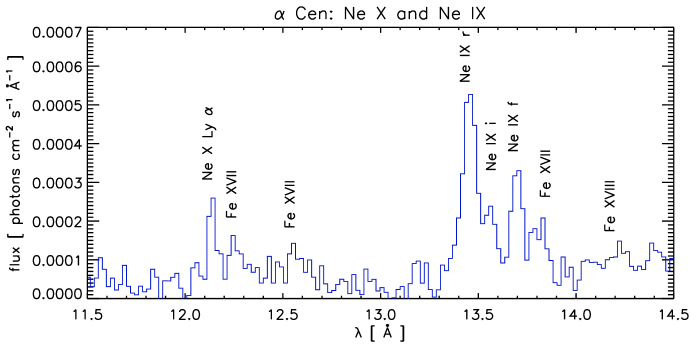
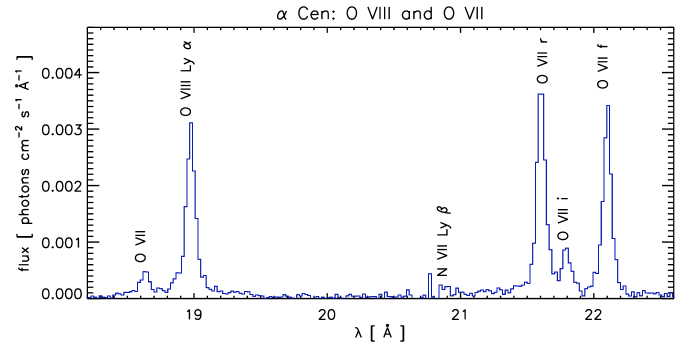
Robrade et al. showed that the K0 V star Cen B is X-ray brighter than the solar twin Cen A (spectral type G2 V) by factors ranging from 3.6 to 75; this applies also to the two latest observations. A spatially resolved spectral analysis of the Cen system is not possible with XMM-Newton; the measured total X-ray flux refers essentially to Cen B (–95%). The following analysis is based solely on the RGS data. We use the SAS task rgscombine to merge the individual RGS exposures to co-added spectra with corresponding response matrices. The resulting combined spectra thus constitute a mixture of Cen A and B (with B by far dominating) and an average over the quiescent and flaring states of Cen B and the long-term variability of Cen A (Robrade et al. 2005). This is not critical for our purposes since we focus on the coronal abundances, which we do not expect to change during Cen’s different states of activity; also, Raassen et al. (2003) showed Cen A and B to have similar abundances, thus we do not anticipate effects from the changing contributions of the two components. In Fig. 1 we plot the relevant portions of the RGS spectrum of Cen that cover the He-like and H-like lines of neon and oxygen. While the O vii and O viii lines are recorded with a very good signal-to-noise ratio, the signal is much lower for Ne ix and Ne x, but the lines are still easily detectable and the Ne ix resonance, intercombination and forbidden lines can be resolved. Using the CORA program (Ness & Wichmann 2002) we measured individual line fluxes in the RGS 1 and 2 spectra in 1st and 2nd order assuming Lorentzian line profiles. Error-weighted means were calculated for further analysis.
3 Abundance determination
3.1 Differential emission measure modeling
From our line flux measurements we proceed to determine the coronal Ne/O ratio of Cen using three different methods. We reconstructed the differential emission measure () from abundance-independent ratios of the H-like Ly and the He-like resonance lines from N, O, and Ne, analogous ratios of H-like Ly and the lines originating from the transition (”He-like Ly ”) of C and O and the weakly temperature-dependent ratio of the Fe xvii lines at 15.01 Å and 16.78 Å. In addition we used continuum flux measurements at wavelengths around 20 Å where the spectrum is essentially line-free for normalization. Our reconstruction method is similar to the one applied by Schmitt & Ness (2004) and makes use of CHIANTI 5.2 line and continuum emissivities (Landi et al. 2006). In a first approach, was modelled as a function of using polynomials of different orders without further constraints; the best-fit is obtained with a 3rd order polynomial (). However, the available line ratios cover only temperatures and abundance-independent line ratios with suitable signal-to-noise for lower temperatures are not available in the RGS spectral range. In a second approach, we model the linear again with polynomials as a function of . Additionally the was forced to have two zeros defining the boundaries of the coronal distribution. Here, the best fit is obtained with a 4th order polynomial (). The resulting distributions are shown in Fig. 2; they agree at higher temperatures, but differ significantly for , indicating the uncertainties due to the poor coverage of lower temperatures. The formation temperatures of the neon and oxygen He-like and H-like lines are however well-determined and there the distributions look quite similar. In Table 1 we compare the observed line ratios with the line ratios ”predicted” by the two methods; the two methods agree quite well except for the Ne x Ly / Ne x r ratio, which is reproduced much better by method 1.

By forcing the distributions obtained with both methods and the corresponding line contribution functions to reproduce the measured line fluxes, we determine the absolute (and relative) abundances of neon and oxygen. The results are listed in Table 2; the relative neon-to-oxygen abundance with method 1 is /, while method 2 yields /. Note that errors are based on count statistics alone, i. e. the smaller error for the first approach results in the better quality of the fit, giving consistent individual abundances for the two neon lines, while they clearly deviate in the second approach.
3.2 Emission measure-independent linear combinations of line fluxes
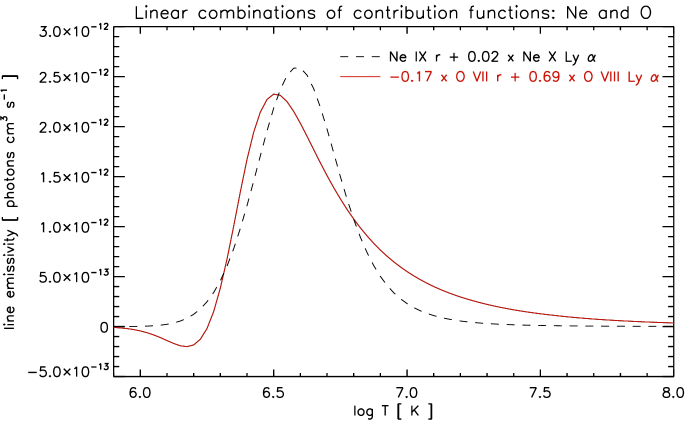
Acton et al. (1975) proposed to determine the solar coronal Ne/O abundance ratio from the ratio of the measured line fluxes of the Ne ix resonance and O viii Ly lines since their contribution functions have similar peak formation temperatures and a similar temperature dependence. This approach thus avoids uncertainties in the abundance determination introduced by the initially unknown underlying temperature structure of the emitting plasma. Acton’s method has been refined by Drake & Testa (2005) by adding a portion of the Ne x Ly flux to reduce the temperature residuals. We further refined this approach by also taking the O vii resonance line into account and calculating optimal linear combinations of the measured fluxes. The coefficients for the linear combinations are obtained from a minimization procedure incorporating the corresponding ratios of the theoretical emissivities of the involved lines from the CHIANTI database. Relative to the Ne ix r line, we obtain scaling factors of 0.02, 0.17, and 0.69 for Ne x Ly , O vii r, and O viii Ly respectively, for the line fluxes and line contribution functions in photon (not energy) units, see also Fig 3. These coefficients give /, in very good agreement with the value obtained with the reconstruction methods.
| line ratio | measured | method 1 | method 2 |
|---|---|---|---|
| N vii Ly / N vi r | 1.40 0.16 | 1.36 | 1.30 |
| O viii Ly / O vii r | 0.79 0.04 | 0.79 | 0.83 |
| Ne x Ly / Ne ix r | 0.48 0.10 | 0.47 | 0.28 |
| C vi Ly / C v | 24.17 10.19 | 25.08 | 19.97 |
| O viii Ly / O vii | 7.64 0.67 | 7.85 | 8.22 |
| Fe xvii 15.01 Å / 16.78 Å | 1.70 0.20 | 1.45 | 1.42 |
| modeling | linear | Asplund | ||
|---|---|---|---|---|
| method 1 | method 2 | combinations | et al. | |
| Ne | — | 7.84 | ||
| O | — | 8.66 | ||
| / | 0.15 | |||
4 Results and discussion
The results of our abundance modeling (cf., Table 2) are very robust and yield values of /, independent of the applied method. This value is twice as large as the ”canonical” / for the solar corona. Cen is probably the most suitable star for a comparison with the Sun avoiding a possible FIP/I-FIP bias. Our of Cen resembles that of the quiet Sun (e. g. Brosius et al. 1996; Landi & Landini 1998), which typically peaks around –6.2. However our values refer to Cen B, which is by far the more active component known to show flaring activity (Schmitt & Liefke 2004; Robrade et al. 2005).
Separate X-ray spectra of Cen A and B are available from a 79 ks Chandra LETGS exposure. However, both spectra have extremely low signal in the wavelength range covering the Ne ix and Ne x lines. Values of / and for Cen A and B respectively were derived from global fitting by Raassen et al. (2003) and are thus based primarily on Ne vii and Ne viii lines located at longer wavelengths. Many of these lines suffer from significant blending as well as low signal and their atomic physics parameters should be considered as more uncertain than those of the H-like and He-like lines. Formally, the Ne/O abundances of Cen A and B are consistent with each other, and the value for the B component is consistent with our XMM-Newton result.
Measurements of the solar Ne/O abundance ratio tend to show a broad scatter (cf. the compilation provided by Drake & Testa (2005) in the supplementary information, with values of / ranging from 0.08 to 0.47), but the majority of them, based on miscellaneous data like solar energetic particles, X-ray or EUV spectra, are in good agreement with the ”low” Ne/O abundances. Additionally, the most recent analyses of Young (2005) and Schmelz et al. (2005), based on the most recent atomic data, clearly support values as low as 0.15.
All stars in the survey of Drake & Testa show higher values of /, incompatible with the ”canonical” low solar value. The inference of the solar Ne/O abundance from other stars is, however, problematic. Apart from the fundamental question of why the Sun should implicitly show the same abundance pattern as other stars do (and many stellar photospheric measurements show that it does not), the most severe problem is to find truly solar-like stars, i. e. relatively old and inactive single stars of similar spectral type. These conditions and the basic requirement that the stars are observable in X-rays (or in the EUV) with a sufficient signal to obtain abundance measurements of neon and oxygen, are almost mutually exclusive since stars with an X-ray luminosity as low as that of the Sun can only be observed in the very solar vicinity with today’s X-ray telescopes. Instead, the typical well-studied stellar coronal X-ray source is much brighter, usually consisting of an active young late-type star or even an RS CVn system. Such objects are not appropriate for a direct comparison with the Sun, especially if one accepts the reality of the inverse FIP effect, i. e. an enhancement of elements with high first ionization potential; while the physics of abundance anomalies like the inverse FIP effect and its counterpart, the FIP effect as observed on the Sun, are not fully understood, a framework to explain both effects has been provided by Laming (2004).
A correlation seems to exist in the sense that the FIP effect turns into the inverse FIP effect, with the inverse FIP effect becoming stronger with increasing activity. Clearly, the sample used by Drake & Testa is then strongly biased. The only star in their sample of truly solar-like activity is Procyon, where a value of 0.42 from Sanz-Forcada et al. (2004) was used, which was obtained from three combined Chandra LETGS spectra but still low signal at the wavelengths of the Ne ix and Ne x lines. For part of these data Raassen et al. (2002) obtained / with a global fitting approach, a value also found by the same authors from 91 ks of XMM RGS and MOS data; thus the correct Ne/O abundance ratio of Procyon remains an open issue.
Moderately active K dwarfs seem to have values of /, i.e, slightly lower than the median obtained by Drake & Testa, but still at approximately twice the level of the Sun as shown by Wood & Linsky (2006), who investigated Ne/O abundance ratios of Eri, 36 Oph and 70 Oph. As pointed out above, our Ne/O value also refers to a K star, Cen B, which is less active than any of the stars studied by Wood & Linsky. Therefore, none of the stars studied so far has a Ne/O abundance as low as observed for the Sun. Therefore, the question remains why the Sun is so special. Or do we first have to find a real solar-like star?
Acknowledgements.
CHIANTI is a collaborative project involving the NRL (USA), RAL (UK), MSSL (UK), the Universities of Florence (Italy) and Cambridge (UK), and George Mason University (USA).CL acknowledges support from DLR under 50OR0105.
References
- Acton et al. (1975) Acton, L. W., Catura, R. C., & Joki, E. G. 1975, ApJ, 195, L93
- Anders & Grevesse (1989) Anders, E. & Grevesse, N. 1989, Geochim. Cosmochim. Acta., 53, 197
- Antia & Basu (2005) Antia, H. M. & Basu, S. 2005, ApJ, 620, L129
- Asplund et al. (2005) Asplund, M., Grevesse, N., & Sauval, A. J. 2005, in ASP Conf. Ser. 336: Cosmic Abundances as Records of Stellar Evolution and Nucleosynthesis, 25–38
- Bahcall et al. (2005a) Bahcall, J. N., Basu, S., Pinsonneault, M., & Serenelli, A. M. 2005a, ApJ, 618, 1049
- Bahcall et al. (2005b) Bahcall, J. N., Basu, S., & Serenelli, A. M. 2005b, ApJ, 631, 1281
- Brinkman et al. (2001) Brinkman, A. C., Behar, E., Güdel, M., et al. 2001, A&A, 365, L324
- Brosius et al. (1996) Brosius, J. W., Davila, J. M., Thomas, R. J., & Monsignori-Fossi, B. C. 1996, ApJS, 106, 143
- Drake & Testa (2005) Drake, J. J. & Testa, P. 2005, Nature, 436, 525
- Güdel (2004) Güdel, M. 2004, A&A Rev., 12, 71
- Grevesse & Sauval (1998) Grevesse, N. & Sauval, A. J. 1998, Space Sci. Rev., 85, 161
- Laming (2004) Laming, J. M. 2004, ApJ, 614, 1063
- Landi et al. (2006) Landi, E., Del Zanna, G., Young, P. R., et al. 2006, ApJS, 162, 261
- Landi & Landini (1998) Landi, E. & Landini, M. 1998, A&A, 340, 265
- Ness & Wichmann (2002) Ness, J.-U. & Wichmann, R. 2002, Astron. Nachr., 323, 129
- Raassen et al. (2002) Raassen, A. J. J., Mewe, R., Audard, M., et al. 2002, A&A, 389, 228
- Raassen et al. (2003) Raassen, A. J. J., Ness, J.-U., Mewe, R., et al. 2003, A&A, 400, 671
- Robrade et al. (2005) Robrade, J., Schmitt, J. H. M. M., & Favata, F. 2005, A&A, 442, 315
- Sanz-Forcada et al. (2004) Sanz-Forcada, J., Favata, F., & Micela, G. 2004, A&A, 416, 281
- Schmelz et al. (2005) Schmelz, J. T., Nasraoui, K., Roames, J. K., Lippner, L. A., & Garst, J. W. 2005, ApJ, 634, L197
- Schmitt & Liefke (2004) Schmitt, J. H. M. M. & Liefke, C. 2004, A&A, 417, 651
- Schmitt & Ness (2004) Schmitt, J. H. M. M. & Ness, J.-U. 2004, A&A, 415, 1099
- Wood & Linsky (2006) Wood, B. E. & Linsky, J. L. 2006, ApJ, 643, 444
- Young (2005) Young, P. R. 2005, A&A, 444, L45