Evolution of the Luminosity Function, Star Formation Rate, Morphology and Size of Star-forming Galaxies Selected at Rest-frame 1500Å and 2800Å
Abstract
Using the multiwavelength photometric and spectroscopic data covering the Chandra Deep Field South obtained within the Great Observatories Origins Deep Survey, we investigate the rest-frame UV properties of galaxies to , including the evolution of the luminosity function, the luminosity density, star formation rate (SFR) and galaxy morphology. We find a significant brightening ( mag) in the rest-frame 2800Å characteristic magnitude () over the redshift range and no evolution at higher redshifts. The rest-frame 2800Å luminosity density shows an increase by a factor over the redshift range investigated. We estimate the star formation rate density to 2.2 from the 1500Å and 2800Å luminosities. When no correction for extinction is made, we find that the star formation rate derived from the 2800Å luminosity density is almost factor two higher than that derived from the 1500Å luminosities. Attributing this difference to differential dust extinction, we find that an E(B–V)=0.20 results in the same extinction corrected star formation rate from both 1500Å and 2800Å luminosities. The extinction corrected SFR is a factor () higher than the uncorrected SFR derived from 1500Å (2800Å) luminosity. We investigate the morphological composition of our sample by fitting Sérsic profiles to the ACS galaxy images at a fixed rest-frame wavelength of 2800Å at . We find that the fraction of apparently bulge-dominated galaxies (Sérsic index ) increases from 10% at to 30% at . At the same time, we note that galaxies get bluer at increasing redshift. This suggests a scenario where an increased fraction of the star formation takes place in bulge-dominated systems at high redshift. This could be the evidence that the present day ellipticals are a result of assembly (i.e., mergers) of galaxies at 1. Finally, we find that galaxy sizes for a luminosity selected sample evolves as between redshifts and . This is consistent with previous measurements and suggests a similar evolution over the redshift range 6.
1 Introduction
Over the last decade, a large number of studies have measured the evolution of cosmic star formation rate (SFR) in the range , using different diagnostics (Steidel et al. 1995; Madau et al. 1996; Chary & Elbaz 2001; Giavalisco et al. 2004a; Schiminovich et al. 2005; Takeuchi et al. 2005; see also Hopkins (2004) for a compilation of the SFR from a large number of multiwavelength surveys). These studies show a rapid increase in the SFR to , beyond which it flattens or turns over. While most studies are in broad agreement on the shape of the SFR, the absolute normalization is still uncertain, mainly due to unknown extinction in the UV to optical bands and systematic effects depending on star formation diagnostic, selection of the star-forming population and the adopted flux limit of the surveys used (e.g., Hopkins & Beacom 2006). A further question in these investigations concerns the morphology of star forming galaxies and how it evolves with redshift. These studies require complete surveys of star forming galaxies with known redshifts, SFRs and morphologies.
Using the high spatial resolution and sensitivity of the Advance Camera for Surveys (ACS) on-board the Hubble Space Telescope (HST), a number of large, multi-waveband and deep surveys have now been completed, with the two deepest being the Great Observatories Origins Deep Survey (GOODS; Giavalisco et al. 2004b) and the Hubble Ultra-Deep Field (HUDF; Beckwith, S. V. W., et al. 2006, in preparation). The combined wavelength coverage, spatial resolution and depth of these surveys allow accurate measurements of the SFR, morphology and size of these galaxies to faint flux levels () and high redshifts ().
Recently, the ultraviolet morphological properties of star forming galaxies in the GOODS and HUDF were explored by a number of investigators. Using WFPC2 observations of the GOODS parallel fields at F300W, de Mello et al. (2006) studied rest-frame UV properties of galaxies to . They found that their sample included all major morphological types, with compact and peculiar morphologies becoming relatively more abundant at higher redshift (). Furthermore, Lotz et al. (2006) studied the UV morphologies of star-forming galaxies in the GOODS-S at and and found no significant differences between the galaxy morphologies at these redshifts. Conselice et al. (2004) used the ACS observations of GOODS-S to identify populations of luminous diffuse objects and luminous asymmetric objects at which they argue are the progenitors of todays normal disk and elliptical galaxies.
Ravindranath et al. (2006) find that among their sample of bright LBGs at , about 40% have light profiles that can be approximated by an exponential profile as seen in disks, while 30% have close to r1/4 profiles as seen spheroids. However, they note that even these galaxies do show clumpy or faint asymmetric features characterestic of tidal interaction or minor merger. The method of Gini coefficients used by Lotz et al. (2006) is more sensitive to merger-like features. Lotz et al. (2006) find that among their sample of LBGs at , 30% have relatively undisturbed spheroid-like morphologies, about 10-25% are major mergers. About 50% are like exponential disks or have minor mergers. Except for small differences arising from the different methods that are employed, the results from Ravindranath et al. (2006) are in good agreement with Lotz et al. (2006).
Finally, the evolution of galaxy sizes has also been investigated using the GOODS and HUDF data sets by Bouwens et al. (2004a, 2004b, 2005) and Ferguson et al. (2004). In this paper, we study UV properties of a complete sample of star-forming galaxies in the GOODS-S at rest-frame 1500Å and 2800Å wavelengths. The investigation includes a study of the evolution of the luminosity function, the luminosity density, the SFR, morphology, and galaxy size. In §2 we describe our data. This is followed by results on the luminosity functions and luminosity densities (§3), the SFR (§4), and morphology and size (§5). We conclude and summarize our results in §6.
Throughout this paper we use , and km s-1 Mpc-1. Magnitudes are in the AB system.
2 The GOODS data
The GOODS South data used here consist of deep wide-field ACS observations in the F435W, F606W, F775W, and F850LP passbands (hereafter and bands) combined with ground-based ESO VLT/ISAAC near-IR , and band observations. The limiting 10 sensitivity for the ACS observations are , , , and (Giavalisco et al. 2004b), while the ISAAC observations have limits , , and (Vandame, B., et al. 2006, in preparation). In this investigation we use a -band selected catalog and adopt a limiting magnitude . We choose a limit mag brighter than the 10 sensitivity to assure that we can reliably determine photometric redshifts and measure morphological parameters for our galaxy sample. The area of the field used here is covered by both ACS and ISAAC and corresponds to 130 square arcmin. Photometry is derived using SExtractor (Bertin & Arnouts 1996). Before deriving photometry, we convolve the space- and ground-based images to a common psf. However, when deriving morphological properties, we use original ’unconvolved’ ACS images.
Besides the ACS+ISAAC photometric catalog, we also produce a solely ground-based catalog including observations in -band (CTIO, 4 m MOSAIC), , , and bands (ESO, 2.2 m WFI), , and band (ESO, NTT SOFI) and the above described ISAAC data. These observations are also centered on the GOODS South area, but the field is significantly wider, in total covering square arcmin, of which about one third is observed in near-IR. The 10 sensitivities are , , , , , , , (Giavalisco et al. 2004b). The limiting magnitude adopted for this -band selected catalog is .
Note that we restrict our investigation to GOODS South and do not include GOODS North due to the shallower near-IR data of the latter, leading to less accurate photometric redshifts at and faint magnitudes.
2.1 Photometric redshifts
Photometric redshifts are calculated using the template fitting method incorporating priors as described in Dahlen et al. (2005). For each object, we derive the photometric redshift, the redshift probability distribution and the best-fitting spectral type. The spectral types cover E, Sbc, Scd and Im templates (Coleman et al. 1980, extended in the UV and near-IR by Bolzonella et al. 2000) and two starburst templates (Kinney et al. 1996).
To test the accuracy of the photometric redshifts, we compare with a sample of 519 spectroscopic redshifts taken from the ESO/GOODS-CDFS spectroscopy master catalogue111http://www.eso.org/science/goods/spectroscopy/CDFS_Mastercat/, which is a compilation of a number of datasets with major contributions from Le Fèvre et al. (2004), Vanzetta et al. (2005) and Mignoli et al. (2005). We find an accuracy =0.08 (where ), after excluding a small fraction (3%) outliers with . Restricting the redshift range to that studied here, , results in a slightly lower outlier fraction (2%). Furthermore, the outliers have distributions in redshift and magnitudes similar to the full redshift sample. The distribution in spectral types somewhat biased towards later types for the outliers, but there are outliers of all SED types. Therefore, we do expect to have a small fraction of outliers and galaxies with uncertain photometric redshifts. However, when deriving e.g., luminosity functions (hereafter LFs) and luminosity densities (LDs), we use a method that incorporates the full photometric redshift probability distribution, instead of a single redshift, in order to minimize the effect of photometric redshift uncertainty. This method is further described in Dahlen et al. (2005).
For a number of objects (312 of total 2976), we replace the photometric redshifts with available spectroscopic redshifts. The spectral types of these objects are calculated using the photometric redshift technique after fixing the redshift to its spectroscopic value.
2.2 Rest-frame 2800Å
One aim of this paper is to investigate the galaxy properties at rest-frame 2800Å. To do this, for each ACS band we identify a redshift range where the filter encompass the rest-frame 2800Å band. This is defined so that at least 25% of the filter’s integrated transmission is short-ward of rest-frame 2800Å (lower redshift limit) and at least 25% is long-ward (upper redshift limit). Resulting redshift ranges are given in Table 1. The redshifts that divide the volume of each bin into two equal halves are , , , and for -, -, - and -bands, respectively. In the following when we derive galaxy morphologies, we use measurements in different bands depending on redshift so that we always are probing the same rest-frame wavelength. By requiring that we observe the same rest-frame wavelength in all bins, we minimize the effects of photometric K-corrections when deriving rest-frame 2800Å luminosities, as well as morphological K-corrections, which may otherwise bias morphological interpretations (e.g., Papovich et al. 2005).
When deriving the LF, we also use the ground-based catalog in order to measure rest-frame 2800Å at lower redshifts than possible with the ACS bands. Using the observed -band, we probe the rest-frame 2800Å at .
2.3 Rest-frame 1500Å
To investigate how the UV derived SFR depends on the choice of rest-frame band, we also calculate the LF at rest-frame 1500Å using the same galaxies as in the 2800Å selected samples. In the two lowest redshift bins ( and ), we do not have any filter that observe sufficiently close to the rest-frame 1500Å and do therefore not include these bins. At , we use the -band, which observes rest-frame 2000Å, and extrapolate to 1500Å using the best-fitting spectral template derived from the photometric redshift fitting. In the two highest redshift bins, , and , we can more directly derive the rest-frame 1500Å luminosity.
3 The UV luminosity functions and luminosity densities
3.1 The 2800Å and 1500Å LFs
We use the -method (Schmidt 1968) to derive the LF. To account for the relatively large errors in the photometric redshifts, we incorporate the redshift probability distribution derived from the photometric redshift method when determining the LF. This procedure is described in detail in Dahlen et al. (2005). After deriving the LF, we fit the usual Schechter function (Schechter 1976) to the data.
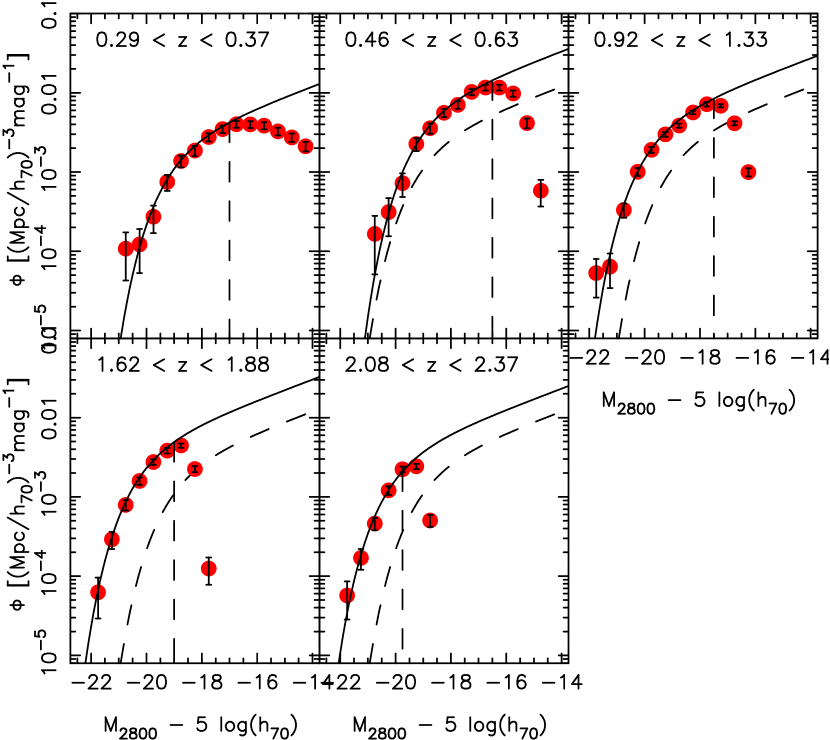
At 2800Å, we determine all the Schechter function parameters (, and ) in the redshift bin at (), which is the bin where we reach the faintest limit in rest-frame 2800Å absolute magnitude. In the remaining bins, we fix the faint-end slope to the value derived in this bin, . The resulting Schechter function parameters are listed in Table 1.
In Figure 1, we show the rest-frame 2800Å LFs in the five redshift bins. The best fitting Schechter functions are shown with solid lines, while the result derived in the lowest redshift bin is shown with dotted lines. Vertical dotted lines represent completeness limits. (When fitting the Schechter function parameters, we only use points brighter that these limits.) The completeness limits are derived by calculating the absolute 2800Å magnitude corresponding to the apparent magnitude limit () for a range of galaxy SEDs from ellipticals to starbursts at the central redshift of each bin. We thereafter choose the brightest of these magnitudes as the limit, ensuring us that we are complete for all considered galaxy types.
The figure clearly shows a strong evolution, where the characteristic magnitude gets brighter at higher redshifts. The total brightening in is mag between and . This is similar to the evolution in found by Wolf et al. (2003) and Gabasch et al. (2004). Between the two highest redshift bins, the evolution is consistent with being flat or slightly fading.
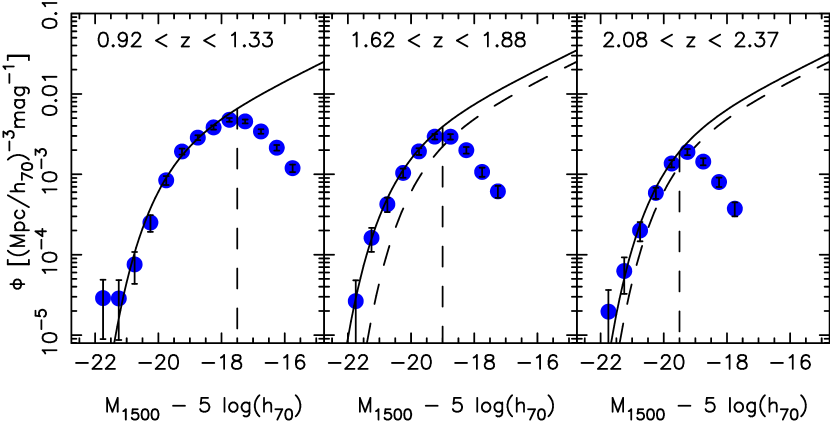
For the 1500Å LFs, we use the redshift bin at to determine the faint-end slope and find . We chose this bin since it directly observes the rest-frame 1500Å (in contrast to the bin which requires extrapolation). After fixing the faint-end slope, we derive the Schechter parameters. Results are given in Table 1 and Figure 2.
Similar to the 2800Å results, the characteristic magnitude at 1500Å shows a brightening with redshift from 1.1 to 1.7, with no significant evolution at higher redshift. Combined with results of Bouwens et al. (2005), who found that brightens by mag between and , we develop a scenario where the characteristic UV magnitude brightens, turns over, and finally fades when going from high to low redshift. Such evolution is consistent with the hierarchical model (e.g., Cole et al. 2004) where the initial brightening at rest-frame UV is due to infall of gas, mergers and merger induced star formation. When the merger rate, and the related star formation, decreases, galaxies start to fade as the reservoirs of cold gas are depleted. The observations suggest a peak in the UV characteristic magnitude at , which we note coincides with the proposed peak in the cosmic SFR, as well as the peak of the merger epoch for the brightest and most massive galaxies (Conselice et al. 2003). In contrast, we note that Gabasch et al. (2004) find a monotonic brightening in the characteristic magnitude at both rest-frame 1500Å and 2800Å to redshift .
3.2 The UV luminosity densities
To derive the UV LD over all magnitudes, we approximate the LF in each bin by the derived Schechter function parameters. The LD is given by
| (1) |
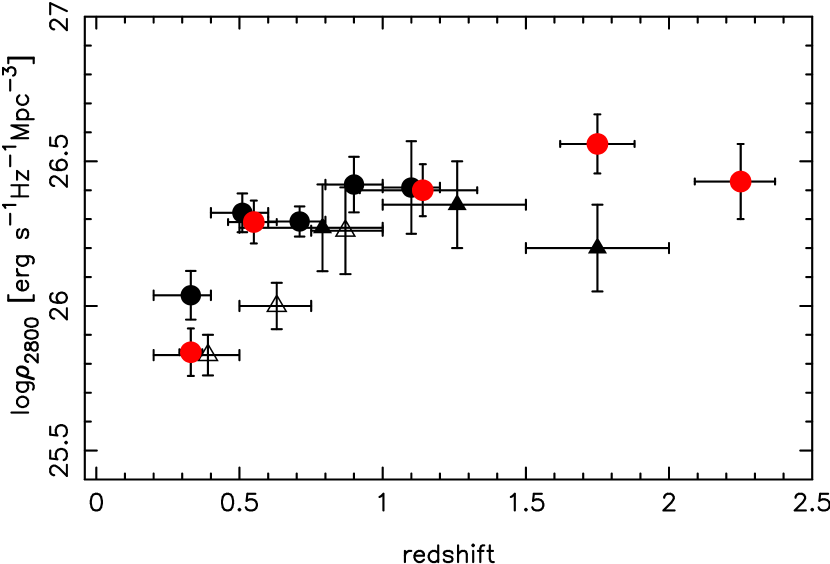
The resulting LDs are listed in Table 1. In Figure 3, we plot the 2800Å LDs as red dots. We note an increase in the LD by a factor between redshift and . At higher redshift, the evolution is consistent with being flat. For comparison, we also plot the LDs from the Canada France Redshift Survey (CFRS; Lilly et al. 1996), HDF-N (Connolly et al. 1997) and COMBO-17 (Wolf et al. 2003). There is in general an excellent agreement at overlapping redshifts between the GOODS and the COMBO-17 results, however, at , we find a somewhat lower value, suggesting a stronger evolution to 1. At 1.5, we find a LD that is a factor 2 higher than the results given in Connolly et al. (1997). We note, however, that part of the difference between results may be due to clustering variance, especially affecting surveys with small areas such as the HDF-N (Connolly et al.) which only covers 5 sq. arcmin. The deviating point from Lilly et al. at 0.6 could also be due to a combination of statistical scatter and clustering variance.
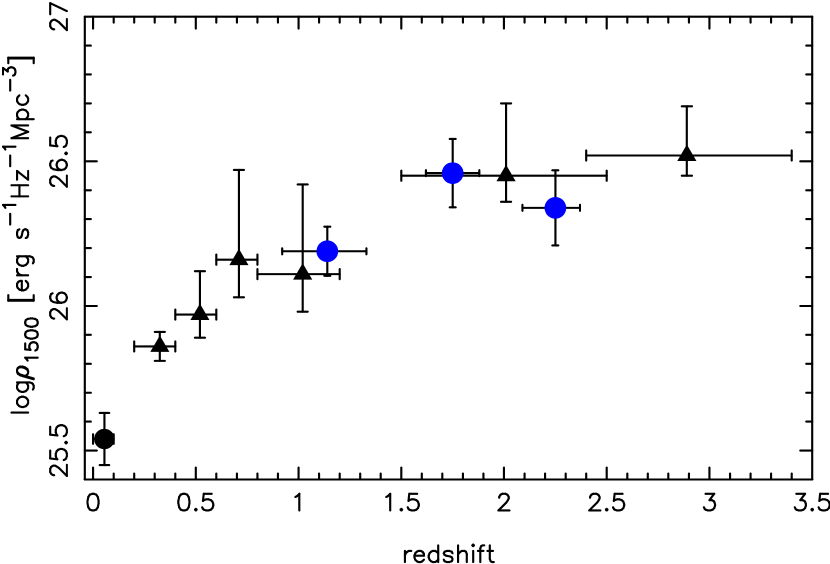
The rest-frame 1500Å LD is plotted in Figure 4 as blue dots. There is a trend showing an increase in the LD between redshifts and . However, our highest redshift point again suggests a flattening in the evolution. In the Figure, we also plot recent measurements from GALEX (Schiminovich et al. 2005; triangles and Wyder et al. 2005; black dot). Together, these measurements depict a scenario where the LD evolves rapidly between and , thereafter the evolution is somewhat less steep and at , the evolution flattens out, or may even turn over.
4 Deriving the SFR from UV luminosity densities
Since the UV luminosity is mainly produced by short-lived O and B stars, it is closely related to the ongoing star formation. Using results from stellar synthesis codes and assumptions on the past star formation history, it is possible to derive a conversion factor relating the UV luminosity and the ongoing SFR. For example, Madau et al. (1998) present relations between the 1500Å and 2800Å luminosities and the SFR assuming an exponentially declining star formation history, SFRexp(t/). They find that the relation is quite insensitive to the past star formation history when varying in the interval 1 to 20 Gyr. We have examined the results in Madau et al. and confirm that at 1500Å, the relation holds and is independent from the star formation history while at 2800Å, the conversion factor varies by 30% depending on . The larger spread at 2800Å is due to the fact that more long-lived A and F stars are significant contributors here in addition to O and B stars.
To investigate the relation between luminosity density, ongoing star formation and star formation history averaged over an ensemble of galaxies, we use two different models. In the first, we assume a constant SFR(). This should be approximately true at where we know from independent measurements (e.g., Giavalisco et al. 2004a) that the star formation rate is consistent with being flat. As our second model, we use the fit to a number of SFR measurements presented in Giavalisco et al. and parameterized in Strolger et al. (2004),
| (2) |
where is the age of the universe (in Gyr), =13.47 Gyr, =0.021, =2.12, =1.69, and =0.207. In both models, we assume an onset of the star formation at , the results are, however, not sensitive to the exact choice of this redshift. Also, the conversion factor is only dependent on the shape of the SFR history and not the absolute normalization (i.e., parameter is arbitrary in the equation above). This also means that results are independent of any constant amount of dust extinction. Input are also GALEXEV stellar population synthesis models (Bruzual & Charlot 2003), giving the age luminosity evolution for a simple stellar population (SSP) at different UV luminosities. For these models, we assume solar metallicity and two different IMFs, a standard Salpeter IMF (Salpeter 1955) and a Chabrier IMF (Chabrier 2003). The relation between ongoing SFR and UV luminosity is finally derived by convolving the SSP results with the SFR history
| (3) |
where is the flux at time after an instantaneous burst of the SSP and is the age of the universe at . The conversion factor can thereafter be used to calculate the ongoing SFR from the observed UV luminosity density using
| (4) |
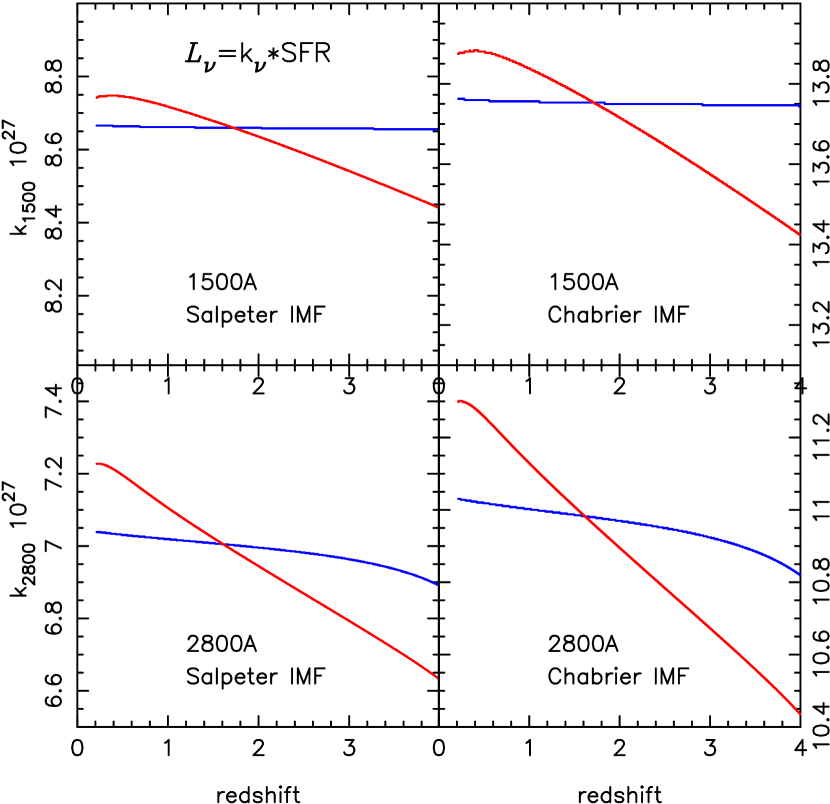
In Figure 5, we show the resulting conversion factors between UV luminosity and ongoing SFR at rest-frame wavelengths 1500Å and 2800Å. Note that we at this stage do not include any corrections for dust extinction. For the constant SFR scenario (blue lines in Figure 5), we find that the conversion factor is close to independent of redshift. This is expected since we in this case expect that the fraction of the UV luminosity coming from ongoing star formation remains constant. At 2800Å, however, there is a slight increase in with time due to the build-up of old stars with residual 2800Å luminosity. For the more realistic SFR history (red lines in Figure 5), we note a clear, albeit small, redshift dependence on the relation between UV luminosity and ongoing SFR.
At 1500Å, the conversion factor increases by % between and (similar for both IMFs). The evolution is, as expected, stronger at 2800Å, where we note an increase by 6% over the the same redshift range. As a consistency check, we calculate what fraction of the observed 2800Å luminosity density comes from galaxies that are best-fitted by an early-type SED, i.e., representing non-star forming galaxies. We do this by fitting a Schechter function to early-type population separately in the two lowest redshift bins. We find that % of the luminosity density comes from this population, consistent with the theoretical predictions. At higher redshift, the statistics are too poor to allow a fit to the early-type population separately.
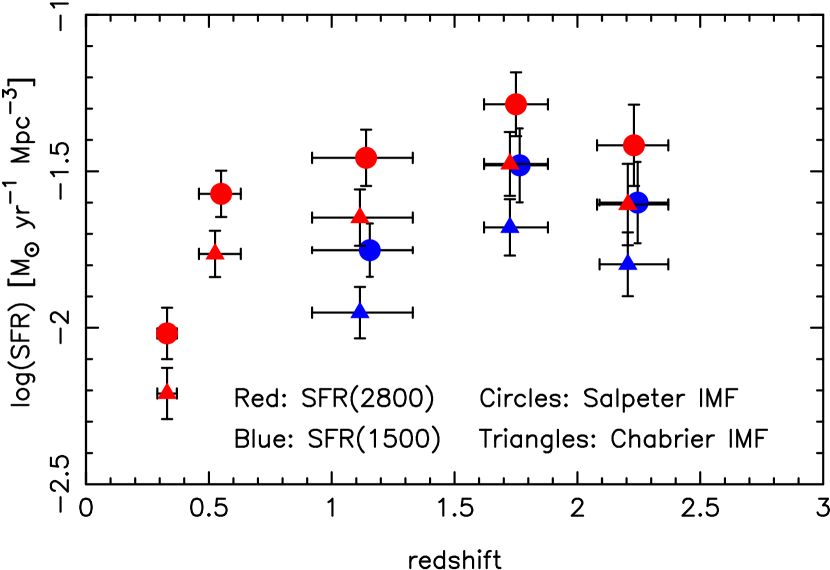
We use the conversion factors derived from the realistic SFR history to derive the ongoing SFR for the GOODS dataset. Results are shown in Figure 6. For both IMFs, we find that the SFR derived from the 2800Å luminosity is a factor higher compared to the SFR derived from the 1500Å luminosity. Since we have accounted for the fraction of the 2800Å luminosity that comes from a ’non-star forming’ population, the remaining discrepancy should have other causes. First, an IMF with a different slope at high masses compared to the standard Salpeter IMF and Chabrier IMF, could change the relation between UV luminosities and SFR, and therefore explain some of the difference. Second, it is expected that a large fraction of the UV luminosity is obscured by dust extinction. Since the extinction is more severe at shorter wave-lengths, this could explain the difference in the SFRs derived from 1500Å and 2800Å luminosities.
Assuming a Calzetti attenuation law (Calzetti et al. 2000) and a Salpeter IMF, we fit the amount of dust needed to bring the SFRs from 1500Å and 2800Å to agreement and find that a mean E(B–V)=0.20. This is equivalent to an extinction corrected SFR a factor higher at 1500Å and a factor higher at 2800Å, compared to the uncorrected SFRs.
The extinction correction we find here is higher compared to the median E(B–V)=0.15 found by Shapley et al. (2001), who derive the extinction from optical and near IR photometry of a set of Lyman break galaxies (also assuming a Calzetti attenuation law and a Salpeter IMF). However, the Shapley et al. (2001) results are based on Bruzual & Charlot (1996) models. Using the more recent models in Bruzual & Charlot (2003) results in a median E(B–V)=0.20 for the same galaxy sample (Shapley, private communication), which is consistent with what found here.
The correction at 1500Å is somewhat larger than the factor derived from the GALEX data by Schiminovich et al. (2005). Our results suggest that the extinction corrected SFR is up to higher than previously derived extinction corrected rates based on UV luminosities, e.g., Giavalisco et al. (2004a).
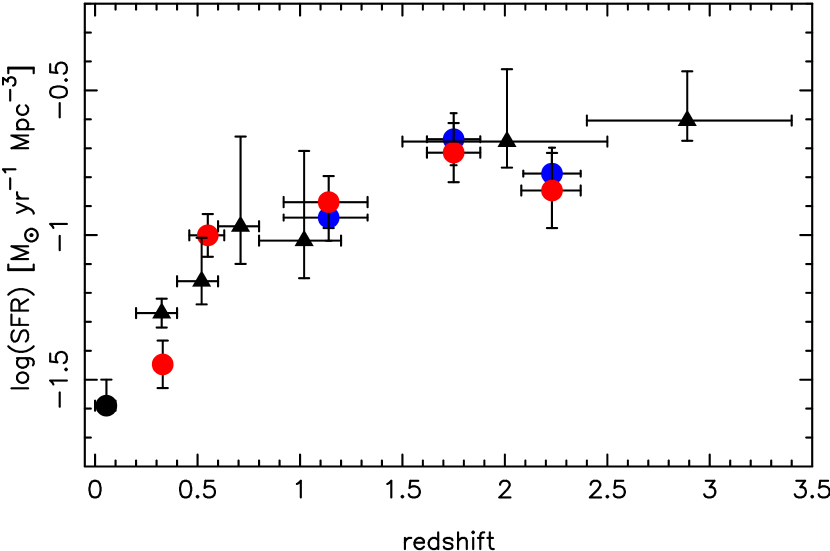
In Figure 7, we show the extinction corrected SFRs derived from both the 1500Å and 2800Å luminosity densities. For the two lowest redshift bins, we derive the SFR from the 2800Å luminosity density assuming the same extinction correction as derived from the results at . Our results support a steep increase in the SFR between and . Compared to the local measurement by Wyder et al. (2005), we find an increase in the SFR by at least a factor between and . At redshifts , there is a mild increase in the SFR, however, we can not exclude a flat rate over the range .
In the Figure, we also plot SFRs based on 1500Å luminosity densities from Schiminovich et al. (2005; triangles). We have used the corrections derived here to calculate the SFRs from the LDs. We note that the agreement is good, and only for the lowest redshift point in the GOODS sample is the deviation outside the one sigma error bars.
5 Morphology of star forming population
5.1 Determining galaxy morphologies
We use GALFIT (Peng et al. 2002) to determine the morphology at rest-frame 2800Å for the objects in the ACS bands. We use unconvolved images when deriving morphological catalogs. These are thereafter matched to the photometric catalogs (based on convolved images). We do not include the ground-based -band data in the morphological investigation (i.e., the redshift bin) due to the lower resolution and broader psf in this band. The light distribution of each object is fit with a Sérsic (1968) radial profile
| (5) |
where is the Sérsic index, is defined as =(20.331), is the effective radius containing half of the total galaxy light and is the surface brightness at . In the fitting we use a psf derived from stars in the field. A pure exponential profile has , while a de Vaucouleurs profile has . We adopt a division between “disk”-objects with , and “bulge”-objects with , which is the same criterion as used by e.g., Barden et al. (2005) and Ravindranath et al. (2006). Bulge objects should mostly consist of ellipticals, while disk objects are foremost spirals and irregulars. We note, however, that at high redshifts and short rest-frame wavelengths, we do not expect the galaxy population to follow the Hubble sequence as well as the case is locally.
In order to derive Sérsic index and galaxy radius it is necessary that a major fraction of the galaxy luminosity comes from a main source for which a center can be well defined. When going to higher redshifts, and in particular in rest-frame UV, it is expected that galaxy morphology becomes more disturbed with the possibility of multiple peaks in the light distribution. This could affect the measured properties, making it difficult to interpret e.g., Sérsic index and galaxy size. In order to investigate the galaxies included in this investigation, we visually inspected representative samples of galaxies in all redshift bins, including both “disk”- and “bulge”-objects. We find that “bulge”-objects in all bins are well represented by symmetric and single peaked objects. At all redshifts, “disk”-objects are, as expected, more irregular in shape. However, we find that the sample we select is clearly dominated by galaxies with a main luminous component for which a center can be defined. Therefore, we trust that the Sérsic index and galaxy radius derived reflects the morphological properties of the galaxies.
The reason for the relatively well behaved morphologies of these galaxies can be attributed to the selection, where we only include intrinsically bright objects. For these, we do not expect that star forming lumps or trails of tidal interactions affect the overall morphology more than marginally in most cases. For fainter objects, the situation should be different where secondary star forming regions can cause multiple peaks with similar luminosity. Although we can calculate Sérsic index also for these objects, we do not include them in our investigation since the interpretation of these is more uncertain.
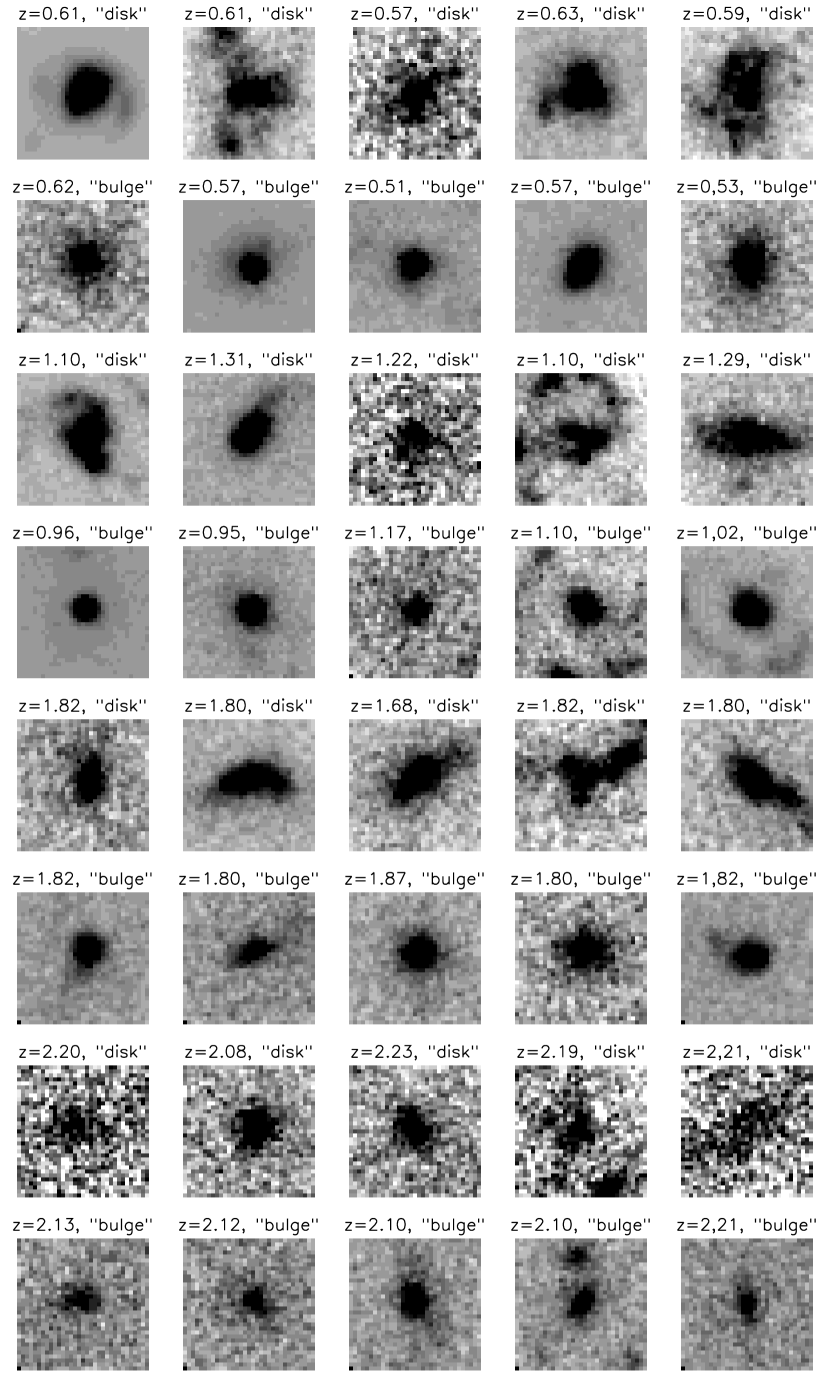
In Figure 8, we show representitative samples of “disk”- and “bulge”-objects in each redshift bin. We have chosen these randomly among galaxies brighter than (described below). For the “bulge”-objects, the selected galaxies represent 100%, 12%, 9%, and 24% of the full sample in the four redshift bins, respectively (from low to high redshift). For “disk”-objects, the corresponding fractions are 10%, 3%, 2%, and 17%, respectively. As discussed above, the figure shows that the “bulge”-objects are more symmetric and mostly consist of a single central object while “disk”-objects are more irregular in shape.
To compare the same population in each band, we use an absolute magnitude cutoff that is related to the characteristic magnitude in each band; where is derived from the completeness limit in the highest redshift bin, –19.75. We find , i.e., in each band we select galaxies with . The completeness in determining the Sérsic index for galaxies brighter than the magnitude limit is 80%, 94%, 94% and 93% in the , , and -bands, respectively. There are two reasons for the incompleteness. First, since Sérsic indexes are derived using the unconvolved images, while photometry is derived using convolved, there are cases where objects do not match between catalogs. This is because multiple nearby objects in the unconvolved image may be merged into a single object in the convolved image. For these objects we do not assign a Sérsic index. About 75% of the objects without determined Sérsic index belong to this group. Second, for the remaining 25%, the Sérsic fitting algorithm did not converge, mainly due to the faintness of the objects.
5.2 Relation between morphology and spectral type
Besides deriving the morphological characteristics of the galaxy sample using the Sérsic index, we also derive the spectral type describing the overall shape of the galaxy SED. Spectral types are given by the best fitting template SED derived from the photometric redshift fitting. We number spectral types 1-5, with E=1, Sbc=2, Scd=3, Im=4 and starburst=5 (for both starburst templates used). We also include intermediate types which are interpolations between subsequent templates. We divide the galaxies into two spectral types: early-type galaxies (dominated by E spectrum, type 1.5) and late-type galaxies (type 1.5).
Using our full data set, we calculate the median Sérsic index for the early-type and late-type populations. We find that the early-type population has a high median Sérsic index, , indicating that galaxies with early-type spectra are bulge dominated. The median Sérsic index for the late-type population is , consistent with a disk-dominated (spiral) galaxy.
If we assume that the Sérsic index in general follows the spectral type of the galaxy, we can use this assumption to correct for the incompleteness in derived Sérsic indexes described in §5.1. We do this by placing galaxies with early-type spectra in the high Sérsic sample (), while later type galaxies are placed in the low Sérsic sample (). Note, however, that there is a large dispersion in the correlation between galaxy spectral and morphological type, and we find that of the late-type galaxies have high Sérsic indexes (), suggesting that they are bulge dominated, and that a similar fraction of the early-type galaxies have low Sérsic index.
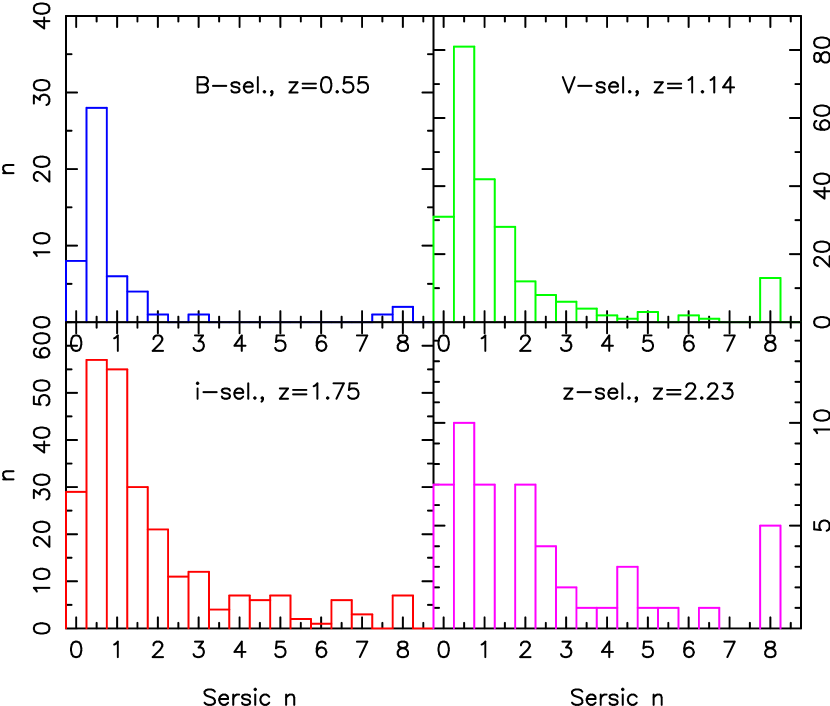
5.3 Distribution of morphological types
In Figure 9, we show the distribution of Sérsic indexes in each redshift bin for galaxies brighter than the limit . The figure shows that the rest-frame 2800Å morphology is dominated by low Sérsic indexes, i.e., “shallow” disk dominated or irregular systems. This is natural since star formation is expected to occur in these systems. If we calculate the fraction of galaxies that are bulge dominated (), we find that 8%, 15%, 24% and 31% of the galaxies belong to this group at , , , , respectively. This suggests that the fraction of bulge dominated systems (in rest-frame 2800Å) increases with redshift.
To investigate the effect on results due to incompleteness in determined Sérsic indexes, we assign a high Sérsic index () to early-type galaxies and a low Sérsic index () to late-type galaxies, as discussed in §5.2. After making the correction, we find that 9%, 14%, 22%, and 29% of the galaxies have high Sérsic indexes, in the four bins, respectively. The trend in the evolution remains, suggesting that the incompleteness only marginally affects results.
We have also examined if there is a bias in the derived Sérsic indexes as the mean apparent magnitude of the galaxies gets fainter at higher redshift. We investigate this by adding simulated galaxies with known radial profiles (exponential and de Vaucouleurs) spanning a range of magnitudes and radii to the real ACS -band image using the IRAF task MKOBJECTS. We thereafter run GALFIT and determine the fraction of the galaxies for which we correctly recover the input profile. At magnitudes , we find that % of both galaxy types have correctly determined profiles. At the faintest magnitudes included in this investigation , we find that 95% of the input exponential profiles are recovered as disk galaxies, while 88% of the de Vaucouleurs profiles are correctly assigned a bulge profile. We therefore conclude that the magnitude bias when determining Sérsic index should not be severe.
Next, we investigate how the relation between morphological and spectral types evolves with redshift. Deriving the median Sérsic index in the four redshift bins we find =0.49, 0.76, 1.27, and 1.34 at 0.55, 1.14, 1.75, and 2.23, respectively. This is consistent with the general trend found above showing that the fraction of high Sérsic index objects increases with redshift. Calculating the median spectral type in the four bins, we find type=3.3, 3.7, 5.0, and 5.0, respectively. Overall, this shows that the galaxy population producing the 2800Å luminosity mainly consists of galaxies with late-type SEDs which get bluer at higher redshift. This is contrary to the overall correlation between types where later spectral types in general have lower Sérsic indexes. Our result that the Sérsic index increases with redshift, while the galaxies at the same time get bluer, again suggests that a larger fraction of the star formation at high redshift occurs in more concentrated bulge-dominated objects compared to low redshifts.
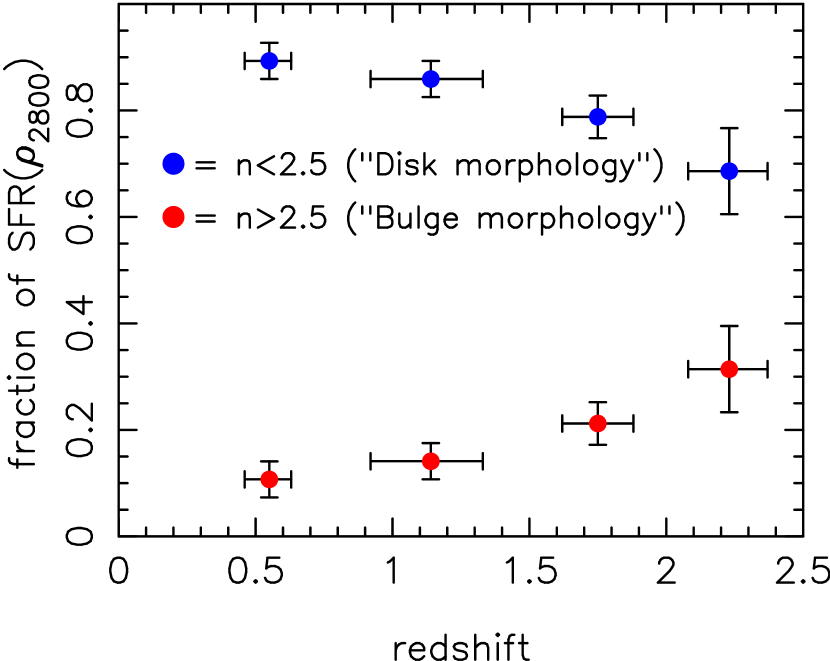
So far, we have investigated the fraction of the number of galaxies belonging to the different morphological types. We now estimate the fraction of the rest-frame 2800Å luminosity emitted by disk- and bulge-dominated systems. We do this by summing the emitted flux in each redshift bin and thereafter determining what fraction comes from bulge systems. Using the magnitude limit , we find fractions 0.11, 0.14, 0.21 and 0.31, of the luminosity is emitted in bulge () systems at , , , and , respectively. These results are plotted in Figure 10. The trend we find is inconsistent with a flat non-evolution scenario at a level. Note that we do not extrapolate the LF to faint magnitudes. If the faint-end slopes of the disk and bulge population differ, or evolve differentially with time, then conclusions could be different at the faint end.
Similar results, showing an increased fraction of the SFR occurring in spheroids/ellipticals to , are presented by Menanteau et al. (2006), who find that the fraction of the SFR occurring in ellipticals at rest-frame is at and at . At higher redshift (), the fraction decreases in Menanteau et al., in contrast to the continuous increase suggested in this investigation.
At lower redshifts, Lauger et al. (2005) find a steep increase in the number of faint blue bulge-dominated galaxies between and in rest-frame band. The emergence of this population could be related to the morphological evolution at higher redshifts seen in this investigation.
Conselice et al. (2005) investigate the relation between rest-frame -band morphology and star formation in the HDF-N. They find that star formation is higher in more massive and early-type galaxies at compared to lower redshift. This is consistent with what is found in our investigation. Our results are also in agreement with the result of Menanteau et al. (2001), who use data with mag from the Hubble Deep Fields N and S and find that a significant fraction () of intermediate redshift () spheroids/ellipticals have blue colors.
Furthermore, Lotz et al. (2006) find a fraction 30% spheroids at and 15% spheroids at . This is consistent with the trend found in this investigation showing a decrease in spheroid fraction at lower redshifts. The fractions found are also reasonably consistent with the numbers we find. Note, however, that Lotz et al. measure spheroid fraction at a different rest-frame (FUV, ) and use a different method for defining spheroids, we could therefore expect some differences.
Most of the stellar mass in ellipticals is expected to have assembled by 1 (Bundy et al. 2005). The increased fraction SFR in bulge systems at higher redshifts we observe could therefore be the sign of the build up of ellipticals at , and the subsequent decrease in SFR reflects a more passive evolution at . This is similar to the scenario Menanteau et al. (2001) suggest where the blue galaxies they observe at 1 are old elliptical systems undergoing recent star formation induced by mergers or inflow of material. However, we can not exclude that some part of the bulge systems we observe at high redshift may evolve to the bulges of todays population of old giant spirals.
To summarize, we find an increasing fraction of galaxies at higher redshifts to be bulge-dominated in the rest-frame 2800Å. This suggests that a significant amount of star formation occurs in these objects at high redshift. At least part of the increase in SFR should be due to the build up of todays ellipticals by infall or mergers at 1.
5.4 Size-redshift relation at 2800Å
Simple scaling models for the expected redshift evolution of galaxy sizes in the hierarchical model is presented by e.g., Fall & Efstathiou (1980), Mo et al. (1998) and Bouwens & Silk (2002). The scale length of a spiral galaxy, , is assumed to be proportional to the virial radius, and therefore related to the virial mass via
| (6) |
where
| (7) |
and is the circular velocity at . For fixed circular velocity, we therefore expect , while for fixed mass we expect . In the case of a sample with fixed rest-frame luminosity, the behavior depends on the evolution of the mass-to-light ratio and is expected to be intermediate between these relations (Bouwens & Silk 2002; Ferguson et al. 2004).
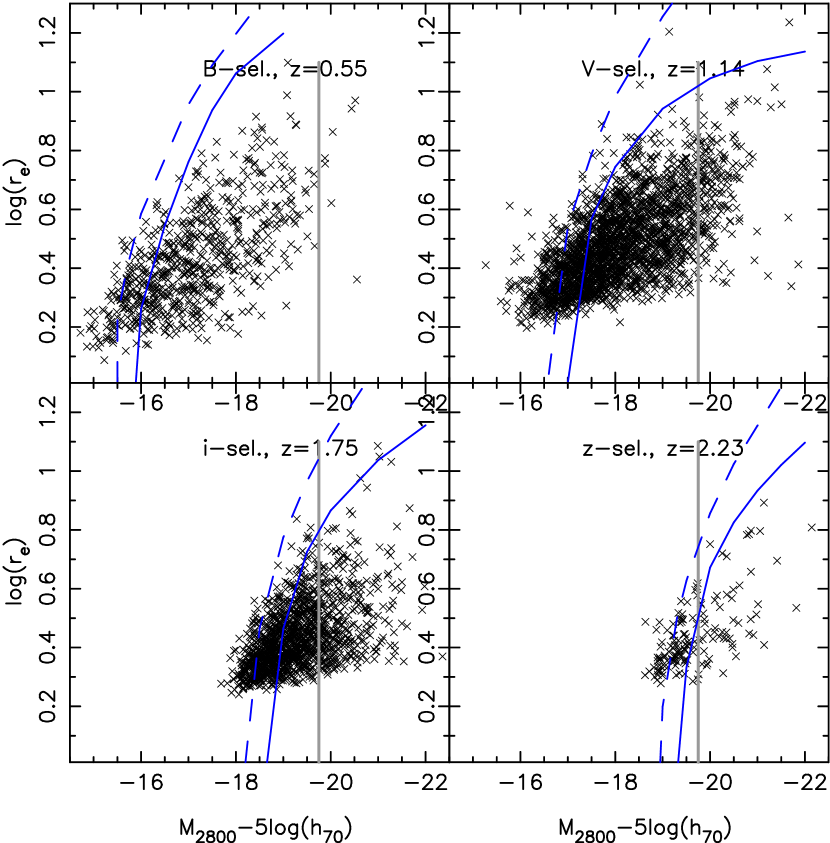
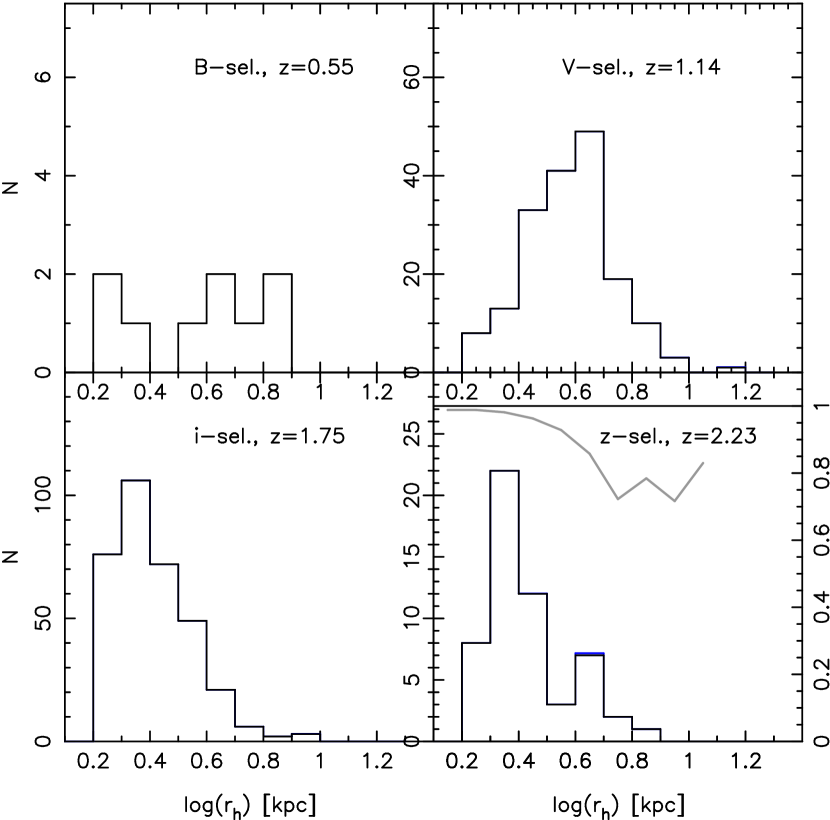
When investigating the size evolution, we want to compare galaxies within the same range of e.g., absolute magnitudes or masses (compared to the above investigation where we examine the brightest population in each bin). We investigate the completeness in each bin by adding simulated galaxies to the real images. The simulated galaxies span a wide range of absolute magnitude and size (i.e., surface brightness). In Figure 11, we plot the half-light radius (, as measured by SExtractor) at rest-frame 2800Å of the observed galaxies as a function of absolute magnitude. We only include galaxies with disk morphology () since equation (4) implies the formation of a spiral galaxy. Over-plotted are the 50% (dashed lines) and 99% (solid lines) completeness limits derived from the simulations. The gray line shows the adopted magnitude limit, . In Figure 12, we plot the distribution of radii for galaxies brighter than this limit.
There are only a few objects brighter than our magnitude limit that fall within the area where we expect a completeness between 50% and 99% (Figure 11). This indicates that we are not severely affected by incompleteness and should not be missing more than a few objects at the most. As a further test, we have taken the galaxies detected -band ( redshift bin) and redshifted their properties (luminosity, size), including effects of surface brightness dimming. We thereafter randomly distribute this population on the and band images and run SExtractor to derive the fraction of recovered galaxies. In the third redshift bin, , we recover 99% of the redshifted galaxies, with no dependence on the size of the galaxies. In the highest redshift bin, , the overall recovered fraction is 89%, with with a size dependence suggesting that we detect 75% of galaxies with log(rh) and 92% of galaxies with log(rh). These results also suggest that we are not severely affected by incompleteness in our high redshift galaxy samples. The completeness in the highest redshift bin, derived from these simulations, is shown with the gray line in Figure 12. Note that we do not take into account any size-redshift relation (i.e., eq. [4]), when redshifting our objects from low to high redshift bins. If this relation exists, we will be even more complete.
We use the results from our simulations to account for the incompleteness by weighting objects within the area between to 50% and 99% lines by the inverse of the completeness at the particular point in the absolute magnitude-radius diagram. We further note that only a few galaxies survive the selection in the lowest redshift bin. This is due to the general fading of the galaxy population at lower redshift and the small volume of the lowest bin. We keep this bin in our investigation, but note that due to the low statistics (large statistical errors), our results regarding redshift evolution of the galaxy properties do not change whether we include this bin or not.
As a consistency check on the selected galaxy samples, we calculate the median absolute magnitude and find in the three highest redshift bins, while the low redshift bin has a median magnitude . This reassures us that we are comparing samples with similar magnitudes.
5.4.1 Size-redshift relation at fixed luminosity
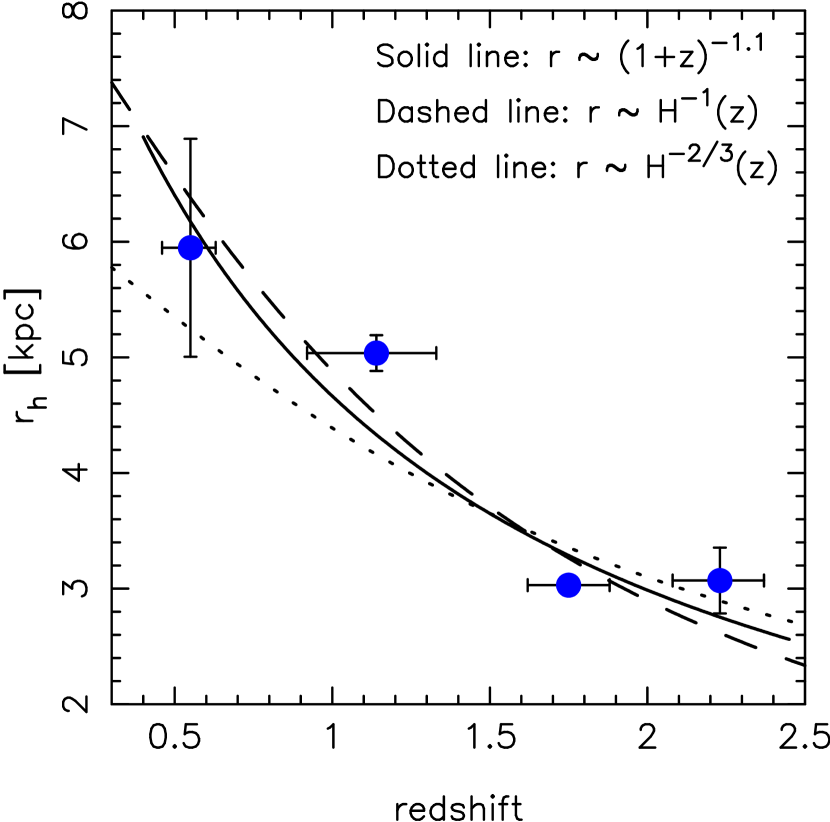
Figure 13 shows the size redshift relation for our magnitude selected galaxy sample. In each bin we plot the median radius in kpc for our adopted cosmology. Over-plotted are the theoretical curves representing the cases where galaxy sizes evolve as and . Following the approach in e.g., Bouwens et al. (2004b), we fit our data to the functional form , and find between (including the point do not change the derived value of ).
If we use the and parameterizations and fit the curves to functional form over the redshift range to , we get and , respectively. This indicates that the evolution we find is somewhat steeper than expected for a mass selected sample. A possible explanation is that the stellar mass-to-light ratio decreases at higher redshift. Such scenario is expected as the SFR in individual galaxies increases at higher redshift. A manifestation of this is the observed brightening of .
Compared to previous investigations, our results agree well with the evolution found by Bouwens et al. (2005) between redshifts and for a large sample dropout galaxies. Even though Bouwens et al. measure the evolution at a shorter rest-frame wavelength (Å) and include all galaxy morphologies, these results suggest that the size-redshift correlation continues to . Ferguson et al. (2004) investigate the evolution at rest-frame 1500Å and find an evolution, , over the redshift range , which is equivalent with . This is somewhat steeper than found here, with both investigations consistent with the relation.
There are also investigations of the size redshift relation at optical wavelengths. In rest-frame band, Papovich et al. (2005) find between and . While in rest-frame V-band, Trujillo et al. (2005) find an evolution at and over a larger redshift interval for galaxies with disk morphology ().
In combination, these results suggest a similar size-redshift evolution over the redshift range which is consistent with and, as noted by Trujillo et al. (2005), that the relation is similar at visual and UV rest-frame wavelengths.
5.4.2 Size-redshift relation at fixed mass
Next we investigate the evolution of the size-redshift evolution at a fixed mass scale. We use the relation between mass and rest-frame magnitude and color given in Bell et al. (2003) to determine masses. Rest-frame magnitudes and colors are calculated using the observed bands that are closest to the redshifted rest-frame and -bands, respectively, in combination with K-corrections calculated from the best-fitting template SED for each individual galaxy. More details on this procedure are given in Dahlen et al. (2005). Derived masses are calculated for a Kroupa (2001) IMF (a Salpeter (1955) IMF gives masses two times higher (Kauffman et al. 2003)).
We stress that this is not directly a mass selected sample since it is based on photometry. Derived masses are subjected to uncertainties and scatter in these relations. This may be especially severe for this investigation since we are using the very bluest galaxy population where the relation between mass in luminosity has a large dispersion.
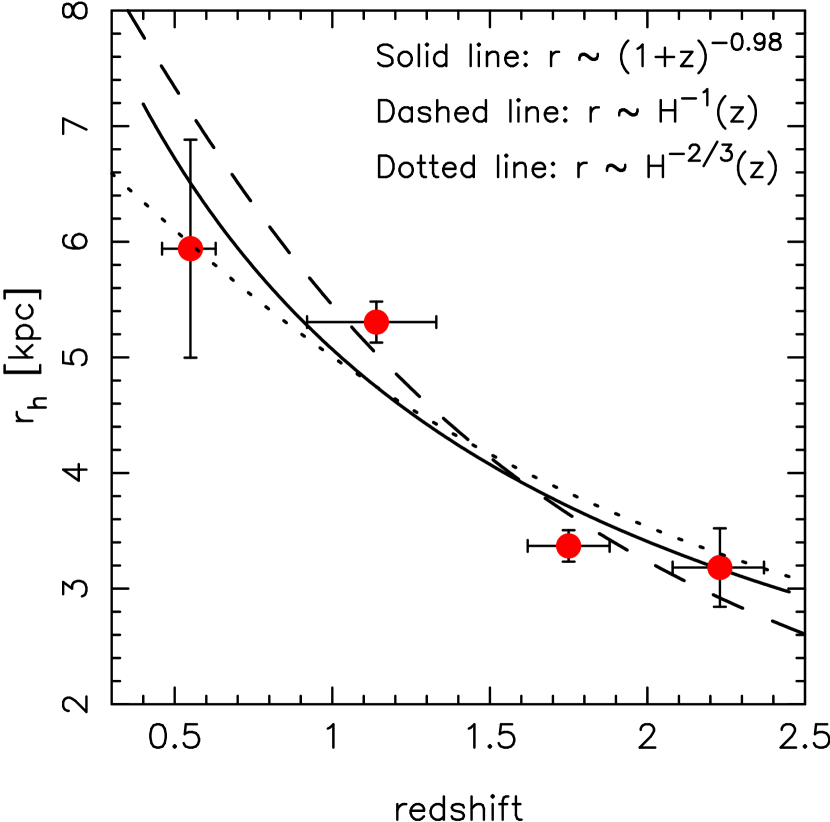
After calculating mass, we select galaxies with log(). To check that we are comparing galaxy samples with similar mass, we calculate the median mass in each redshift bin. We find masses log()=10.5, 10,4, 10.3, and 10.3, at redshifts , , , and , respectively. This shows that we are comparing samples with similar masses. In Figure 14, we show the resulting size-redshift relation for the sample, where red dots represent the median value in each bin. Fitting to the functional form , we find .
This suggests a somewhat shallower evolution in the size-redshift relation for a mass selected sample compared to a luminosity selected sample, even though the difference is within errors. Comparing the parameters between the luminosity and the mass selected samples indicates a decrease in stellar mass-to-light ratio at higher redshift.
The evolution found is consistent with the simple scaling law (which suggests over our redshift range).
A shallower evolution is found in the rest-frame band by Trujillo et al. (2005), who report between and . Comparing with the band evolution at fixed luminosity, this also indicates a decrease in the stellar mass-to-light ratio with redshift (Trujillo et al. 2004, 2005).
In contrast, using disk galaxies () in rest-frame -band, Barden et al. (2005) did not find any significant evolution in the mass-size relation over the redshift range . Since this is derived over a different redshift range and rest-frame band, it is difficult to compare results. However, we note that a non-evolution scenario at is inconsistent with our results at a 4 level. Therefore, further investigations are needed to determine the redshift-size evolution, in particular, it would be desirable to cover a larger redshift range using measurements in a single rest-frame band.
6 Conclusions and summary
We use the GOODS CDF-S optical and near-IR observations to derive the evolution of the rest-frame 1500Å and 2800Å luminosity functions, luminosity densities and star formation rates to . Taking advantage of the high resolution ACS imaging, we also derive the evolution the rest-frame UV morphological properties. We find:
-
•
There is a strong evolution in the UV characteristic magnitude with redshift. We find a brightening in by mag between and . At both 1500Å and 2800Å, we find no significant evolution at .
-
•
The rest-frame 2800Å luminosity density increases by a factor over the redshift range , while at rest-frame 1500Å the increase is a factor between and . The evolution flattens in both wave-lengths at .
-
•
We find that the uncorrected SFR derived from 2800Å luminosity is a factor higher than the SFR derived from 1500Å luminosity. Assuming that the difference is due to differential dust extinction, we find that E(B–V)=0.20 (using a Calzetti attenuation law and a standard Salpeter IMF) can explain the difference in the uncorrected SFRs.
-
•
The extinction corrected SFR is a factor () higher than the uncorrected SFR calculated from 1500Å (2800Å) luminosity densities. These corrections lead to a higher SFR compared to the SFRs derived from dropout samples which assume a smaller extinction correction (e.g., Giavalisco et al. 2004a).
-
•
The SFR we derive shows a steep increase out to . Comparing with the local value from Wyder et al. (2005), we find that the SFR is a factor higher at compared to . We note, however, that our measurements are consistent with a flat rate at 1.7.
-
•
We find that the fraction of galaxies with high Sérsic index (), indicating a bulge-like morphology, increases at higher redshift. At , we find that of the galaxies have bulge morphology, while the fraction is at . At the same time, the mean color of the galaxies gets bluer at higher redshift. This suggests that an increased fraction of the star formation takes place in objects with bulge-like morphology at high redshift. This could be the sign of the formation of todays elliptical population via mergers and infall at redshifts 1. At least part of the high redshift bulge systems may, however, evolve into the bulges of todays population of old spirals.
-
•
Investigating the luminosity-size redshift evolution of disk galaxies at rest-frame 2800Å over the redshift range , we find that galaxies become larger at lower redshift. Our results are consistent with trends found at both higher and lower redshift and suggests a size evolution between redshifts and . This is somewhat steeper then the simple scaling law , expected in the hierarchical model for a sample selected by mass. This suggests a stellar mass-to-light ratio that decreases at higher redshift.
-
•
We find a somewhat smaller evolution when selecting galaxies by mass (where mass is indirectly derived from the galaxies rest-frame colors and absolute magnitudes). This milder evolution supports the change in stellar mass-to-light ratio with redshift. Compared to measurements in the literature, we find a steeper evolution in the size evolution for the mass selected sample. However, investigations are made at different rest-frame bands and redshift ranges, and are therefore difficult to directly compare.
References
- Barden et al. (2005) Barden, M., et al. 2005, preprint, a-ph/0502416
- Bell et al. (2003) Bell, E. F., McIntosh, D.H., Katz, N., & Weinberg, M. D. 2003, ApJS, 149, 289
- Bertin & Arnouts (1996) Bertin, E., & Arnouts, S. 1996, A&AS, 117, 393
- Bolzonella et al. 2000 (2000) Bolzonella, M., Miralles, J. -M., & Pelló, R. 2000, A&A, 363, 476
- Bouwens % Silk (2002) Bouwens, R. & Silk, J. 2002, ApJ, 568, 522
- Bouwens et al. (2004a) Bouwens, R. J., Illingworth, G. D., Blakeslee, J. P., Broadhurst, T. J., & Franx, M. 2004a, ApJ, 611, L1
- Bouwens et al. (2004b) Bouwens, R. J., et al. 2004b, ApJ, 606, L25
- Bouwens et al. (2005) Bouwens, R. J., Illingworth, G. D., Blakeslee, J. P., & Franx, M. 2005, ApJ, submitted (preprint a-ph/0509641)
- Bruzual & Charlot (2003) Bruzual, G. & Charlot, S. 2003, MNRAS, 344, 1000
- Bundy et al. (2005) Bundy, K., Ellis, R. S., & Conselice, C. J. 2005, ApJ, 625, 621
- Calzetti et al. (2000) Calzetti, D., Armus, L., Bohlin, R. C., Kinney, A. L., Koornneef, J., & Storchi-Bergmann, T. 2000, ApJ, 533, 682
- Chabrier (2003) Chabrier, G. 2003, PASP, 115, 763
- Chary & Elbaz (2001) Chary, R., & Elbaz, D. 2001, ApJ, 556, 562
- Cole et al. (2004) Cole, S., Lacey, C. G., Baugh, C. M., & Frenk, C. S. 2000, MNRAS, 319, 168
- Coleman et al. (1980) Coleman, G. D., Wu, C.-C., & Weedman, D. W. 1980, ApJS, 43, 393
- Connolly et al. (1997) Connolly, A.J., Szalay, A.S., Dickinson, M.E., SubbaRao, M.U., & Brunner, R.J. 1997, ApJ, 486, L11
- Conselice et al. (2003) Conselice, C. J., Bershady, M. A., Dickinson, M., & Papovich, C. 2003, AJ, 126, 1183
- Conselice et al. (2004) Conselice, C. J., et al. 2004, ApJ, 600, L139
- Conselice et al. (2005) Conselice, C. J., Blackburne, J. A., & Papovich, C. 2005, ApJ, 620, 564
- Dahlen et al. (2005) Dahlen, T., Mobasher. B., Somerville, R. S., Moustakas L. A., Dickinson, M., Ferguson, H. C., & Giavalisco, M. 2005, ApJ, 631, 126
- de Mello et al. (2006) de Mello, D. F., Wadadekar, Y., Dahlen, T., Casertano, S., Gardner, J. P. 2006, AJ, 131, 216
- Fall & Efstathiou (1980) Fall, S. M., & Efstathiou, G. 1980, MNRAS, 193, 189
- Ferguson et al. (2004) Ferguson, H. C., et al. 2004, ApJ, 600, L107
- Gabasch et al. (2004) Gabasch, A., et al. 2004, A&A, 421, 41
- Giavalisco et al. (2004) Giavalisco, M., et al., 2004a, ApJ, 600, L103
- Giavalisco et al. (2004) Giavalisco, M., et al., 2004b, ApJ, 600, L93
- Hopkins (2004) Hopkins, A. M. 2004, ApJ, 615, 209
- Hopkins & Beacom (2006) Hopkins, A. M. & Beacom, J. F. 2006, ApJ, submitted (preprint a-ph/0601463)
- Kauffmann et al. (2003) Kauffmann, G., et al. 2003, MNRAS, 341, 33
- Kinney et al. (1996) Kinney, A. L., Calzetti, D., Bohlin, R. C., McQuade, K., Storchi-Bergmann, T., & Schmitt, H. R. 1996, ApJ, 467, 38
- Kroupa (2001) Kroupa, P. 2001, MNRAS, 322,231
- Lauger et al. (2005) Lauger, S., Ilbert, O., Buat, V., Tresse, L., Burgarella, D., Arnouts, S., Le Fèvre, O., & VVDS Collaboration. 2005, in EdP-Sciences, Conference Series, SF2A-2005: Semaine de l’Astrophysique Francaise, ed. F. Casoli, T. Contini, J.M. Hameury & L. Pagani, 667
- Le Fèvre et al. (2004) Le Fèvre, O., et al. 2004, A&A, 428, 1043
- Lilly et al. (1996) Lilly, S.J., Le Fèvre, O., Hammer, F., & Crampton D. 1996, AJ, 460, L1
- Lotz et al. (2005) Lotz, J. M., Madau, P., Giavalisco, M., Primack, J., & Ferguson, H. C. 2006, ApJ, 636, 592
- Madau et al. 1996 (1996) Madau, P., Ferguson, H. C., Dickinson, M., Giavalisco, M., Steidel, C. C., & Fruchter, A. 1996, MNRAS, 283, 1388
- Madau et al. 1998 (1998) Madau, P., Pozzetti, L., & Dickinson, M. 1998, ApJ, 498, 106
- Menanteau et al. 2001 (2001) Menanteau F., Abraham, R. G., & Ellis, R. S. 2001, MNRAS ,322, 1
- Menanteau et al. 2006 (2006) Menanteau F., Ford, H. C., Motta, V., Benitez, N., Martel, A., Blakeslee, J. P., & Infante, L. 2006, AJ, 131, 208
- Mignoli et al. 2005 (2005) Mignoli, M., et al. 2005, A&A, 437, 883
- Mo et al. 1998 (1998) Mo, H. J., Mao, S., & White, S. D. M. 1998, MNRAS, 295, 319
- Papovich et al. 2005 (2005) Papovich, C., Dickinson, M., Giavalisco, M., Conselice C. J., & Ferguson, H. C. 2005, ApJ, 631, 101
- Peng et al. 2002 (2002) Peng, C. Y., Ho, L. C., Impey, C. D., & Rix, H., -W. 2002, AJ, 124, 266
- Ravindranath et al. 2006 (2006) Ravindranath, S., et al. 2006, ApJ, in press (preprint a-ph/0606696)
- Salpeter (1955) Salpeter, E. E. 1955, ApJ, 121, 161
- Schechter (1976) Schechter, P. 1976, ApJ, 203, 297
- Schiminovich et al. 2005 (2005) Schiminovich D., et al. 2005, ApJ, 619, L47
- Schmidt (1968) Schmidt, M. 1968, ApJ, 151, 393
- Sérsic (1968) Sérsic, J. L., 1968, Atlas de Galaxias Australes (Córdoba: Obs. Astron., Univ. Nac. Córdoba)
- Shapley et al. (2001) Shapley, A. E., Steidel, C. C., Adelberger, K. L., Dickinson, M., Giavalisco, M., & Pettini, M. 2001, ApJ, 562, 95
- Steidel et al. (1995) Steidel, C. C., Pettini, M., & Hamilton, D. 1995, AJ, 110, 2519
- Strolger et al. (2004) Strolger, L. G., et al. 2004, ApJ, 613, 200
- Takeuchi et al. (2005) Takeuchi, T. T., Buat, V., & Burgarella, D. 2005, A&A, 440, L17
- Trujillo et al. (2004) Trujillo, I., et al. 2004, ApJ, 604, 521
- Trujillo et al. (2005) Trujillo, I., et al. 2005, ApJ, submitted (preprint a-ph/0504225)
- Vanzella et al. (2005) Vanzella, E., et al. 2005, A&A, 434, 53
- Wolf et al. (2003) Wolf, C., Meisenheimer, K., Rix, H.-W., Borch , A., Dye, S., & Kleinheinrich, M. 2003, A&A, 401, 73
- Wyder et al. (2005) Wyder, T. K., et al. 2005, ApJ, 619, L15
| Redshift bins | M | log() | log(SFR) | |||
|---|---|---|---|---|---|---|
| 10-4Mpc-3mag-1 | erg s-1Hz-1Mpc-3 | M⊙yr-1Mpc-3 | ||||
| 0.29-0.37 | 0.33 | - | 21.8 | 25.84 | ||
| 0.46-0.63 | 0.55 | 62.3 | 26.29 | |||
| 0.92-1.33 | 1.14 | - | 39.9 | 26.40 | ||
| 1.62-1.88 | 1.75 | - | 40.8 | 26.56 | ||
| 2.08-2.37 | 2.23 | - | 33.8 | 26.43 | ||
| Redshift bins | M | log() | log(SFR) | |||
| 10-4Mpc-3mag-1 | erg s-1Hz-1Mpc-3 | M⊙yr-1Mpc-3 | ||||
| 0.92-1.33 | 1.14 | - | 29.6 | 26.19 | ||
| 1.62-1.88 | 1.75 | 31.1 | 26.46 | |||
| 2.08-2.37 | 2.23 | - | 33.2 | 26.34 |
Note. — Results are given for Hubble constant . Table columns are (1) redshift range; (2) the redshift dividing the volume of each bin into two equal halves; (3-5) Best fitting Schechter function parameters. The faint-end slope, is fixed to the value derived in the second lowest redshift bins at both 2800Å and 1500Å; (6) luminosity density; (7) star formation rate with no extinction correction, assuming a Salpeter IMF and an evolving SFR history. To get extinction corrected rates, multiply results with a factor 3.7 at 2800Å and a factor 6.5 at 1500Å. See text for details.