Large Misalignment between Stellar Bar and Dust Pattern in NGC 3488 Revealed by Spitzer and SDSS
Abstract
A large position angle misalignment between the stellar bar and the distribution of dust in the late-type barred spiral NGC 3488 was discovered, using mid-infrared images from the Spitzer Space Telescope and optical images from the Sloan Digital Sky Survey (SDSS). The angle between the bar and dust patterns was measured to be 25∘2∘, larger than most of the misalignments found previously in barred systems based on H or H i/CO observations. The stellar bar is bright at optical and 3.6m, while the dust pattern is more prominent in the 8m band but also shows up in the SDSS u and g-band images, suggesting a rich interstellar medium environment harboring ongoing star formation. This angular misalignment is unlikely to have been caused by spontaneous bar formation. We suggest that the stellar bar and the dust pattern may have different formation histories, and that the large misalignment was triggered by a tidal interaction with a small companion. A statistical analysis of a large sample of nearby galaxies with archival Spitzer data indicates that bar structure such as that seen in NGC 3488 is quite rare in the local Universe.
keywords:
galaxies: individual(NGC 3488) , galaxies: spiral , galaxies: structure , infrared: galaxiesPACS:
98.62.Hr1 Introduction
Bar structure as a major non-axisymmetric feature on all scales is important in studying the morphology, mass and light distributions (e.g., Freeman 1996; Elmegreen & Elmegreen 1985; Elmegreen 1996; Elmegreen et al. 1996; Eskridge et al. 2000; Menéndez-Delmestre et al. 2007), star formation (e.g., Zurita et al. 2004; Knapen 2005; Ondrechen & van der Hulst 1983; Regan et al. 1996; Sheth et al. 2000), gas dynamics (e.g., Kormendy 1983; Bettoni & Galletta 1988; Sancisi et al. 1979; Benedict et al. 1996; Downes et al. 1996; Regan et al. 1999) and central activities (e.g., Ho et al. 1997b; Hawarden et al. 1986; Knapen et al. 2002; Sakamoto et al. 1999; Martini et al. 2003; Sheth et al. 2005) of disk galaxies. Theoretical models, including N-body and hydrodynamic simulations, generally confirm that bar formation is spontaneous and ubiquitous in disk evolution (e.g., Athanassoula 1992; Sellwood & Wilkinson 1993; Friedli & Benz 1993, 1995; Athanassoula & Bureau 1999). Because of the dissipative nature of the interstellar medium (ISM), the streaming motions of the molecular gas in and around bar regions can be different from the stellar orbits (Athanassoula 1992; Regan et al. 1999; Sheth et al. 2002). Due to the delayed star formation after the clouds have been triggered (30Myr; Vogel et al. 1988), the locations of gas/dust in galaxies can often be offset from that of young stars (e.g., Sheth et al. 2002; Phillips 1996; Martin & Friedli 1997). The molecular gas can be transported from galactic disk toward central region by the gravitational torques from bars (e.g., Sakamoto et al. 1999; Sheth et al. 2002, 2005), and the condensation of gas leads to subsequent circumnuclear star formation (e.g., Ho et al. 1997b; Knapen et al. 2002; Martini et al. 2003; Jogee et al. 2005; Fisher 2006).
Observationally, the gas/dust patterns can often be seen as dust lanes, atomic and molecular gas concentrations, or isophotes of H ii regions with active star formation (Martin & Friedli 1997; Sakamoto et al. 1999; Regan et al. 1999; Rand et al. 1999; Crosthwaite et al. 2000; Sheth et al. 2002, 2005). As predicted by theoretical models (Athanassoula 1992; Friedli & Benz 1993, 1995), there is a small position angle misalignment between the gas/dust distribution and the stellar bar, usually of a few (and up to 10) degrees, in the sense that the former is leading. Kenney et al. (1991) found the gaseous pattern is offset from the major axis of the stellar distribution by 24∘6∘ in M 101. Crosthwaite et al. (2000) found that the central gas distribution as indicated by H i map leads the stellar bar by almost 10∘ in the late-type galaxy IC 342. Similarly, Rozas et al. (2000) identified a large sample of H ii regions in barred galaxy NGC 3359 and showed a position angle misalignment of a few degrees exists in H and I-band images. They also pointed out that the -band image of this galaxy shows a bar pattern more aligned with H, further suggesting massive star formation “at the leading edge of the bar”. Sheth et al. (2002) found offsets between molecular gas (CO) and star formation (traced by H) in bars of six nearby spirals, which were caused by the gas flow dependent star formation. Understanding the misalignment between stellar and gas/dust patterns and their formation scenarios is crucial for studying the ISM properties and star formation processes taking place in environments where gas dynamics are strongly perturbed (e.g., Regan et al. 1996; Martin & Friedli 1997; Sheth et al. 2000; Zurita et al. 2004), and also offers a good opportunity to study dynamical properties and secular evolution of barred galaxies (e.g., Kormendy 1983; Benedict et al. 1996; Regan et al. 1999; Kormendy & Kennicutt 2004; Sheth et al. 2005; Kormendy & Fisher 2005; Fisher 2006; Regan et al. 2006).
The Spitzer Space Telescope’s (Werner et al. 2004) observations in the mid-infrared, with its higher sensitivity and better angular resolution than previous observations (e.g., ISO), provide a new opportunity to study both stellar and gas/dust structures in galaxies (e.g., Pahre et al 2004; Wang et al. 2004; Cao & Wu 2007). In particular, the four Infrared Array Camera (IRAC; Fazio et al. 2004) bands from 3.6 to 8.0 m probe both stellar continuum and warm dust emissions (of the so-called polycyclic aromatic hydrocarbon, or PAH, and dust continuum emissions) with identical spatial sampling, thus enabling a powerful probe to compare non-axisymmetric features such as bar structures involving gas/dust and stellar mass. Recently, Spitzer observations of nearby galaxies have demonstrated the importance of using mid-infrared images for studying galaxy secular evolution driven by bar instabilities (e.g., Fisher 2006; Regan et al. 2006).
In this paper, we present an analysis of data from Spitzer and SDSS of the late-type barred spiral galaxy NGC 3488. Previous studies show that, with an estimated distance of 39.9 Mpc (at this distance, 1′′ corresponds to 193 parsecs) and a total infrared luminosity of 4.6109 (Bell 2003), NGC 3488 [Hubble type SB(s)c] has a weak bar (1.5 kpc), with spiral arms beginning at the bar’s end but without an inner ring. This is consistent with the conventional view that bars in most late-type spirals are relatively weak (Erwin 2005; Menéndez-Delmestre et al. 2007), and that weak bars tend to produce a SB(s) type response (in which the spiral arms begin at the ends of the bar; Kormendy & Kennicutt 2004). The data reduction is presented in 2, and results on the bar structures in NGC 3488 with multi-wavelengths analysis are described in 3. Possible explanations of the large misalignment between the bar and dust patterns are discussed in 4.
2 Data Reduction
Broad-band infrared images of NGC 3488 were acquired with IRAC on board Spitzer. The Basic Calibrated Data (BCD) were part of the Lockman Hole field in the Spitzer Wide-field Infrared Extragalactic (SWIRE) Survey (Lonsdale et al. 2003). Following the preliminary data reduction by the Spitzer Science Center pipeline, images of each of the four IRAC bands (3.6, 4.5, 5.8 and 8 m) were mosaicked, after pointing refinement, distortion correction and cosmic-ray removal (Fazio et al. 2004; Huang et al. 2004; Wu et al. 2005; Surace et al. 2005; Cao & Wu 2007; Wen et al. 2007). The mosaicked images have pixel sizes of 0.6′′ and angular resolutions (full width at half maximum, FWHM) of 1.9′′, 2.0′′, 1.9′′ and 2.2′′ for the four bands, respectively. The angular resolution of IRAC 8m images (2.2′′) is significantly improved over that of pre-Spitzer data at similar wavelengths (e.g., 10′′ for ISOCAM LW2 at 7m; Roussell et al. 2001).
In order to derive the dust-only 8m component (PAH and dust continuum emissions), we remove the stellar continuum from the IRAC 8m image by subtracting a scaled IRAC 3.6m image (assuming that the 3.6m emission is entirely due to old stellar population):
where the scaling factor = 0.232 was calculated based on Starburst99 synthesis model (Leitherer et al. 1999), assuming solar metallicity and a Salpeter initial mass function between 0.1 and 120 . This approach has been adopted in several previous works (e.g., Helou et al. 2004; Wu et al. 2005; Regan et al. 2006; Bendo et al. 2006) for studying dust emissions and the 7.7m PAH feature based on broad-band measurements, and shown to be effective.
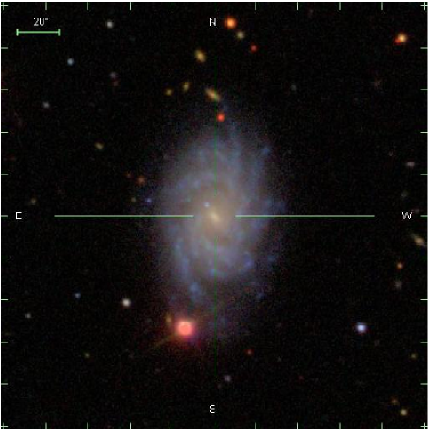
The five-band optical images () and the fiber spectrum for the central region ( diameter) of NGC 3488 were taken from the SDSS data archive (York et al. 2000; Stoughton et al. 2002). The background in each band was subtracted by fitting a low-order Legendre polynomial to it, after masking out all bright sources (Zheng et al. 1999; Wu et al. 2002). Figure 1 shows the three-color image of NGC 3488 derived from the SDSS data archive. North is up, and east is to the left, as denoted by the crosshair.
3 Results
3.1 Multi-wavelength View of Bar Structures in NGC 3488
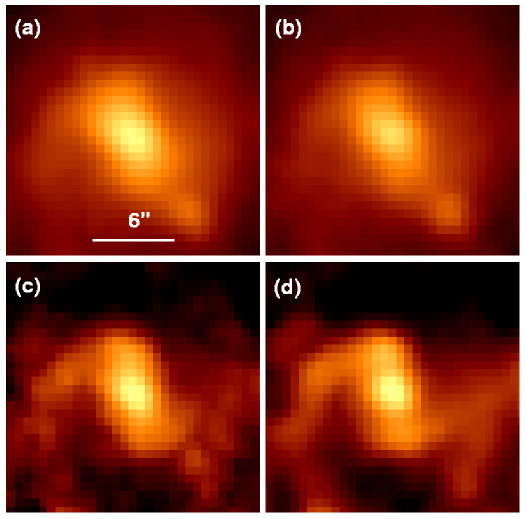
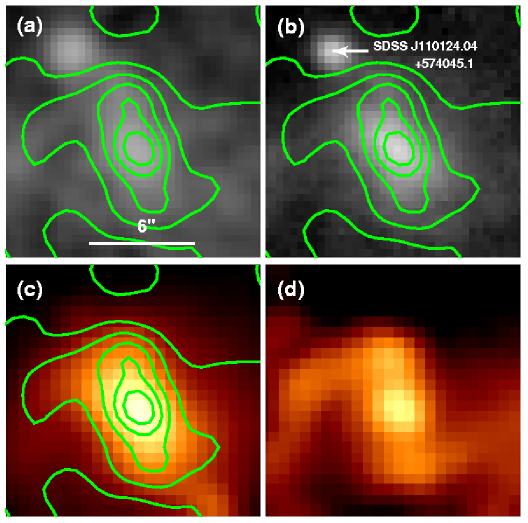
The four-band IRAC images of NGC 3488 are shown in Figure 2. We find that NGC 3488 has two bar-like patterns that are bright in either stellar emission (at 3.6 and 4.5m) or warm dust emission (at 8m). We took the conventional approach of treating the bar as an elliptical feature for measuring its semi-major axis a and position angle PA. They can be measured with a fitting routine such as the ellipse task in IRAF. The PAs are approximately 36∘, 36∘, 20∘, 15∘ for the bars in the 3.6, 4.5, 5.8, 8m band, respectively. Uncertainties of the position angles are estimated to be ∘, derived from the deviation of PAs along the major axis of the bar. Taking the mean of the two shorter wavelength bands as representing the stellar bar, we measured that it trails the dust pattern traced primarily by the continuum-subtracted 8m emission (Fig. 3c), by a large position angle difference. Spiral arms with bright knots are also visible in the 8m image: they appear to begin at the end of the dust pattern (Fig. 3d).
For the SDSS images, the PA of the bar was also measured using ellipse. The PA of the optical bar measured in this way is nearly identical (40∘) in the SDSS g, r, i, z-band images, and is also spatially coincident, within the measurement uncertainty of ∘, with that of the IRAC 3.6 and 4.5m images, but trails the dust pattern at 8m by 25∘ (Fig. 3b). However, the bar in the SDSS -band is quite different from that in the other SDSS bands: at PA ∘, it is instead much better aligned with the dust pattern bright at IRAC 8m (Fig. 3a).
The deprojected values of the relative length [L] and the misalignment between the stellar bar and the dust pattern [(i)] are calculated using the equations given by Martin (1995):
where is the inclination angle of NGC 3488 (49.5∘, calculated using the formula given by Bottinelli et al. 1983), is the length of the semi-major axis, is the angle between the patterns (dust or stellar) and the node lines (the major axis defines the PA of the galaxy, 175∘), and is the diameter of NGC 3488 at a -band surface brightness of 25 mag arcsec-2 (1.86 arcmin). 111The PA, , and of NGC 3488 were taken from The Third Reference Catalogue of Bright Galaxies (de Vaucouleurs et al. 1991). These parameters of the patterns are summarized in Table 1. The angular misalignment between the optical bar and the infrared dust pattern, , is approximately 20∘ after correcting for inclination effect. Uncertainties of these parameters can be as large as , due mostly to simplistic assumptions concerning projection effects and the difficulty in decoupling the bar from the bulge (Martin 1995; Martin & Friedli 1997), especially in the IRAC 8m image. Nevertheless, this angular misalignment, assuming it represents the misalignment between the dust and stellar patterns, belongs to one of the largest misalignments found in previous observations or in typical numerical simulations.
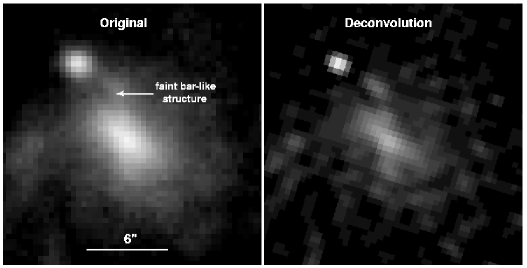
Besides the bright stellar bar, a faint and clumpy bar-like structure appears to be present in the SDSS -band image (Fig. 4, left panel). We use two different techniques to enhance the visibility of this structure: unsharp masking (e.g., Walterbos et al. 1994) and deconvolution (Fig. 4, right panel). Unsharp masking was made by using a 2-pixel wide (2) Gaussian filter. The deconvolution was performed with the task lucy (Lucy 1974) in IRAF, using a point-spread function derived from the associated psField file of the SDSS data; the total number of iterations is 30. The PA of this faint bar-like structure is approximately 15∘2∘, so it is spatially coincident with the patterns in -band and 8m images.
3.2 Stellar Populations in Bars
The bar bright at optical (SDSS) and IRAC 3.6, 4.5 m is known to be dominated by old stellar population. Gadotti & de Souza (2006) showed that the bar color index can be used as an indicator of the bar age: old bars are on average redder than young ones. The SDSS and colors of the stellar bar of NGC 3488 were compared with an instantaneous burst model calculated based on GALAXEV (Bruzual & Charlot 2003), adopting a Salpeter initial mass function and solar metallicity as initial conditions. This comparison shows that the stellar bar bright in optical and IRAC 3.6 and 4.5m bands is evolved, with a mean age of the order of 4 Gyr.
The pattern bright at 8m is dominated by the strong 7.7m PAH feature and warm dust continuum emission from very small grains, while the pattern shown in the IRAC 5.8m image is probably a mixture of stellar and dust (6.2m PAH and warm dust) components. From the correlation between 8m dust emission and star formation activities (Wu et al. 2005; Calzetti et al. 2005) and the previous result that 8m dust and 24m hot dust emission are well correlated on kiloparsec scales 222MIPS 24m emission, which is mainly due to hot dust emission from very small grains, is thought to be a good measure of the SFR in galaxies (e.g., Wu et al. 2005; Calzetti et al. 2005; Pérez-González et al. 2006). (e.g., Bendo et al. 2006), we suggest that the dust pattern seen at 8m is associated with young stars and thus represents recent star forming activity. Some authors (e.g., Regan et al. 2006; R. C. Kennicutt, priv. comm.), however, argue that PAH emission is likely a better tracer of the general ISM rather than star-forming regions heated by young, massive stars. The coincidence of the bar shown in the -band with that bright at 8m (Fig. 3a) confirms that there exists a young stellar population in the region of the dust pattern.
3.3 Star Formation Rates
The star formation rate (SFR) in the bar region of NGC 3488 can be estimated using either the H line flux or the 8m dust emission. The SDSS spectrum, taken through a 3′′-diameter (0.58 kpc) fiber, indicates that the central region can be classified as an “H ii nucleus” (Ho et al. 1997a), one whose main source of ionizing photons derives from young stars. The H-based SFR is calculated using Equation B3 of Hopkins et al. (2003), after correcting for extinction using the observed Balmer decrement (Calzetti 2001):
where and are the stellar absorption-corrected line fluxes, derived from the emission-line catalog given by MPA-SDSS (Tremonti et al. 2004). The measured SFR for the central 3′′ based on H is 0.0077 yr-1.
To estimate the SFR along the bar, we use the 8m dust emission, which is thought to be measure of the SFR in galaxies (Wu et al. 2005). From Equation 4 of Wu et al. (2005):
An aperture of 3′′ diameter was selected for measuring the SFR centered on the nucleus using the dust-only 8m image, to enable a sensible comparison with the SFR derived from the H flux. The SFR measured in this way is 0.0079 yr-1, consistent with that derived from H. This result indicates that the 8m dust emission can be used as a tracer of the SFR in the central region of galaxies, at least for the case of NGC 3488. The enhanced 8m emission in the central region of NGC 3488 is consistent with the result that barred galaxies tend to have strong central excesses in 8m emission (Regan et al. 2006), which suggests that bars induce gas inflows toward the center of galaxies as an internal process of galaxy secular evolution (e.g., Sakamoto et al. 1999; Sheth et al. 2000, 2002, 2005; Jogee et al. 2005). We also estimated the total SFR along the bar after excluding the contribution from the central region. The photometry was performed on the dust-only 8m image using an ellipse with a semi-major axis of 3′′ and an ellipticity of 0.5, chosen to match the isocontour of the dust pattern. The measured SFR for the bar and nucleus is 0.0150 yr-1, which implies that the SFR along the bar is roughly 0.0072 yr-1, comparable to the value at the nucleus.
4 Discussion
4.1 Possible Formation Scenarios of the Misalignment Between Bars in NGC 3488
Martin & Friedli (1997) found that the H bars (tracing young stars and H ii regions) and stellar bars are misaligned by up to 10∘ among 11 barred galaxies. Friedli & Benz (1993, 1995), using their N-body + SPH simulations of spontaneous bar formation, showed that the H ii regions tend to lead the stellar bar by an angle of several degrees. In these simulations the misalignments between bars are similar to those observed, and they occur as a result of orbit crossings of gas motion, mostly at early epochs during the formation of a strong, fast-rotating bar in the absence of an inner Lindblad resonance (Martin & Friedli 1997). The best example is NGC 3359, in which star formation is completely absent in the galaxy nucleus (Martin & Friedli 1997), and the age of the bar is young (400 Myr; Martin & Roy 1995). But this is unlikely to be the case in NGC 3488, due to the fact that the age of its stellar bar (4 Gyr) is much older than bars in the spontaneous bar formation scenario (e.g., NGC 3359).
Alternatively, perhaps the morphology of this galaxy represents an episode shortly after the capture of a small, secondary galaxy. In such a galaxy merger scenario, the stellar and dust patterns may have different formation histories. The stellar bar may have formed previously as in a spontaneous formation scenario, and the dust pattern could be tidally induced later from a dwarf galaxy swallowed by NGC 3488. The different stellar populations in the stellar bar and the dust pattern (see §3.2) also support this scenario. Berentzen et al. (2003) investigated the dynamical effects of the interaction between an initially barred galaxy and a small companion, using N-body/SPH numerical simulations. They found that the interactions can produce offset bars, nuclear and circumnuclear disks, and tidal arms connected to the end of the bar. Based on their results that the fate of the stellar bar is determined by the impact position, we speculate that in NGC 3488 there may have been an impact on the bar major axis when the bar was weak. In such a case, the tidal force exerted on the bar does not disrupt much the bar structure (i.e., the stellar bar survived after the impact). The nearby bright, compact object toward the northeast of the SDSS images (see Fig. 3b), identified as SDSS J110124.04+574045.1, is a plausible candidate for a dwarf galaxy that may have hit NGC 3488. Its colors are very blue (, , ) and similar to those of irregular galaxies (Fukugita et al. 1995). And its absolute magnitude (, , , , for u, g, r, i, z, respectively) are located at the faint end of the luminosity function of extremely low-luminosity galaxies (Blanton et al. 2005), if we assume that its distance is the same as that of NGC 3488 (39.9 Mpc). However, we cannot exclude the possibility that it is a foreground white dwarf star superposed on NGC 3488, since its very blue colors are consistent with those of spectroscopically identified white dwarf stars in SDSS (Kleinman et al. 2004).
4.2 Frequency of Large Misalignments Between Bars Among Galaxies Revealed By Spitzer
Large misalignments (10∘) between stellar bars (bright at optical and 3.6m) and dust distributions (shown at 8m) are quite rare among nearby barred galaxies with archival Spitzer data. We have examined 50 barred spirals (SB and SAB) in the Spitzer Infrared Nearby Galaxies Survey (SINGS, Kennicutt et al. 2003) and in the Mid-IR Hubble Atlas of Galaxies (a Spitzer GTO program, PID: #69, PI: G. Fazio; see also Pahre et al. 2004), and found that none of them shows a misalignment as large as that found in NGC 3488. Most of the galaxies only have a single old stellar bar, which is bright at IRAC 3.6 and 4.5 m but absent at 8m (e.g., NGC 7080). Others that have younger bars always show good alignment between 3.6 and 8m (e.g., NGC 7479, consistent with the previous result that no misalignment was observed between its H and stellar bars; Martin & Friedli 1997). This statistical evidence indicates that the bar structure seen in NGC 3488 is quite rare among barred galaxies in the local Universe, and that the misalignment between bar and dust patterns may be a short-lived phenomenon in the evolutionary history of the galaxy. However, any firm conclusion must await a quantitative analysis of a large, well-defined, and unbiased sample of barred galaxies.
5 Summary
Using mid-infrared images from Spitzer and optical images from SDSS, we show that the late-type barred spiral galaxy NGC 3488 contains two misaligned patterns, one composed of old stars and the other young stars and dust. The angle between the two patterns (25∘) is among the largest ever reported. The stellar bar is bright in the optical and in the IRAC 3.6 and 4.5m bands, and is dominated by old stars. The dust pattern is more prominent in the 8m band, but also shows up in the SDSS u and g bands; it traces regions of recent or ongoing star formation. The dust pattern could be tidally induced by a dwarf galaxy swallowed by NGC 3488. From examination of mid-infrared images of a large sample of nearby barred galaxies with archival Spitzer data, we find that bar structure such as that found in NGC 3488 is quite rare in the local Universe.
To further test the hypothesis that the large misalignment in NGC 3488 was triggered by a recent merger, it would be desirable to obtain deeper imaging observations of the system in order to search for morphological features suggestive of tidal interactions. Obtaining a spectrum of the candidate dwarf galaxy would help validate its physical association with NGC 3488. Additional numerical simulations will help to validate whether two large-scale patterns can coexist over long time scales, since it is possible that the competing torques will introduce chaos to the system (I. Berentzen, priv. comm.).
Acknowledgments
We would like to thank the anonymous referee for very constructive comments and suggestions.
We thank X.-Y. Xia, S. Mao, R. Kennicutt, I. Berentzen for advice and helpful discussions,
and C.-N. Hao, J.-L. Wang, F.-S. Liu for their capable assistance throughout the
process of Spitzer data reductions. This project is supported by NSFC No.10273012,
No.10333060, No.10473013, No.10373008. This work is based in part on observations made with
the Spitzer Space Telescope, which is operated by the Jet Propulsion Laboratory,
California Institute of Technology under NASA contract 1407. Funding for the SDSS and
SDSS-II has been provided by the Alfred P. Sloan Foundation, the Participating Institutions,
the National Science Foundation, the U.S. Department of Energy, the National Aeronautics
and Space Administration, the Japanese Monbukagakusho, the Max Planck Society, and the
Higher Education Funding Council for England. The SDSS Web Site is http://www.sdss.org/.
The SDSS is managed by the Astrophysical Research Consortium for the Participating Institutions.
The Participating Institutions are the American Museum of Natural History, Astrophysical
Institute Potsdam, University of Basel, Cambridge University, Case Western Reserve University,
University of Chicago, Drexel University, Fermilab, the Institute for Advanced Study, the
Japan Participation Group, Johns Hopkins University, the Joint Institute for Nuclear Astrophysics,
the Kavli Institute for Particle Astrophysics and Cosmology, the Korean Scientist Group, the
Chinese Academy of Sciences (LAMOST), Los Alamos National Laboratory, the Max-Planck-Institute for
Astronomy (MPIA), the Max-Planck-Institute for Astrophysics (MPA), New Mexico State University,
Ohio State University, University of Pittsburgh, University of Portsmouth, Princeton University,
the United States Naval Observatory, and the University of Washington.
References
- Athanassoula (1992) Athanassoula, E. 1992, MNRAS, 259, 328
- Athanassoula & Bureau (1999) Athanassoula, E., & Bureau, M. 1999, ApJ, 522, 699
- Bell (2003) Bell, E. F. 2003, ApJ, 586, 794
- Bendo et al. (2006) Bendo, G. J., et al. 2006, ApJ, 652, 283
- Benedict et al. (1996) Benedict, F. G., Smith, B. J., & Kenney, J. D. P. 1996, AJ, 111, 1861
- Berentzen et al. (2003) Berentzen, I., Athanassoula, E., Heller, C. H., & Fricke, K. J. 2003, MNRAS, 341, 343
- Bettoni & Galletta (1988) Bettoni, D., & Galletta, G. 1988, A&A, 190, 52
- Blanton et al. (2005) Blanton, M. R., Lupton, R. H., Schlegel, D. J., Strauss, M. A., Brinkmann, J., Fukugita, M., & Loveday, J. 2005, ApJ, 631, 208
- Bottinelli et al. (1983) Bottinelli, L., Gouguenheim, L., Paturel, G., & de Vaucouleurs, G. 1983, A&A, 118, 4
- Bruzual & Charlot (2003) Bruzual, G., & Charlot, S. 2003, MNRAS, 344, 1000
- Calzetti (2001) Calzetti, D. 2001, PASP, 113, 1449
- Calzetti et al. (2005) Calzetti, D., et al. 2005, ApJ, 633, 871
- Cao & Wu (2007) Cao, C., & Wu, H. 2007, AJ, 133, 1710
- Crosthwaite et al. (2000) Crosthwaite, L. P., Turner, J. L., & Ho, P. T. P. 2000, AJ, 119, 1720
- Downes et al. (1996) Downes, D., Reynaud, D., Solomon, P. M., & Radford, S. J. E. 1996, ApJ, 461, 186
- de Vaucouleurs et al. (1991) de Vaucouleurs, G., de Vaucouleurs, A., Corwin, H. G., Buta, R. J., Paturel, G. & Fouque, P. 1991, Third Reference Catalogue of Bright Galaxies (New York: Springer)
- Elmegreen & Elmegreen (1985) Elmegreen, B. G., & Elmegreen, D. M. 1985, ApJ, 288, 438
- Elmegreen (1996) Elmegreen, D. M. 1996, IAU Colloq. 157: Barred Galaxies, 91, 23
- Elmegreen et al. (1996) Elmegreen, B. G., Elmegreen, D. M., Chromey, F. R., Hasselbacher, D. A., & Bissell, B. A. 1996, AJ, 111, 2233
- Erwin (2005) Erwin, P. 2005, MNRAS, 364, 283
- Eskridge et al. (2000) Eskridge, P. B., et al. 2000, AJ, 119, 536
- Fazio et al. (2004) Fazio, G. G., et al. 2004, ApJS, 154, 10
- Fisher (2006) Fisher, D. B. 2006, ApJl, 642, L17
- Freeman (1996) Freeman, K. C. 1996, IAU Colloq. 157: Barred Galaxies, 91, 1
- Friedli & Benz (1993) Friedli, D., & Benz, W. 1993, A&A, 268, 65
- Friedli & Benz (1995) Friedli, D., & Benz, W. 1995, A&A, 301, 649
- Fukugita et al. (1995) Fukugita, M., Shimasaku, K., & Ichikawa, T. 1995, PASP, 107, 945
- Gadotti & de Souza (2006) Gadotti, D. A., & de Souza, R. E. 2006, ApJS, 163, 270
- Hawarden et al. (1986) Hawarden, T. G., Mountain, C. M., Leggett, S. K., & Puxley, P. J. 1986, MNRAS, 221, 41P
- Helou et al. (2004) Helou, G., et al. 2004, ApJS, 154, 253
- Ho et al. (1997a) Ho, L. C., Filippenko, A. V., & Sargent, W. L. W. 1997a, ApJ, 487, 579
- Ho et al. (1997b) Ho, L. C., Filippenko, A. V., & Sargent, W. L. W. 1997b, ApJ, 487, 591
- Hopkins et al. (2003) Hopkins, A. M., et al. 2003, ApJ, 599, 971
- Huang et al. (2004) Huang, J.-S., et al. 2004, ApJS, 154, 44
- Jogee et al. (2005) Jogee, S., Scoville, N., & Kenney, J. D. P. 2005, ApJ, 630, 837
- Kenney et al. (1991) Kenney, J. D. P., Scoville, N. Z., & Wilson, C. D. 1991, ApJ, 366, 432
- Kennicutt et al. (2003) Kennicutt, R. C., et al. 2003, PASP, 115, 928
- Kleinman et al. (2004) Kleinman, S. J., et al. 2004, ApJ, 607, 426
- Knapen et al. (2002) Knapen, J. H., Pérez-Ramírez, D., & Laine, S. 2002, MNRAS, 337, 808
- Knapen (2005) Knapen, J. H. 2005, Astronomy and Geophysics, 46, 28
- Kormendy (1983) Kormendy, J. 1983, ApJ, 275, 529
- Kormendy & Kennicutt (2004) Kormendy, J., & Kennicutt, R. C. 2004, ARA&A, 42, 603
- Kormendy & Fisher (2005) Kormendy, J., & Fisher, D. B. 2005, Revista Mexicana de Astronomia y Astrofisica Conference Series, 23, 101
- Leitherer et al. (1999) Leitherer, C., et al. 1999, ApJS, 123, 3
- Lonsdale et al. (2003) Lonsdale, C. J., et al. 2003, PASP, 115, 897
- Lucy (1974) Lucy, L. B. 1974, AJ, 79, 745
- Martin (1995) Martin, P. 1995, AJ, 109, 2428
- Martin & Friedli (1997) Martin, P., & Friedli, D. 1997, A&A, 326, 449
- Martin & Roy (1995) Martin, P., & Roy, J.-R. 1995, ApJ, 445, 161
- Martini et al. (2003) Martini, P., Regan, M. W., Mulchaey, J. S., & Pogge, R. W. 2003, ApJ, 589, 774
- Menéndez-Delmestre et al. (2007) Menéndez-Delmestre, K., Sheth, K., Schinnerer, E., Jarrett, T. H., & Scoville, N. Z. 2007, ApJ, 657, 790
- Ondrechen & van der Hulst (1983) Ondrechen, M. P., & van der Hulst, J. M. 1983, ApJ, 269, L47
- Pahre et al. (2004) Pahre, M. A., Ashby, M. L. N., Fazio, G. G., & Willner, S. P. 2004, ApJS, 154, 235
- Pérez-González et al. (2006) Pérez-González, P. G., et al. 2006, ApJ, 648, 987
- Phillips (1996) Phillips, A. C. 1996, IAU Colloq. 157: Barred Galaxies, 91, 44
- Rand et al. (1999) Rand, R. J., Lord, S. D., & Higdon, J. L. 1999, ApJ, 513, 720
- Regan et al. (1996) Regan, M. W., Teuben, P. J., Vogel, S. N., & van der Hulst, T. 1996, AJ, 112, 2549
- Regan et al. (1999) Regan, M. W., Sheth, K., & Vogel, S. N. 1999, ApJ, 526, 97
- Regan et al. (2006) Regan, M. W., et al. 2006, ApJ, 652, 1112
- Roussel et al. (2001) Roussel, H., et al. 2001, A&A, 369, 473
- Rozas et al. (2000) Rozas, M., Zurita, A., & Beckman, J. E. 2000, A&A, 354, 823
- Sakamoto et al. (1999) Sakamoto, K., Okumura, S. K., Ishizuki, S., & Scoville, N. Z. 1999, ApJ, 525, 691
- Sancisi et al. (1979) Sancisi, R., Allen, R. J., & Sullivan, W. T., III 1979, A&A, 78, 217
- Sellwood & Wilkinson (1993) Sellwood, J. A., & Wilkinson, A. 1993, Reports of Progress in Physics, 56, 173
- Sheth et al. (2000) Sheth, K., Regan, M. W., Vogel, S. N., & Teuben, P. J. 2000, ApJ, 532, 221
- Sheth et al. (2002) Sheth, K., Vogel, S. N., Regan, M. W., Teuben, P. J., Harris, A. I., & Thornley, M. D. 2002, AJ, 124, 2581
- Sheth et al. (2005) Sheth, K., Vogel, S. N., Regan, M. W., Thornley, M. D., & Teuben, P. J. 2005, ApJ, 632, 217
- Stoughton et al. (2002) Stoughton, C., et al. 2002, AJ, 123, 485
- Surace et al. (2005) Surace, J. A., et al. 2005, ’The SWIRE Data Release 2: Image Atlases and Source Catalogs for ELAIS-N1, ELAIS-N2, XMM-LSS, and the Lockman Hole’
- Vogel et al. (1988) Vogel, S. N., Kulkarni, S. R., & Scoville, N. Z. 1988, Nature, 334, 402
- Walterbos et al. (1994) Walterbos, R. A. M., Braun, R., & Kennicutt, R. C., Jr. 1994, AJ, 107, 184
- Wang et al. (2004) Wang, Z., et al. 2004, ApJS, 154, 193
- Wen et al. (2007) Wen, X.-Q., Wu, H., Cao, C., & Xia, X.-Y. 2007, Chinese Journal of Astronomy and Astrophysics, 7, 187
- Werner et al. (2004) Werner, M. W., et al. 2004, ApJS, 154, 1
- Wu et al. (2002) Wu, H., et al. 2002, AJ, 123, 1364
- Wu et al. (2005) Wu, H., Cao, C., Hao, C.-N., Liu, F.-S., Wang, J.-L., Xia, X.-Y., Deng, Z.-G., & Young, C. K.-S. 2005, ApJ, 632, L79
- York et al. (2000) York, D. G., et al. 2000, AJ, 120, 1579
- Zheng et al. (1999) Zheng, Z., et al. 1999, AJ, 117, 2757
- Zurita et al. (2004) Zurita, A., Relaño, M., Beckman, J. E., & Knapen, J. H. 2004, A&A, 413, 73
| Regions | [”] | (i) | PA[∘] | [∘] | (i)[∘] | Image |
|---|---|---|---|---|---|---|
| (1) | (2) | (3) | (4) | (5) | (6) | |
| Stellar Bar | 4.2 | 0.111 | 40.0 | SDSS band | ||
| 25.0 | 19.7 | |||||
| Dust Pattern | 3.0 | 0.067 | 15.0 | IRAC 8m |
-
Notes.Col.(1): The lengths of semi-major axis of the stellar bar and dust pattern; Col.(2): The relative lengths of the patterns; Col.(3): Position angles measured in the conventional manner, from North through East; Col.(4): The measured angular misalignment between stellar and dust patterns; Col.(5): The angular misalignment after correcting for inclination effect; Col.(6): Images used for the measurements.