HST Stellar Standards with 1% Accuracy in Absolute Flux
Abstract
Free of any atmospheric contamination, the Hubble Space Telescope provides the best available spectrophotometry from the far-UV to the near-IR for stars as faint as . The HST CALSPEC standard star network is based on three standard candles: the hot, pure hydrogen white dwarf (WD) stars G191B2B, GD153, and GD71, which have Hubeny NLTE model flux calculations that require the atomic physics for only one atom. These model flux distributions are normalized to the absolute flux for Vega of erg cm-2 s-1 Å-1 at 5556 Å using precise Landolt band photometry and the bandpass function corrected for atmospheric transmission by M. Cohen. The three primary WD standards provide absolute flux calibrations for FOS, STIS, and NICMOS spectrophotometry from these instruments on the HST. About 32 stellar spectral energy distributions (SEDs) have been constructed with a primary pedigree from the STIS data, which extends from 1150 Å for the hot stars to a long wavelength limit of 1 m. NICMOS grism spectrophotometry provides an extension to 1.9 m in the IR for 17 of the HST standards and longward to 2.5 m for a few of the brighter stars. Included among these HST standards are Vega, the Sloan standard BD+17∘4708, three bright solar analog candidates, three cool stars of type M or later, and five hot WDs. In addition, four K giants and four main sequence A-stars have NICMOS spectrophotometry from 0.8–2.5 m. The WD fluxes are compared to their modeled SEDs and demonstrate an internal precision of 1–2%, while the A-stars agree with the Cohen IR fluxes to 2%. Three solar analog candidate stars differ from the solar spectrum by up to 10% in the region of heavy line blanketing from 3000–4000 Å and show differences in shape of 5% in the IR around 1.8 m.
Space Telescope Science Institute, 3700 San Martin Drive, Baltimore, MD 21218
email: bohlin@stsci.edu
1. Introduction
To establish a set of stellar flux standards, one or more stars must be established with known absolute spectral energy distributions (SEDs). One method for establishing these so-called “standard candles” in the sky is to determine the composition, effective temperature, and surface gravity and then compute a model atmosphere SED. The simplest case with the best known atomic physics is for a hot pure hydrogen white dwarf (WD) star, where the temperature and gravity are determined from fits of model line profiles to the observed Balmer lines (e.g., Finley, Koester, & Basri 1997, Barstow et al. 2003). These relative SEDs become absolute when normalized to the measured flux for Vega using precise band photometry (e.g., Landolt 1992). Bohlin (2003) switched from LTE to NLTE for calculating the model flux distributions with the Hubeny TLUSTY code (Hubeny & Lanz 1995).

Following the establishment of the absolute SEDs for the primary stars, a flux distribution for another star is established by the response relative to the primaries when observed by a linear spectrometer of constant sensitivity. In practice, no such instrumentation exists, especially for ground-based observations through an atmosphere with a transparency that can vary on short time scales. Even in space, focus variations, sensitivity degradation with time, and non-linear detectors limit the precision of the transfer of the calibration from the primary standards to bright secondary standard stars. For fainter stars photon, statistics also contributes to the uncertainties.
From its installation in 1997 until its death in 2004, the low dispersion () modes of STIS were the premier instrumentation for establishing flux standards from 1150–10200 Å (Bohlin 2000; Bohlin, Dickinson, & Calzetti 2001). Considerable effort has been expended in tracking the STIS changes in sensitivity with time (Stys, Bohlin, & Goudfrooij 2004 and unpublished updates) and in correcting the CCD observations for loss of charge transfer efficiency (CTE; Goudfooij & Bohlin 2006). In the 0.8–2.5 m range, the NICMOS grism spectrophotometry has been calibrated and the count rate dependent non-linearity has been characterized by Bohlin, Lindler, & Riess (2005) and Bohlin, Riess, & de Jong (2006).
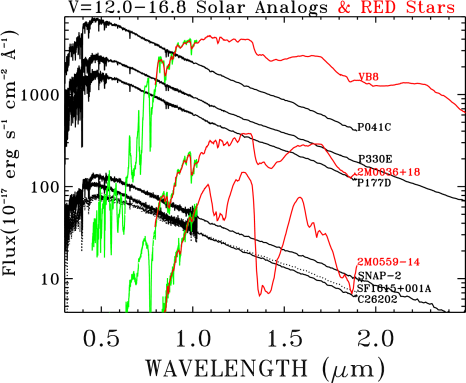
Figures 1–2 include most of the SEDs of the stars with NICMOS observations. Figure 1 shows the hotter WD stars, while Figure 2 illustrates the solar analog and cooler stars. The wavelength coverage, the spectral types, and the dynamic range are typical of the standard observational capabilities of the HST spectrographs. Because of the highly over subscribed demand for HST time, sky coverage of the HST CALSPEC standard star network is minimal.111The absolute spectral energy distributions discussed in this paper are available in digital form at http://www.stsci.edu/hst/observatory/cdbs/calspec.html.
2. White Dwarf Stars
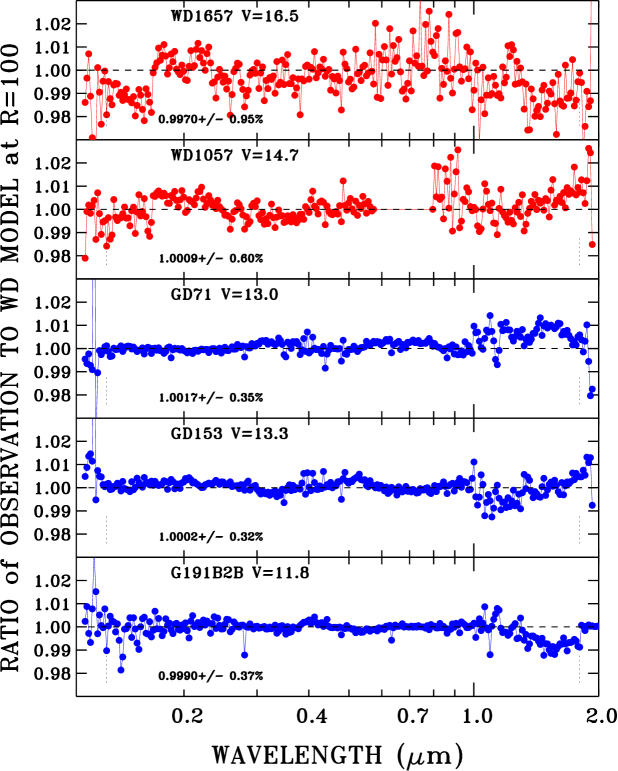
The and for the five WD stars are from Finley, Koester, & Basri (1997), who used LTE models to fit the Balmer lines. The switch to NLTE models with the same and values could cause a systematic error in the HST flux scale by as much as 2% in the IR and up to 4% in the far-UV. However, Figure 3 demonstrates internal consistency among the three primary standards to 0.5% for STIS and to 1% for the NICMOS data, so that any changes to the models must be nearly the same function of wavelength for all three stars. An effort to determine the proper NLTE and for the primary standards is underway with D. Finley and I. Hubeny and will be reported separately. This paper concentrates on a discussion of the transfer of the primary fluxes to the secondary stars. The fidelity of this instrumental transfer process is independent of any systematic adjustment of the fluxes that may arise from a revised set of NLTE models for the three primary standards.
In Figure 3 longward of Ly from 0.125 to 1 m, virtually all of the continuum points for the STIS primary standards (blue points) are within 0.3% of unity. The points that do exceed 0.3% are at the hydrogen lines or are at the positions of the interstellar/circumstellar features, such as C ii 1334 Å or Mg ii 2800 Å. G191B2B is too bright to observe with the STIS MAMA detectors; and the older FOS fluxes are used below 3850 Å, where a larger scatter is seen. There are 6 to 23 separate STIS spectra that are averaged at each wavelength for each of the three primary standards.
Longward of 1 m, only two observations of each star have been obtained with the NICMOS grisms, so that the typical NICMOS repeatability of 1% dominates the scatter. The NICMOS observation are dithered over a Y-range of 16 pixels in a relatively blemish free region in the lower left quadrant of NIC3 (Bohlin, Lindler, & Riess 2005). Due to imperfect flat fields, a larger scatter of 3% might be expected for spectra at arbitrary locations on the detector.

While the interstellar reddening is negligible for the primary standards, the fainter secondary standards suffer from a small amount of reddening, as illustrated in Figure 4 for WD1657+343. The substantially better fit in the far-UV with the LMC reddening curve than with an average Galactic reddening is a bit surprising; but such a tiny local amount of dust could be processed differently than on average in the Galaxy. Similarly for WD1057+719, the model fits the observed continuum best for an LMC reddening with . The ratio of measured fluxes to their reddened models for these two fainter WD star are shown in Figure 3, as the red points. Because the residuals for all five WD stars are within measurement uncertainties, the noise-free, reddened models define the best estimates of the standard star flux distributions at all wavelengths, except where there are interstellar lines. The Ly and Balmer lines of the models cannot be compared precisely to the observation, because the STIS line-spread function (LSF) has wide wings and is not well determined.
3. Vega
Bohlin & Gilliland (2004, BG) measured the flux for Vega using STIS spectra that are heavily saturated, but remarkably linear. Multiple observations repeat to better than 0.5%. However, small adjustments to the STIS calibration have changed the derived absolute spectrophotometry by up to 2% at the longest wavelengths, where the improved CTE correction of Goudfooij & Bohlin (2006) is the dominate reason for revising the BG results. Below 7000 Å, flux changes are 0.5%, eg. the revised V=0.023 0.008 is 0.003mag brighter in the Johnson band. The new CTE correction changes the slope in the Paschen continuum and brings the measured slope into agreement with a 9400 K model (, [M/H] , and zero microturbulent velocity) from Kurucz (2005a), as shown in Figure 5. In general, the model fluxes agree with the observed flux to 1% longward of 3200 Å, except in the Balmer confluence from 3700–3900 Å where the atomic physics is most difficult. In one region from 4200–4700 Å, the 9550 K Kurucz model adopted by BG fits better by 1%; but on the whole, the 9400 K model is now the best fit, especially below the temperature sensitive Balmer Jump and at the long wavelengths where continuity with the model is required to extend the predicted flux beyond the 1 m STIS limit. Because of the excellent agreement of the model with the observations to within the uncertainties, the model is used to define the Vega standard star flux longward of 5300 Å.222The composite Vega spectrum is a binary fits table named and is available at http://www.stsci.edu/hst/observatory/cdbs/calspec.html.
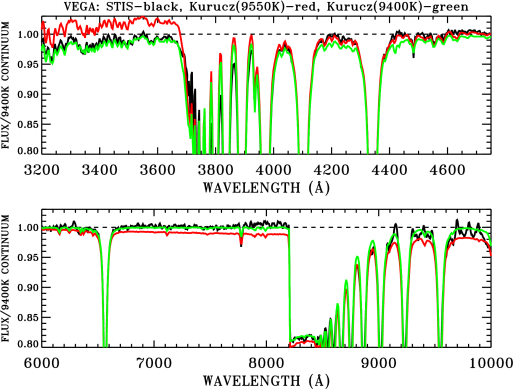
The new value of K brings the STIS results into agreement with the previously accepted Vega model that has been the IR standard per the series of papers by Cohen and co-authors beginning with Cohen et al. (1992). A new determination of the angular diameter of 3.44 mas for a rapidly rotating, pole-on model of Vega (Peterson et al. 2006) suggests that the old value of mas (Hanbury Brown et al. 1974) is wrong. The single temperature K model implies an angular diameter of 3.335 mas, while 9550 K corresponds to 3.273 mas. Aufdenberg, et al. (2006) determine an angular diameter of 3.33 mas from their rapidly rotating, pole-on model of their interferometric observations of Vega. The single temperature K Kurucz model fits the STIS SED to 1–2% from 3200–10000 Å, even though the rapid rotation produces a temperature range over the observable surface of 7900–10150 K. The continuum level of the Aufdenberg multi-temperature model agrees with the Kurucz 9400 K model from 3200–10000 Å. At longer and shorter wavelengths, a multi-temperature model may be required to achieve a 1% precision.
4. Solar Analog Stars
The use of a star of solar spectral type (G2V) as a standard flux candle relies on the assumption that the solar analog star has the same intrinsic SED as the sun. However, fundamental limitations to this technique include the facts that no star is an exact solar analog, the solar SED itself still has uncertainties of a few percent especially in the IR, and solar variations in the continuum are greater than 1% below 2500 Å (e.g., Rottman et al. 2005). Despite the drawbacks inherent in solar analogs, comparison of the sun to the HST spectra of three candidates stars helps to quantify the limitations of the technique.
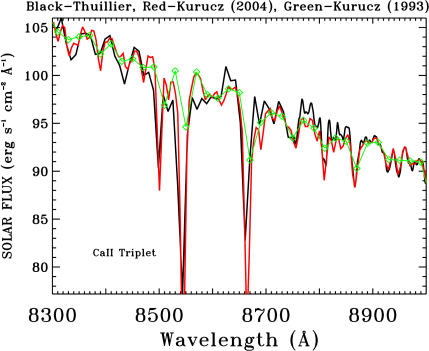
Figure 6 compares a small segment (8300–9000 Å) of the measured solar spectrum from Thuillier et al. (2003, Th03) with two versions of Kurucz models. The hi-fidelity K model (Kurucz 2004) is a high resolution computation smoothed to a resolution of , while all of the 1993 vintage Kurucz models are on a coarser wavelength grid. The observed spectral features correspond remarkably well to those in the 2004 model, although not always with exactly the predicted strengths. The green 1993 model tracks the red 2004 model well in the continuum; but the line strengths are poorly reproduced, especially for the three strongest lines in Figure 6.
The stars P041C, P177D, and P330E have spectrophotometry from STIS and NICMOS in the range 0.3–2 m, where solar variability is 1%. The compilation of the solar spectrum from Th03 covers the 0.2–2.4 m range at a resolution of 10 Å. Figure 7 shows a comparison of the measured solar analogs to Th03 in 50 Å bins, where the model is normalized to the measured fluxes at 7000–8000 Å. Below 4500 Å, there is considerable structure in the ratio, while differences are more continuous at the longer wavelengths. These continuous deviations can be significantly reduced, if small corrections for interstellar reddening and small deviations from the solar temperature are made. Bohlin, Dickinson, & Calzetti (2001) suggested that P177D and P330E are reddened by E(B-V) = 0.04 and 0.03, respectively. With a STIS calibration updated in 2006 and with the NICMOS extension, reddenings of only 0.02 and 0.01 are required to bring the ratios closer to unity, as shown in Figure 8. The Galactic average extinction curve of Savage & Mathis (1979) is used to redden the solar spectrum for the quotients shown for P177D and P330E in Figure 8.

In the case of P041C, the slope of the ratio in Figure 7 from 4500–19000 Å has the opposite sign from the slope for the other two stars and suggests that P041C is significantly hotter than the sun. The models in the Kurucz (1993) grid can be used to predict the change in slope of the continuum, even though the lines are not modeled with high fidelity. Figure 9 shows the ratio of the and 6000 K models from the 1993 grid, both of which have . The smoothed version of this ratio as scaled down by 83/250 is used to correct the P041C spectrum from 5860 K to the solar K before making its quotient that is fairly flat from 4500–12000 Å in Figure 8.

Shown in the top panel of Figure 8 is the ratio of the Kurucz (2004) model to the Th03 measured fluxes. In the IR beyond 1.2 m, the Th03 fluxes are systematically brighter than the high fidelity model by up to 5%. Price (2004) points out that the Th03 fluxes are even brighter than earlier 1–2 m solar flux measurements that were already deemed too high by Colina, Bohlin, & Castelli (1996). Th03 suggests that this brightening in comparison to the models is because the sun has “…various magnetic structures in the atmosphere….” Thus, the agreement of P330E with Th03 in the IR suggests that this star has a similarly high IR flux, while the agreement of P041C with the IR ratio of the model suggest that P041C is free of such magnetic effect. Apparently, the effects of magnetic activity in P177D is intermediate between the other two stars.

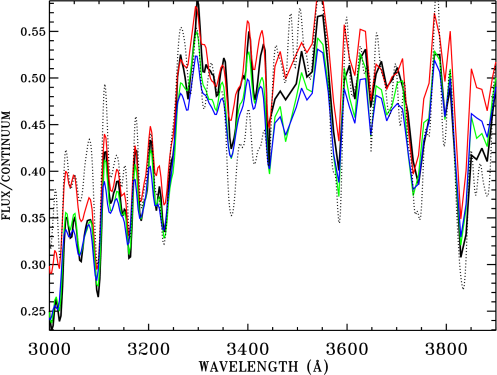
Figure 10 is constructed to understand the deviations from unity at the shorter wavelengths in Figure 8. To intercompare SEDs from the stars, the sun, and the 2004 model, all fluxes are corrected for small amounts of interstellar reddening or temperature differences as in Figure 8, normalized to the model at 7000–8000 Å, and then divided by the model continuum level, conveniently supplied along with the computed solar SED (Kurucz 2004). First of all, Figure 10 demonstrates that there is no systematic broadband calibration error or error in the average broad band computed stellar flux level, because the stars, the model, and the solar fluxes agree on average. Second, there is an excellent agreement in the detailed structure of all five spectra, which demonstrates the negligible noise level of the data and that the lines of the same chemical elements are present in the sun, the stars, and in the model. However, large differences exist in the strength of these spectra features. In particular, the (Kurucz 2004) model differs from the observations by more than 10% in some regions, e.g., at 3360–3440 Å. These model differences are due to the poor and incomplete atomic line data and to elemental abundance uncertainties, which makes “Matching [theoretical models to] observed spectra … hopeless, at least in the near future.” (Kurucz 2005b).
Even if solar analog standards cannot be made from computed models, there is the possibility of using the observed solar SED for all or parts of solar analog flux distributions. However in a region of heavy line blanketing, Figure 10 illustrates in detail why the 3000–3900 Å region differs so much from unity for the three stars in Figure 8. While the blue and green traces for P041C and P177D track each other to better than 5% everywhere in Figure 10 and to better than 2% on average, as expected from Figure 8, there are larger differences from P330E (red) and from the sun (black). Th03 quotes uncertainties of 2–3% for the solar flux. Relative errors among the stellar fluxes should be 2%, because both STIS and FOS have observed P041C, and those independently determined fluxes agree to 2% in 100 Å bins. The solar trace in Figure 10 ranges from 5%, i.e., 0.42/0.44, lower than any star at 3860 Å to about as high as P330E in the 3300–3360 Å region.
An extension of the stellar flux distributions is required longward of the NICMOS limits of 1.9 m for P041C and P177D and beyond 2.5 m for P330E, in order to compare with NICMOS photometry. The Th03 solar data extends only to 2.4 m, so that the 2004 Kurucz model must be used for the extensions. The model is normalized to the three stellar observations near the end of their respective wavelength ranges and adjusted for reddening or as in Figure 8. However, the model fluxes fit the observed IR SEDs poorly, except for P041C, so that additional errors of 5% may be present in the composite extensions that are constructed out to 3 m.333These are available at http://www.stsci.edu/hst/observatory/cdbs/calspec.html.
To summarize, the solar analog method may suffice to form crude standards at the 10% level; but G type stars with matching visible spectra can differ by a few percent, especially in regions of heavy line blanketing below 4500 Å. In the IR, intrinsic differences in the magnetic regions apparently limits the accuracy of the technique to 5%. Other types of stars are more amenable to extrapolation of the observed SEDs outside of the observed regions, e.g., compare the residuals for faint WDs in Figure 3.
5. Cohen A- and K Stars
Four main sequence A-stars and four K giants have been observed by NICMOS to provide additional flux standards for JWST calibration. Reach et al. (2005) use these eight stars as calibrators for the Spitzer IRAC, while Cohen et al. (2003) describe their provenance. In Figure 11, the NICMOS fluxes are ratioed to these standard fluxes provided by M. Cohen (private communication). In the relevant spectral range below 2.5 m, the Cohen K giant templates are based on Pickles (1998) library of observed spectra, supplemented by additional airborne observations longward of 1.22 m, as necessary, to fill gaps and to replace specious blackbody segments. The Cohen dwarf A-star templates are based on the Kurucz (1993) models with solar abundances.

Figure 11 demonstrates better agreement between the NICMOS and the Cohen A-stars, than between NICMOS and the K giants. Agreement for the A-stars is typically within 2% over 0.2 m wide bands, with an rms that is always less than 2%. Differences between the two sources of K giant fluxes are often 5% over extensive blocks of wavelength coverage, e.g., the KF06T2 ratio averages more than 1.05 from 1.8–2.5 m, while the rms of all four ratios is always greater than 2%. The excellent agreement between these two independent IR flux calibrations for the A-stars suggests that the WD models that are the basis for the NICMOS fluxes have a comparable fidelity with the Kurucz (1993) A-star models that determine the Cohen A-star SEDs. In contrast, the poorer agreement for the K giants may reflect the intrinsic cosmic scatter, e.g., the strengths of the stellar CO bands in the IR may vary substantially within the same K-giant sub-type. Reach et al. (2005) also noticed that “…the K giants are systematically offset from the A-stars…” in the IRAC calibration data and made a good decision to adopt an A-star only absolute calibration.

Despite the excellent agreement between NICMOS and the Cohen A-stars, there are some systematic differences that exceed the 1% accuracy goal. For example, the 4% dip at 1.47 m followed by a 2–4% bump in the 1.5–1.6 m region is a signature of all four A-star ratios in Figure 11. In Figure 12, all four NICMOS A-stars are rather smooth across the Brackett jump at 1.46 m, while the A-star templates show two points (diamonds connected with a dotted line) with positive slope between 1.46 and 1.47 m. Also shown as a dashed line in the A1V star panel of Figure 12 is the high fidelity Vega (A0V) model of Kurucz (2005a) normalized to the flux for 1805292. This new model with a higher density of points does agree with NICMOS SED, so that the dashed line is barely discernable, except at the longer wavelengths in the Brackett lines where the higher resolution () makes the lines much deeper than in the low resolution NICMOS spectra. The sampling of the 1993 Kurucz models is much coarser; and their sampling over the two Brackett lines near 1.61 and 1.64 m misses most of the absorption equivalent width. The old Kurucz (1993) models are not appropriate for use in regions of spectral features where the goal is to achieve a 1% precision in a SED. Until better models are available, the Cohen fluxes are adopted for extending the NICMOS fluxes below 0.8 m and above 2.5 m in the spectra.444Available at http://www.stsci.edu/hst/observatory/cdbs/calspec.html.
6. Future
To improve the CALSPEC primary WD standards, a review of the and for the NLTE models that best fit the observation is required. An independent comparison of primary standard star fluxes against laboratory irradiance standards is an even more fundamental experiment that is probably best performed by a few sounding rocket flights. See the paper by Mary Beth Kaiser in this conference proceedings.
In terms of improving the observations of secondary CALSPEC standards relative to the primary pure hydrogen WD stars, the emphasis of the HST program will be on NICMOS spectrophotometry, because STIS is no longer operational, because the IR is relatively unexplored by HST, and because IR flux standards are required for JWST and potential cosmological dark energy missions, like SNAP. More observations of the primary WDs and of the secondaries will minimize the rms NICMOS transfer errors. Now that the techniques for reducing the longest wavelength G206 grism data with its high background have been proven, more of the secondary standards should be observed in this 1.9–2.5 m range.
Acknowledgments.
Special thanks to R. Kurucz for computing the high fidelity K model SED for Vega and for comments on a draft of this paper. M. Cohen provided his SEDs for the dwarf A and K giants. J. Rhoads organized the HST observing time for the dwarf A and K giants, while R. Diaz-Miller submitted the HST phase 2 observing proposal. Primary support for this work was provided by NASA through the Space Telescope Science Institute, which is operated by AURA, Inc., under NASA contract NAS5-26555. Additional support came from DOE through contract number C3691 from the University of California/Lawrence Berkeley National Laboratory.
References
- (1) Aufdenberg, et al. 2006, Astro-ph, 0603327
- (2) Barstow, M., Good, S., Burleigh, M., Hubeny, I., Holberg, J., & Levan, A. 2003, MNRAS, 344, 562
- (3) Bohlin, R. C. 2000, AJ, 120, 437
- (4) Bohlin, R. 2003, 2002 HST Calibration Workshop, eds. S. Arribas, A. Koekemoer, and B. Whitmore (Baltimore: STScI), p. 115
- (5) Bohlin, R. C., Dickinson, M. E., & Calzetti, D. 2001, AJ, 122, 2118
- (6) Bohlin, R. C., & Gilliland, R. L. 2004, AJ, 127, 3508 (BG)
-
(7)
Bohlin, R. C., Lindler, D., & Riess, A. 2005, Instrument Science Report,
NICMOS 2005-002, (Baltimore: STScI)555These STScI internal documents can be found at one of these URLs:
http://www.stsci.edu/hst/acs/documents/isrs/, http://www.stsci.edu/hst/stis/documents/isrs/, http://www.stsci.edu/hst/nicmos/documents/isrs/. - (8) Bohlin, R. C., Riess, A., & de Jong, R. 2006, Instrument Science Report, NICMOS 2006-002, (Baltimore: STScI)5
- (9) Cohen, M., Megeath, S. T., Hammersley, P. L., Martin-Luis, F., & Stauffer, J. 2003, AJ, 125, 2645
- (10) Cohen, M., Walker, R. G., Barlow, M. J., & Deacon, J. R. 1992, AJ, 104, 1650
- (11) Colina L., Bohlin, R. C., & Castelli, F. 1996, AJ, 112, 307
- (12) Finley, D. S., Koester, D., & Basri, G. 1997, ApJ, 488, 375
- (13) Goudfrooij, P., & Bohlin, R. 2006, Instrument Science Report, STIS 2006-03, (Baltimore: STScI)5
- (14) Hayes, D. S. 1985, in Calibration of Fundamental Stellar Quantities, Proc. of IAU Symposium No. 111, eds. D. S. Hayes, L. E. Pasinetti, A. G. Davis Philip (Reidel: Dordrecht), p. 225
- (15) Hubeny, I., & Lanz, T. 1995, ApJ, 439, 875
- (16) Kurucz, R. L. 1993, CD-ROM 13, ATLAS9 Stellar Atmosphere Programs and 2km/s Grid (Cambridge: SAO)
- (17) Kurucz, R. L. 2004, http://kurucz.harvard.edu/
- (18) Kurucz, R. L. 2005a, Vega spectrum at K, , [M/H] , and zero microturbulent velocity, personal communication
- (19) Kurucz, R. L. 2005b, New atlases for solar flux, irradiance, central intensity, and limb intensity. Presented at the workshop “ATLAS12 and Related Codes” held in Trieste 11–15 July, 2005, Memorie della Socienta Astronomica Italiana Supplementi, vol. 8, pp. 158–160
- (20) Landolt, A. U. 1992, AJ, 104 340
- (21) Megessier, C. 1995, A&A, 296, 771
- (22) Peterson, D. M., et al. 2006, Nature, 440, 896
- (23) Pickles, A. 1998, PASP, 110, 863
- (24) Price, S. D. 2004, Sp. Sci. Rev., 113, 409
- (25) Reach, W. T., et al. 2005, PASP, 117, 978
- (26) Rottman, G., Harder, J., Fontenla, J., Woods, T., White, O., & Lawrence, G. 2005, Sol. Phys., 230, 205
- (27) Savage, B., & Mathis, J. 1979, ARAA, 17, 73
- (28) Stys, D. J., Bohlin, R. C., & Goudfrooij, P. 2004, Instrument Science Report, STIS 2004-04, (Baltimore:ST ScI)5
- (29) Thuillier, G., Herse, M., Labs, D., Foujols, T., Peetermans, W., Gillotay, D., Simon, P., & Mandel, H. 2003, Sol. Phys., 214, 1 (Th03)
Discussion
Freudling: The final absolute accuracy of the calibration of NICMOS spectra in your presentation was 2 to 3%. The relative calibration uncertainties for NICMOS spectra extracted from different parts of the detector are typically significantly larger than this number due to flat fielding uncertainties, pixel response function, and non-linearities. To what kind of observations does the absolute calibration apply?
Bohlin: Corrections for the pixel response function due to interpixel gaps effect the extracted four-pixel-high spectra by as much as 5% (Bohlin et al. 2005); but errors in this correction are 1%. I claim to correct for non-linearities to 1% (Bohlin, Riess, & de Jong 2006).
My sensitivity calibrations for the NICMOS grism spectra are for a small region in the lower left hand quadrant of the detector. Figure 3 shows residuals of 1% for the three primary standards for this region of the detector. An early post-cryo-cooler observation of P330E in 2002 by Roger Thompson is an average of 15 different positions over the entire NIC-3 detector. The whole detector average and my spectrum of P330E are consistent to 2%; however, flat fielding errors of 3% at any single location on NIC3 would not be surprising. A new grism flat field data cube should be obtained.
Adelman: 1) Although it is possible to fit the continuum of Vega over a fair range of wavelengths with the predictions of a single Kurucz model, it is not possible to fit the line spectrum without modeling the changes of temperature and gravity from the pole to the equator. Synthetic Vega spectra depend on factors such as the difference of the equatorial and polar temperatures, the inclination angle of the rotational axis and the equatorial velocity.
2) Besides problems due to atomic and molecular data, synthetic spectra of solar like stars longward of the Balmer confluence also change with the adopted theory of convection. What is needed to get better matches is a theory of convection which is based on real physics and physically defined boundaries. Simplified models such as mixing-length theory and its variants are bound to be inadequate.
Bohlin: 1) The measured continuum flux of Vega from 3200–10000 Å fits a single temperature Kurucz model at 9400 K to 2% and to 1% over most of this region (see Figure 5). The largest differences occur in the psuedo-continuum from 3650–4450 Å in the Balmer line confluence, where the exact physics of the hydrogen atom is still problematic. What Saul says is certainly true for the line cores at high spectral resolution.
2) No comment.