∎
Department of Physics and Astronomy
Ohio University
Athens, OH 45701
USA
Tel.: +1-740-593-1714
Fax: +1-740-593-0433
22email: mboett@helios.phy.ohiou.edu
Modeling the Emission Processes in Blazars
Abstract
Blazars are the most violent steady/recurrent sources of high-energy gamma-ray emission in the known Universe. They are prominent emitters of electromagnetic radiation throughout the entire electromagnetic spectrum. The observable radiation most likely originates in a relativistic jet oriented at a small angle with respect to the line of sight. This review starts out with a general overview of the phenomenology of blazars, including results from a recent multiwavelength observing campaign on 3C279. Subsequently, issues of modeling broadband spectra will be discussed. Spectral information alone is not sufficient to distinguish between competing models and to constrain essential parameters, in particular related to the primary particle acceleration and radiation mechanisms in the jet. Short-term spectral variability information may help to break such model degeneracies, which will require snap-shot spectral information on intraday time scales, which may soon be achievable for many blazars even in the gamma-ray regime with the upcoming GLAST mission and current advances in Atmospheric Cherenkov Telescope technology. In addition to pure leptonic and hadronic models of gamma-ray emission from blazars, leptonic/hadronic hybrid models are reviewed, and the recently developed hadronic synchrotron mirror model for TeV -ray flares which are not accompanied by simultaneous X-ray flares (“orphan TeV flares”) is revisited.
Keywords:
galaxies: active BL Lacertae objects gamma-rays: theory radiation mechanisms: non-thermalpacs:
98.62.Js 98.62.Nx1 Introduction
Blazars (BL Lac objects and -ray loud flat spectrum radio quasars [FSRQs]) are the most extreme class of active galaxies known. They have been observed at all wavelengths, from radio through very-high energy (VHE) -rays. 46 blazars have been identified with high confidence as sources of MeV emission detected by the EGRET telescope on board the Compton Gamma-Ray Observatory hartman99 ; mattox01 , and about one dozen blazars have now been detected at VHE -rays ( GeV) by ground-based atmospheric Čerenkov telescopes (ACTs). Many of the EGRET-detected -ray blazars appear to emit the bulk of their bolometric luminosity at -ray energies. Blazars exhibit variability at all wavelengths on various time scales. Radio interferometry often reveals one-sided kpc-scale jets with apparent superluminal motion.

1.1 Spectral classification of blazars
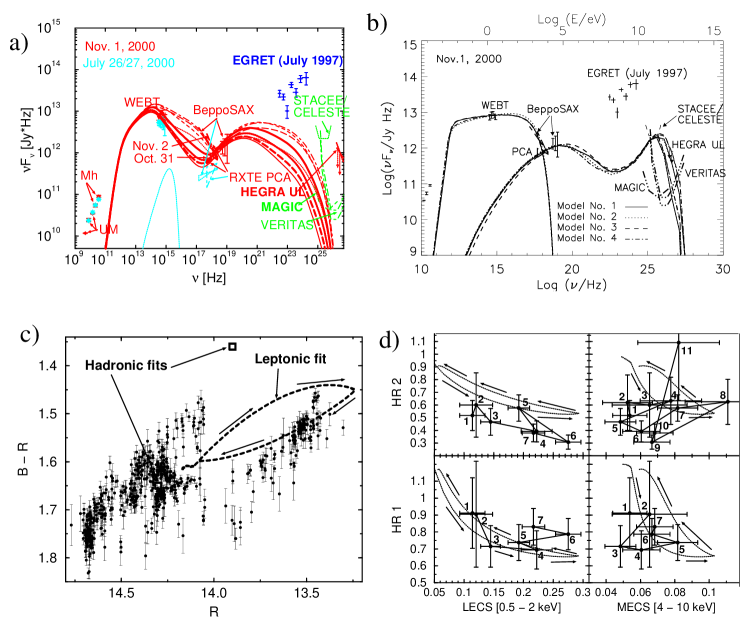
The broadband continuum spectra of blazars are dominated by non-thermal emission and consist of two distinct, broad components: A low-energy component from radio through UV or X-rays, and a high-energy component from X-rays to -rays. A sequence of blazar sub-classes, from FSRQs to low-frequency peaked BL Lac objects (LBLs) to high-frequency peaked BL Lacs (HBLs) can be defined through the peak frequencies and relative peak fluxes, which also seem to be correlated with the bolometric luminosity fossati98 . The sequence FSRQ LBL HBL is characterized by increasing peak frequencies, a decreasing dominance of the -ray flux over the low-frequency emission, and a decreasing bolometric luminosity (see Fig. 1). LBLs are intermediate between the FSRQs and the HBLs. The peak of their low-frequency component is located at IR or optical wavelengths, their high-frequency component peaks at several GeV, and the -ray output is of the order of or slightly higher than the level of the low-frequency emission. However, the existence and physical significance of this blazar sequence has recently been questioned and the apparent sequence attributed to selection effects due to the use of flux-limited samples (for a recent review see, e.g., padovani06 ).
1.2 Spectral variability of blazars
Fig. 1 already illustrates that in particular the high-energy emission from blazars can easily vary by more than an order of magnitude between different EGRET observing epochs vmontigny95 ; mukherjee97 ; mukherjee99 . However, high-energy variability has been observed on much shorter time scales, in some cases less than an hour gaidos96 .
BL Lac objects occasionally exhibit X-ray variability patterns which can be characterized as spectral hysteresis in hardness-intensity diagrams (e.g., takahashi96 ; kataoka00 ; fossati00 ; zhang02 ). This has been interpreted as the synchrotron signature of gradual injection and/or acceleration of ultrarelativistic electrons in the emitting region, and subsequent radiative cooling (e.g., kirk98 ; gm98 ; kataoka00 ; kusunose00 ; li00 ; bc02 ). While spectral hysteresis has so far only been clearly identified in HBLs, it should also occur in the soft X-ray emission of LBLs if their synchrotron component extends into the soft X-ray regime. However, LBLs are generally fainter at X-ray energies than HBLs, making the extraction of time-resolved spectral information observationally very challenging. Fig. 2d shows the results of a BeppoSAX observation of BL Lacertae in 2000 ravasio03 ; boettcher03 . Rapid flux and spectral variability of blazars is also commonly observed in the optical regime, often characterized by a spectral hardening during flares (see, e.g., Fig. 2c, or lainela99 ; villata02 ).
2 Preliminary results from 3C279 2006
The flat spectrum radio quasar 3C279 () is one of the best observed flat spectrum radio quasars, not at last because of its prominent -ray flare shortly after the launch of the Compton Gamma-Ray Observatory (CGRO) in 1991. It has been persistently detected by the Energetic Gamma-Ray Experiment Telescope (EGRET) on board CGRO each time it was observed, even in its very low quiescent states, e.g., in the winter of 1992 – 1993, and is known to vary in -ray flux by roughly two orders of magnitude maraschi94 ; wehrle98 . It has been monitored intensively at radio, optical, and more recently also X-ray frequencies, and has been the subject of intensive multiwavelength campaigns (e.g., wehrle98 ). Its broadband SEDs at several epochs are rather well determined, but a complete compilation and modeling (using a leptonic model, see §3.1) of all available SEDs simultaneous with the 11 EGRET observing epochs yielded somewhat inconclusive results hartman01a . Furthermore, in spite of the intensive past observational efforts, the broadband spectral variability of 3C 279 is still rather poorly understood (see, e.g., bednarek98 ; hartman01b ; sikora01 ; moderski03 ).
For the reasons stated above, we collmar06 proposed an intensive multiwavelength campaign in an optical high state of the 3C 279, in order to investigate its correlated radio – IR – optical – X-ray – soft -ray variability. The campaign was triggered on Jan. 5, 2006, when the source exceeded an R-band flux corresponding to R = 14.5. It involved intensive radio, near-IR (JHK), and optical monitoring by the WEBT collaboration through March of 2006, focusing on a core period of Jan. and Feb. 2006. X-ray and soft observations were carried out by all instruments on board the International Gamma-Ray Astrophysics Laboratory (INTEGRAL) during the period of Jan. 13 – 20, 2006. Additional, simultaneous X-ray coverage was obtained by Chandra and Swift XRT. These observations were supplemented by extended X-ray monitoring with the Rossi X-Ray Timing Explorer (RXTE) and VLBA monitoring at 43 GHz. The analysis of the data collected during this campaign is currently in progress. Here, first, preliminary results from this campaign are presented. Final analysis results of the WEBT (radio – IR – optical) campaign will be published in boettcher06 , while a comprehensive report on the result of the entire multiwavelength campaign will appear in collmar06 .
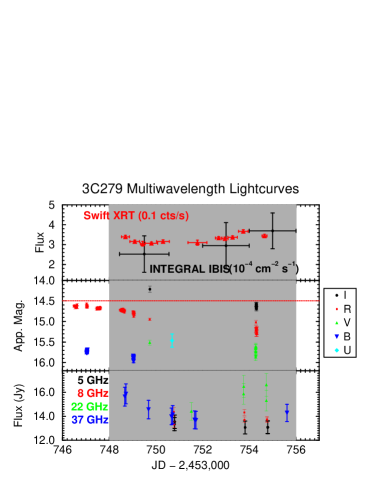
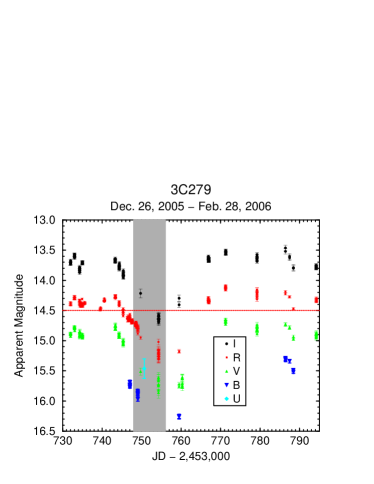
Fig. 3 shows the preliminary optical (BVRI) light curves, including about 3/4 of all collected data from the campaign. The figure illustrates that the source showed substantial, closely correlated variability in all wave bands throughout the entire core campaign. Between Jan. 8 and 15 (i.e., including the time of the INTEGRAL observations), the optical flux was persistently fading in all optical bands so that the R band flux was actually below the intended trigger threshold. However, this may not necessarily be bad news since this might allow us to study the correlated radio through X-ray flux decay time scales during a period of clean, steady decay after a major optical outburst. We might thus be able to probe energy-dependent electron cooling time scales throughout the entire synchrotron component and the low-energy part of the high-energy component (generally attributed to synchrotron-self-Compton emission in leptonic jet models, e.g., hartman01a ) of the SED of 3C279. Fig. 4 illustrates that the general trend of flux decline throughout most of the time window of the INTEGRAL observations was also shared by the high-frequency (37 GHz) radio flux, while the X-ray flux detected by Swift indicates a slowly rising trend after Jan. 14. Possible interpretations of this behavior will be discussed after the brief introduction to leptonic blazar jet models in §3.1.
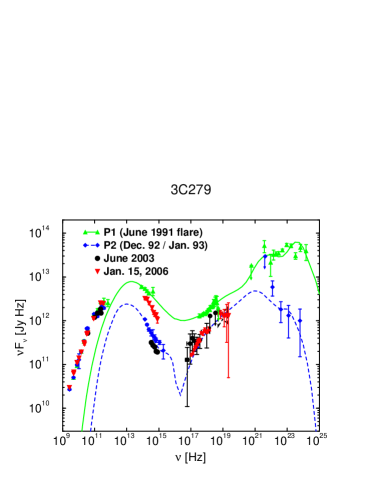
In Fig. 5, we compare a snapshot SED of 3C 279 of Jan. 15, 2006 to several other simultaneous SEDs, including the exceptional June 1991 flare and the very low, quiescent state of Dec. 1992 – Jan. 1993, as well as the time of the previous INTEGRAL observation in June 2003 collmar04 . It reveals a surprising result: Even though the optical flux is well (factor 2 – 3) above the typical low-state values, the X-ray and soft -ray fluxes and spectra are in the range of the lowest X-ray fluxes measured from the source, including the 1992/93 and 2003 quiescent states. Before we procede with a possible physical interpretation of the results from this campaign, let us briefly review the salient features of blazar jet models.
3 Blazar models
The high inferred bolometric luminosities, rapid variability, and apparent superluminal motions provide compelling evidence that the nonthermal continuum emission of blazars is produced in 1 light day sized emission regions, propagating relativistically along a jet directed at a small angle with respect to our line of sight. It is generally agreed that the low-frequency component of blazar SEDs might be synchrotron radiation from nonthermal, ultrarelativistic electrons. Several electron injection/acceleration scenarios have been proposed, e.g. impulsive injection near the base of the jet (e.g., ds93 ; dermer97 ; such a scenario might also apply to originally Poynting-flux dominated jets, see sikora05 ), isolated shocks propagating along the jet (e.g., mg85 ; kirk98 ; sikora01 ; sokolov04 ), internal shocks from the collisions of multiple shells of material in the jet spada01 , stochastic particle acceleration in shear boundary layers of relativistic jets (e.g., ob02 ; rd04 ), magnetic reconnection in Poynting-flux dominated jets (e.g., sikora05 ), or hadronically initiated pair avalanches km99 .
Significant progress has recently been made in our understanding of particle acceleration at relativistic shocks (e.g., achterberg01 ; ob02 ; no04 ; vv05 ) and the conversion of relativistic bulk kinetic energy into relativistic particles and ultimately into radiation ps00 ; schlickeiser02 ; vainio04 ; mk06 . While particle acceleration at relativistic parallel shocks might produce electron injection spectra of with (e.g., achterberg01 ), oblique shocks tend to produce much softer injection spectral indices (e.g., ob02 ). In contrast, the effect of stochastic acceleration in resonance with plasma wave turbulence behind the shock front might harden the injection index significantly, possibly even beyond vv05 . In the framework of an inhomogeneous jet with a fast inner spine and a slower, outer cocoon, particle acceleration at shear boundary layers may become the dominant acceleration mechanism ostrowski00 ; so02 ; rd04 . This may lead to the development of relativistic particle spectra with indices of and a high-energy bump around the energy where the particle acceleration rate equals the energy loss rate.
However, the lack of knowledge of the primary jet launching mechanism (poynting-flux dominated vs. magneto-hydrodynamic, see, e.g., sikora05 ) and the primary pair loading of the jet are currently severe problems in tying the properties of the particle acceleration mechanism to more fundamental physical properties of the accretion-powered disk-jet system. There is mounting evidence that — if the high-energy emission of blazars is leptonically dominated — jets of blazars might be energetically and dynamically dominated by their proton content, though pairs may still greatly outnumber protons sm00 ; gc01 ; kt04 ; sikora05
While the electron-synchrotron origin of the low-frequency emission is well established, there are two fundamentally different approaches concerning the high-energy emission. If protons are not accelerated to sufficiently high energies to reach the threshold for pion production on synchrotron and/or external photons, the high-energy radiation will be dominated by emission from ultrarelativistic electrons and/or pairs (leptonic models). In the opposite case, the high-energy emission will be dominated by cascades initiated by pair and pion production as well as proton, , and synchrotron radiation (hadronic models).
3.1 Leptonic blazar models
If protons are not accelerated to sufficiently high energies to reach the threshold for pion production on synchrotron and/or external photons, the high-energy emission will be dominated by ultrarelativistic electrons and/or pairs. In this case, high-energy emission can be produced via Compton scattering off the same ultrarelativistic electrons producing the synchrotron emission at lower frequencies. Possible target photon fields are the synchrotron photons produced within the jet (the SSC process: mg85 ; maraschi92 ; bm96 ) or external photons (the EC process). Possible sources of external seed photons are accretion-disk photons entering the jet directly ds93 or after being reprocessed in the circumnuclear material (e.g., the broad line regions of quasars) sikora94 ; dermer97 , jet synchrotron emission reflected off clouds in the circumnuclear material gm96 , infrared emission from a dust torus around the central engine blazejowski00 ; arbeiter02 . In addition, absorption, pair production, and synchrotron self absorption must be taken into account in a self-consistent leptonic blazar model. As the emission region is propagating relativistically along the jet, continuous particle injection and/or acceleration and subsequent radiative and adiabatic cooling, particle escape, and possibly also the deceleration of the jet, in particular in HBLs gk03 ; ghisellini05 , have to be considered.
As one may expect from the basic description in the previous paragraph, leptonic models (especially when considering a substantial contribution from external radiation fields as targets for Compton upscattering to -rays) require the specification of a rather large number of parameters. Several of these parameters can be estimated to a reasonable degree of accuracy from observables (see, e.g., boettcher03 for a discussion of such parameter estimates in the case of BL Lacertae during the multiwavelength campaign of 2000). In particular, there are several ways to obtain an estimate on the magnetic field in the emission region, which is an essential ingredient to also get a handle on the efficiency of Fermi and stochastic acceleration of particles in the jet.
One way to estimate the co-moving magnetic field can be found by assuming that the dominant portion of the time-averaged synchrotron spectrum is emitted by a quasi-equilibrium power-law spectrum of electrons with for ; here, is the co-moving blob volume. The normalization constant is related to the magnetic field through an equipartition parameter (in the co-moving frame). Note that this equipartition parameter only refers to the energy density of the electrons, not accounting for a (possibly greatly dominant) energy content of a hadronic matter component in the jet. Under these assumptions, the peak synchrotron flux at the dimensionless synchrotron peak energy is approximately given by
| (1) |
where is the Doppler boosting factor, cm is the the luminosity distance of the source, and G. The electron spectrum normalization used to derive Eq. 1 is based on the presence of a power-law shape with a photon energy index (with ) of the synchrotron spectrum beyond the synchrotron peak. If the SED reveals such a spectral shape, the underlying electron spectrum always has an index of . Eq. 1 then yields a magnetic-field estimate of
| (2) |
where /(10-10 ergs cm-2 s-1), , and cm is the transverse radius of the emission region. The bulk Lorentz factor and Doppler factor can usually be constrained from superluminal motion measurements and/or from constraints on the compactness of the emission region, which is an approximate measure of the optical depth to absorption. An estimate of the size of the emission region can be inferred from the minimum variability time scale, hr, as cm.
We can apply this estimate to the results of our 2006 campaign on 3C 279 described in §2. For , km s-1 Mpc-1, , and , the luminosity distance is cm. From previous work on 3C 279 (see, e.g., hartman01a for a summary) one finds typical values of , and cm. Unfortunately, the synchrotron peak seems to lie in the mm – far-IR regime of the spectrum, which was not covered during the campaign. Thus, its position is not very well constrained. Visual inspection of the SED suggest values of and Hz, corresponding to . The IR – optical (UBVRIJHK) spectral index is , which corresponds to . These values lead to a magnetic-field estimate of
| (3) |
which appears to be relatively weak compared to typical values of a few G inferred from modeling efforts on other FSRQs. The steep spectral index suggests that electrons emitting IR and optical radiation might already be in the strong cooling regime, where the radiative cooling time is shorter than the dynamical time scale. Even in that case, one would infer that electrons are injected through the primary particle acceleration mechanism with an injection index of , which would imply rather inefficient acceleration, and may point towards Fermi acceleration at oblique shocks as the primary particle acceleration mechanism (see the discussion in §3).
Although several model parameters of blazar jet models can be reasonably well constrained from the broadband spectral properties of blazars, spectral fitting alone is generally insufficient to constrain all relevant model parameters (see, e.g., the analysis in boettcher02 for the case of the LBL W Comae). Thus, it is now widely agreed that spectral and variability properties of blazars have to be taken into account simultaneously in order to extract as much physical information as possible from simultaneous multiwavelength observing campaigns.
Significant progress has been made in the past few years to combine spectral and variability modeling of blazars using leptonic models. In particular, the spectral variability of HBLs has been modelled in great detail by many authors, using pure SSC models (e.g., gm98 ; kataoka00 ; krawczynski02 ; sokolov04 . Time-dependent blazar modeling including external soft photon sources is also advancing rapidly (e.g., sikora01 ; bc02 ; kusunose03 ; sm05 ), providing tools for the interpretation of simultaneous spectral and variability data from LBLs and FSRQs. An instructive example of combined fitting of SEDs and rapid spectral variability of BL Lacertae can be found in br04 (see also Fig. 2).
In this context, one should mention an alternative way of estimating the magnetic field in blazar jets. This is based on a possible time delay between light curves at two different frequencies at which the emission is dominated by synchrotron emission. Assuming that such a delay is caused by synchrotron cooling of high-energy electrons with characteristic observed synchrotron photon energy keV to lower energies with corresponding synchrotron energy keV, the magnetic field can be estimated as:
| (4) | |||||
| (6) |
where is the ratio of energy densities in the photon field in the frame co-moving with the emission region and the magnetic field, and is the observed time delay in hours.
Our preliminary analysis of the results from the 2006 campaign on 3C 279 did not yield any evidence for time lags between any of the near-IR and optical bands. Furthermore, the SED of Jan. 15 (see Fig. 5) clearly shows that the X-ray emission is dominated by the low-energy end of the high-energy spectral component. Therefore, possible X-ray — optical delays can not be used for the estimate in Eq. 4.
The somewhat surprising apparent trend of a slow rise in the X-ray and soft -ray fluxes during the continuing optical fading trend illustrated in Fig. 4 may be interpreted in the following way: In leptonic jet models, the low-energy end of the high-frequency bump of the SEDs of blazars (which covers the X-ray band in the case of 3C 279) is generally attributed to synchrotron self-Compton emission from rather low-energy electrons. The differential number density of electrons at moderately relativistic energies will be gradually built up through the relatively long electron cooling time scale of electrons at those energies. In addition, the self-generated synchrotron photon field, serving as a target for the SSC process will also be gradually built up throughout at least the dynamical time scale. Consequently, substantial time delays of the X-ray emission behind optical flaring activity may result (see, e.g., sikora01 for a detailed discussion). This could mean that the slow rise of the X-ray flux is, in fact, the delayed response to the optical flare observed around Jan. 8, 2006. A more quantitative analysis of this interpretation will be presented in collmar06 .
3.2 Hadronic blazar models
If a significant fraction of the kinetic power in the jet is converted into the acceleration of relativistic protons and those protons reach the threshold for pion production, synchrotron-supported pair cascades will develop mb92 ; mannheim93 . The acceleration of protons to the necessary ultrarelativistic energies requires high magnetic fields of at least several tens of Gauss. In the presence of such high magnetic fields, the synchrotron radiation of the primary protons aharonian00 ; mp00 and of secondary muons and mesons rm98 ; mp00 ; mp01 ; muecke03 must be taken into account in order to construct a self-consistent synchrotron-proton blazar (SPB) model. Electromagnetic cascades can be initiated by photons from -decay (“ cascade”), electrons from the decay (“ cascade”), -synchrotron photons (“-synchrotron cascade”), and -, - and -synchrotron photons (“-synchrotron cascade”).
It has been shown in mp01 ; muecke03 that the “ cascades” and “ cascades” generate featureless -ray spectra, in contrast to “-synchrotron cascades” and “-synchrotron cascades” that produce a double-bumped -ray spectrum. In general, direct proton and synchrotron radiation is mainly responsible for the high energy bump in blazars, whereas the low energy bump is dominanted by synchrotron radiation from the primary , with a contribution from secondary electrons. Fig. 2b shows fits to the SED of BL Lacertae in 2000, using the hadronic SPB model mp01 .
3.3 Blazar unification
Leptonic models have been used successfully to reproduce simultaneous SEDs of several blazars. Spectral modeling results are now converging towards a rather consistent picture ghisellini98 ; kubo98 . The sequence HBL LBL FSRQ appears to be related to an increasing external-Compton contribution to the -ray spectrum. While most FSRQs are successfully modelled with EC models (e.g., dermer97 ; sambruna97 ; mukherjee99 ; hartman01a ), the SEDs of HBLs are consistent with pure SSC models (e.g., mk97 ; pian98 ; petry00 ; krawczynski02 ). LBLs (e.g., BL Lacertae, W Comae) often seem to require an EC component to explain their EGRET spectra sambruna99 ; madejski99 ; bb00 ; boettcher02 . One generally finds that HBLs require higher average electron energies and lower magnetic fields than LBLs and FSRQs. In the framework of a unified leptonic model, this basic parameter sequence may be related to an increasing importance of EC cooling along the sequence HBL LBL FSRQ ghisellini98 . It has been suggested that the decreasing importance of external radiation fields along the sequence FSRQ LBL HBL may be an evolutionary effect related to the gradual depletion of a limited reservoir of circumnuclear material dc01 ; cd02 ; bd02 .
Hadronic blazar models also offer a physical interpretation for the spectral sequence of BL Lac subclasses muecke03 . The spectra of HBLs are well reproduced by p-synchrotron dominated SPB models where the intrinsic primary synchrotron photon energy density is small, consistent with the low bolometric luminosity of those objects. As the synchrotron photon energy density increases towards LBL-like synchrotron properties, protons suffer increasingly strong pion production losses, and the contributions from the and synchrotron cascades become increasingly dominant at higher energies. This results in a decreasing peak frequency of the -ray component. The effect of external photon sources might further enhance the -synchrotron and -synchrotron cascade contributions, reproducing the transition to quasar-like properties.
It should be pointed out here that the blazar sequence, if real, can be explained in the framework of both leptonic and hadronic models, but it is not a prediction of either one of the classes of models. Consequently, even if future observations reveal evidence for a rather uniform distribution of peak frequencies and relative luminosities between the two main spectral components of blazars, both model variants remain generally viable.
3.4 Hybrid blazar models
The leptonic and hadronic models discussed above are certainly only to be regarded as extreme idealizations of a blazar jet. Realistically, both types of processes might play a role to some extent and should thus be considered to a comparable level of sophistication. The recent observation of isolated TeV flares without simultaneous X-ray flares (a phenomenon sometimes referred to as “orphan TeV flares”) in 1ES 1959+650 krawczynski04 and Mrk 421 blazejowski05 may, in fact, provide rather strong support for the importance of hadronic processes in objects of which other spectral and variability features are generally well reproduced by leptonic jet models, since standard leptonic SSC models predict a close temporal flux correlation between the synchrotron and Compton components. In 1ES 1959+650, the “orphan” TeV flare was preceded by an ordinary, correlated X-ray and TeV-flare, which can be generally well understood in the context of leptonic SSC models. This finding strongly suggests the need for models that explain flares dominated by leptonic interactions as well as flares where non-leptonic components might play an important role within the same system.
Hadronic processes in the context of models with leptonically dominated blazar emission have been considered by several authors, e.g.:
-
•
A ”supercritical pile” model was suggested in km99 . In this model a runaway pair production avalanche is initiated by mildly relativistic protons interacting with reflected synchrotron photons via pair production, as the primary pair injection mechanism in blazar jets. Spectral characteristics resulting from this model as applied to gamma-ray bursts have been considered in mk06 .
-
•
The conversion of ultrarelativistic protons into neutrons via pion production on external soft photons was suggested in ad03 as a mechanism to overcome synchrotron losses of protons near the base of blazar jets and, thus, to allow blazar jets to remain collimated out to kpc scales.
-
•
Focusing on applications to Gamma-ray bursts, in pw05 a fully self-consistent, time-dependent homogeneous one-zone model was developed for the radiation from a relativistic plasma which assumes electron and proton injection into a power-law distribution and includes the self-consistent cooling of protons by pion production processes and their contributions to the pair populations (and their radiative output).
-
•
In the hadronic synchrotron mirror model boettcher05 ; reimer05 , developed specifically to explain the “orphan” TeV flare phenomenon in 1ES 1959+650 mentioned above, the primary, correlated X-ray and TeV flare is explained by a standard SSC model while the secondary TeV-flare is explained by -decay -rays as a result of photomeson production from relativistic protons interacting with synchrotron photons that have been reflected off clouds located at pc-scale distances from the central engine. Since some of the numerical values in the original paper boettcher05 were in error (see the erratum), this model will be revisited and re-evaluated in the next section.
4 The hadronic synchrotron mirror model revisited
The recent “orphan” TeV flare of 1ES 1959+650 led to the development of the hadronic synchrotron mirror model boettcher05 ; reimer05 . The basic model geometry is sketched in Fig. 6. A blob filled with ultrarelativistic electrons and relativistic protons is traveling along the relativistic jet, defining the positive axis. Particles are primarily accelerated very close to the central engine (F1) in an explosive event which is producing the initial synchrotron + TeV flare via the leptonic SSC mechanism. Acceleration of relativistic particles is expected to persist throughout the further propagation of the emission region along the jet through any of the processes (internal shocks, shear layer boundary acceleration, etc.) mentioned in §3, thus leading to a sustained level of (quiescent state) UV/X-ray synchrotron emission, as observed in 1ES 1959+650 krawczynski04 . A fraction of this synchrotron radiation is reflected off a gas cloud (the mirror) located at a distance from the central engine. For the sake of analytical tractability, we assume that the mirror (M) is a homogeneous shell with a reprocessing depth .
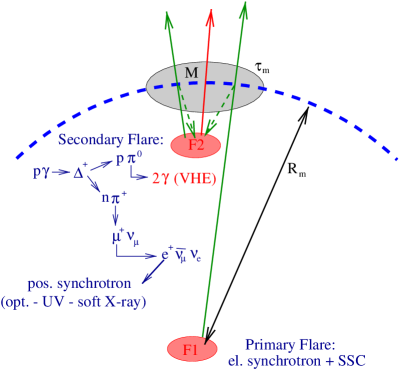
The observed time delay between the primary synchrotron flare and the secondary flare due to interactions of the blob with the first reflected synchrotron flare photons to re-enter the blob was days, and is related to the distance of the reflector by . Thus, pc. As shown in boettcher05 , a cloud of reflecting gas of typical radial extent cm and density cm-3 at this distance from the central source will result in a negligible flux in emission lines, and the expected duration of the secondary flare is hr, consistent with the observed time profile of the secondary TeV flare in 1ES 1959+650.
From the observed fluxes in synchrotron and TeV emission during the secondary TeV flare, ergs s-1 cm-2 and ergs s-1 cm-2 krawczynski04 , we find the co-moving luminosities, ergs s-1 and ergs s-1. With a blob radius of cm, this yields a co-moving synchrotron radiation field of
| (9) | |||||
The characteristics of the reflected synchrotron flux (with co-moving energy density ) have been calculated in bd98 . Using their Eq. (4) in the limit , we find
| (10) |
The co-moving luminosity from produced by protons of a given energy is then given by
| (11) |
where b is the resonance peak cross section, parametrizes the FWHM of the resonance, and is the differential number of protons at energy . With this, the observable peak flux in the TeV flare can be estimated as
| (12) | |||||
| (16) | |||||
Setting this equal to the observed VHE peak flux, we find
| (17) |
If the non-thermal proton spectrum is a straight power-law with energy index and low-energy cut-off , this corresponds to a total proton number of and a proton number density of
| (18) |
We note that, in order to bring this to a value in the range of electron densities typically invoked for leptonic jet models of blazar emission ( a few – ), a substantially higher Doppler factor, a much more compact mirror, or a flatter proton spectrum, , seems to be required. From Eq. 18, we find the total energy in relativistic protons in the blob as erg. If blobs of such relativistic plasma fill a fraction of the jet, this corresponds to a kinetic luminosity in protons of ergs s-1. These numbers indicate that orphan TeV flares as observed in 1ES 1959+650 and Mrk 410 seem to require some rather extreme conditions which might only be present at very rare occasions. This may explain why there have so far only been very few examples observed.
Acknowledgements.
This work has been supported by NASA through INTEGRAL GO (Theory) grant NNG 05GK95G, INTEGRAL GO grant NNG 06GD57G, and by the Harvard-Smithsonian Astrophysical Observatory through Chandra GO grant GO6-7101A.References
- (1) Achterberg, A., et al., MNRAS 328, 393 (2001)
- (2) Aharonian, F., New Astron. 5, 377 (2000)
- (3) Arbeiter, C., Pohl, M., & Schlickeiser, R., A&A 386, 415 (2002)
- (4) Atoyan, A., & Dermer, C. D., ApJ 586, 79 (2003)
- (5) Bednarek, W., A&A 336, 123 (1998)
- (6) Blaejowsk, M., et al., ApJ 545, 107 (2000)
- (7) Blaejowsk, M., et al., ApJ 630, 130 (2005)
- (8) Bloom, S. D., & Marscher, A. P., ApJ 461, 657 (1996)
- (9) Böttcher, M., & Chiang, J., ApJ 581, 127 (2002)
- (10) Böttcher, M., Mukherjee, R., & Reimer, A., ApJ 581, 143 (2002)
- (11) Böttcher, M., & Bloom, S. D., AJ 119, 469 (2000)
- (12) Böttcher, M., & Dermer, C. D., ApJ 501, L51 (1998)
- (13) Böttcher, M., & Dermer, C. D., ApJ 564, 86 (2002)
- (14) Böttcher, M., & Reimer, A., ApJ 609, 576 (2004)
- (15) Böttcher, M., et al., ApJ 596, 847 (2003)
- (16) Böttcher, M., ApJ 621, 176 (2005); Erratum: ApJ 641, 1233 (2006)
- (17) Böttcher, M., et al., in preparation (2006)
- (18) Cavaliere, A., & D’Elia, V., ApJ 571, 226 (2002)
- (19) Collmar, W., et al., in proc. of the 5th INTEGRAL Workshop, ESA SP-552, Eds. V. Schönfelder, G. Lichti, & C. Winkler, p. 555
- (20) Collmar, W., et al., in preparation (2006)
- (21) D’Elia, V., & Cavaliere, A., PASP 227, 252 (2001)
- (22) Dermer, C. D., & Schlickeiser, R., ApJ 416, 458 (1993)
- (23) Dermer, C. D., Sturner, S. J., & Schlickeiser, R., ApJS 109, 103 (1997)
- (24) Fossati, G., MNRAS 299, 433 (1998)
- (25) Fossati, G., ApJ 541, 166 (2000)
- (26) Gaidos, J. A., et al., Nature 383, 319 (1996)
- (27) Georganopoulos, M., & Marscher, A. P., ApJ 506, 621 (1998)
- (28) Georganopoulos, M., & Kazanas, D., ApJ 594, L27 (2003)
- (29) Ghisellini, G., et al., MNRAS 301, 451 (1998)
- (30) Ghisellini, G., & Celotti, A., MNRAS 327, 739 (2001)
- (31) Ghisellini, G., & Madau, P., MNRAS 280, 67 (1996)
- (32) Ghisellini, G., Tavecchio, F., & Chiaberge, M., A&A 432, 401 (2005)
- (33) Hartman, R. C., et al., ApJS 123, 79 (1999)
- (34) Hartman, R. C., et al., ApJ 553, 683 (2001a)
- (35) Hartman, R. C., et al., ApJ 558, 583 (2001b)
- (36) Kataoka, J., et al., ApJ 528, 243 (2000)
- (37) Kazanas, D., & Mastichiadis, A., ApJ 518, L17 (1999)
- (38) Kino, M., & Takahara, F., MNRAS 349, 336 (2004)
- (39) Kirk, J. G., Rieger, F. M., & Mastichiadis, A., A&A 333, 452 (1998)
- (40) Krawczynski, H., Coppi, P. S., & Aharonian, F., MNRAS 336, 721 (2002)
- (41) Krawczynski, H., et al., ApJ 601, 151 (2004)
- (42) Kubo, H., et al., ApJ 504, 693 (1998)
- (43) Kusunose, M., Takahara, F., & Li, H., ApJ 536, 299 (2000)
- (44) Kusunose, M., Takahara, F., & Kato, T., ApJ 592, L5 (2003)
- (45) Li, H., & Kusunose, M., ApJ 536, 729 (2000)
- (46) Lainela, M., et al., ApJ 521, 561 (1999)
- (47) Madejski, G., et al., ApJ 521, 145 (1999)
- (48) Mannheim, K., A&A 221, 211 (1993)
- (49) Mannheim, K., & Biermann, P. L., A&A 253, L21 (1992)
- (50) Maraschi, L., Celotti, A., & Ghisellini, G., ApJ 397, L5 (1992)
- (51) Maraschi, L., et al., ApJ 435, L91 (1994)
- (52) Marscher, A. P., & Gear, W. K., ApJ 298, 114 (1985)
- (53) Mastichiadis, A., & Kazanas, D., ApJ 645, 416 (2006)
- (54) Mastichiadis, A., & Kirk, J. G., 1997, A&A 320, 19 (1997)
- (55) Mattox, J. R., Hartman, R. C., & Reimer, O., ApJS 135, 155 (2001)
- (56) Moderski, R., Sikora, M., Blazejowski, M., A&A 406, 855 (2003)
- (57) Mücke, A., & Protheroe, R. J., AIP Conf. Proc. 515, 149 (2000)
- (58) Mücke, A., & Protheroe, R. J., Astropart. Phys. 15, 121 (2001)
- (59) Mücke, A., et al., Astropart. Phys. 18, 593 (2003)
- (60) Mukherjee, R., et al., ApJ 490, 116 (1997)
- (61) Mukherjee, R., et al., ApJ 527, 132 (1999)
- (62) Niemiec, J., & Ostrowski, M., ApJ 610, 851 (2004)
- (63) Ostrowski, M., MNRAS 312, 579 (2000)
- (64) Ostrowski, M., & Bednarz, J., A&A 394, 1141 (2002)
- (65) Padovani, P., these proceedings (2006)
- (66) Pe’er, A., & Waxman, E., ApJ 628, 857 (2005)
- (67) Petry, D., et al., ApJ 536, 742 (2000)
- (68) Pian, E., et al., ApJ 492, L17 (1998)
- (69) Pohl, M., & Schlickeiser, R., A&A 354, 395 (2000)
- (70) Rachen, J., & Mészáros, P., Phys. Rev. D. 58, 123005 (1998)
- (71) Ravasio, M., et al., A&A 408, 479 (2003)
- (72) Reimer, A., Böttcher, M., & Postnikov, S., ApJ 630, 186 (2005)
- (73) Rieger, F. M., & Duffy, P., ApJ 617, 155 (2004)
- (74) Sambruna, R., et al., ApJ 474, 639 (1997)
- (75) Sambruna, R., et al., ApJ 515, 140 (1999)
- (76) Schlickeiser, R., et al., A&A, 393, 69 (2002)
- (77) Sikora, M., Begelman, M. C., & Rees, M. J., ApJ 421, 153 (1994)
- (78) Sikora, M., Blazejowski, M., Begelman, M. C., & Moderski, R., ApJ 554, 1 (2001); Erratum: ApJ 561, 1154 (2001)
- (79) Sikora, M., & Madejski, G., ApJ 534, 109 (2000)
- (80) Sikora, M., et al., ApJ 625, 72 (2005)
- (81) Sokolov, A., Marscher, A. P., & McHardy, I. A., ApJ 613, 725 (2004)
- (82) Sokolov, A., & Marscher, A. P., ApJ 629, 52 (2005)
- (83) Spada, M., et al., MNRAS 325, 1559 (2001)
- (84) Stawarz, L., & Ostrowski, M., ApJ 578, 763 (2002)
- (85) Takahashi, T., et al., ApJ 470, L89 (1996)
- (86) Vainio, R., Pohl, M., & Schlickeiser, R., A&A 414, 463 (2004)
- (87) Villata, M., et al., A&A 390, 407 (2002)
- (88) Virtanen, J. J. P., & Vainio, R., ApJ 621, 313 (2005)
- (89) von Montigny, C., et al., ApJ 440, 525 (1995)
- (90) Wehrle, A. E., et al., ApJ 497, 178 (1998)
- (91) Zhang, Y. H., ApJ 572, 762 (2002)