Intracluster Medium through three years of WMAP
Abstract
Wilkinson Microwave Anisotropy Probe (WMAP) has provided us with the highest resolution all-sky maps of the Cosmic Microwave Background. As a result of thermal Sunyaev-Zel’dovich effect, clusters of galaxies are imprinted as tiny, poorly resolved dips on top of primary CMB anisotropies in these maps. Here, I describe different efforts to extract the physics of Intracluster Medium (ICM) from the sea of primary CMB, through combining WMAP with low-redshift galaxy or X-ray cluster surveys. This finally culminates at a mean (universal) ICM pressure profile, which is for the first time directly constrained from WMAP 3yr maps, and leads to interesting constraints on the ICM baryonic budget.
keywords:
cosmology , cosmic microwave background , methods: data analysis , intergalactic medium1 Introduction
Since the discovery of dark matter by Zwicky in 1937 1937ApJ….86..217Z , which was done through study of virial velocities of galaxies in clusters, galaxy clusters have been in the forefront of cosmological studies.
One of the most promising tracers of galaxy clusters is the thermal Sunyaev-Zel’dovich (SZ) effect, induced in the Cosmic Microwave Background (CMB) sky through scattering of CMB photons off hot electrons in the Intracluster Medium (ICM) sunyaev72 . Most significant properties of SZ effect as a tracer of clusters can be summarized as 2002ARA&A..40..643C :
-
•
It is proportional to the line of sight integral of the ICM pressure.
-
•
It has a characteristic frequency dependent signature which enables observers to extract it from the CMB background.
-
•
The total SZ flux of a cluster does not depend on redshift for , making SZ effect an ideal tool for making high redshift cluster surveys.
In contrast to free-free X-ray emission, which traces the square of electron density, the fact that SZ effect follows gas pressure makes it a more representative tracer of gas density, and less sensitive to small scale structure or astrophysical processes (e.g. 2006astro.ph..1133R ). Therefore, it is believed that SZ flux can be used as a reliable tracer of cluster mass with relatively low scatter.
This has motivated many SZ cluster surveys, which are expected to give a census of dark matter halo mass function at high redshifts, and thus enable novel constraints on the expansion history of the Universe 2006astro.ph..5575B .
However, despite theoretical expectations, it is not quite clear how well SZ observations can be calibrated to trace dark matter halo properties. Therefore, complementary X-ray and SZ observations, as well numerical studies are necessary to obtain a realistic picture of the ICM properties.
In this note, I outline efforts to extract the SZ effect from the highest resolution all-sky maps of CMB produced by Wilkinson Microwave Anisotropy Probe (WMAP) bennett03 ; hinshaw06 , the resulting constraints on ICM pressure profile, and comparison with other X-ray and SZ observations, as well as numerical studies.
2 Optimal SZ detection in cross-correlation

While SZ observations of a limited number of massive clusters are existent in the literature 2006astro.ph..4039L ; 2004ApJ…617..829B , due to their limited resolution and sensitivity, they have only been used to put constraints on over-all SZ flux (or gas mass) in conjunction with X-ray observations. Although WMAP has a worse resolution than the instruments commonly used to carry out SZ observations, it covers the whole sky, and thus includes SZ signatures of all the galaxy clusters in the Universe (see Fig. 1). Therefore, although the WMAP SZ signals of individual clusters have a low significance, it is possible to combine SZ signatures of many clusters to obtain constraints on the mean ICM properties.
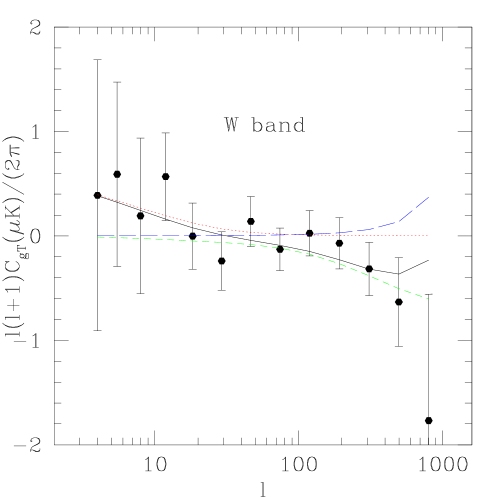
First efforts in this direction have been made through direct cross-correlation of galaxy/cluster surveys with the WMAP temperature maps bennett03 ; 2003ApJ…597L..89F ; 2004MNRAS.350L..37F ; 2004MNRAS.347L..67M ; 2004PhRvD..69h3524A . In particular, 2004PhRvD..69h3524A finds an almost detection of the thermal SZ effect through analysis of 2MASSxWMAP cross-power spectrum (Fig. 2). While these results were generally consistent with theoretical expectations, the observable signal contains a mixture of information, including non-linear galaxy bias, halo clustering, and ICM physics. Moreover, the non-Gaussian/non-linear nature of the SZ signal implies that a simple cross-power spectrum analysis is not the optimum way to unleash its full statistical significance. This became clear following the analysis of 2004MNRAS.347..403H ; 2004ApJ…613L..89H who could find for their SZ detection, through cross-correlating with a non-linear template made out of different galaxy surveys. Despite its better statistical significance, the disadvantage of the latter method was that the galaxy biasing was mixed with ICM physics in a yet more complicated way, making comparison with theory even less certain (but see 2006astro.ph..6172H ).
Is there an optimum way to extract the SZ signal of a low-resolution CMB map, using a survey of the low redshift universe, without mixing ICM physics and non-linear clustering information? Although there have been many studies of the correlation of optical properties of clusters with their dark matter halo properties, such correlations have been far from perfect. On the other hand, the temperature of the ICM diffuse X-ray emission has been shown to be a far better tracer of halo intrinsic properties111One may worry about the cyclic nature of this statement, as different physical properties (such as virial mass, gas mass, and X-ray temperature) are derived from the same X-ray observations.(e.g. see 2002ApJ…564..669A , and references therein).

This motivated our study of WMAP 1st year data ALS , where we constrained a mean (universal) model for ICM, assuming that all the ICM properties have a minimal scaling with the observed X-ray temperature of galaxy clusters. The universal ICM model in ALS assumes a polytropic ICM which is in hydrostatic equilibrium within a dark matter NFW potential nfw , and is truncated by an accretion shock at the virial radius. This only leaves the total ICM gas mass fraction (or ) as the normalization of the expected SZ signal, which we can fit for as a function of , by looking at WMAP maps within the neighborhood of a compilation 116 X-ray clusters (Fig. 3). After marginalizing over possible point source contamination, this leads to an detection of SZ effect.
3 Reconstructing the ICM mean pressure profile
Due to their limited dynamical range, none of the SZ observations of galaxy clusters have so-far been able to significantly constrain the ICM pressure profile. As a result, the interpretation of SZ observations have always relied on profiles that are either directly observed in X-rays (e.g. 2004ApJ…617..829B ; 2006astro.ph..4039L ), or are motivated by X-ray observations (e.g. our analysis of ALS , discussed above). As pointed out by 2004ApJ…617..829B ; 2004MNRAS.352.1413S , this could potentially lead to systematic discrepancies, especially if X-ray and SZ observations probe different parts of the ICM profile (e.g. 2005astro.ph.10160L ). Moreover, as X-ray emission is a non-linear function of gas density, any inference of a gas density/pressure profile is model-dependent and is thus prone to systematic biases.
Given the large dynamical range of WMAP resolution, and the high achieved in our earlier analysis ALS , it is conceivable that one could construct an ICM pressure profile by effectively stacking all the clusters that are resolved by WMAP. Following this line of thought, in ALNS , we devise a method to constrain the full mean (or universal) ICM pressure profile using the newly released WMAP 3yr CMB maps. The only remaining theoretical assumption in this approach is that the physical size of the ICM profile scales as , which is consistent with numerical simulations 2006astro.ph..3205K and high resolution X-ray observations 2006ApJ…640..691V .
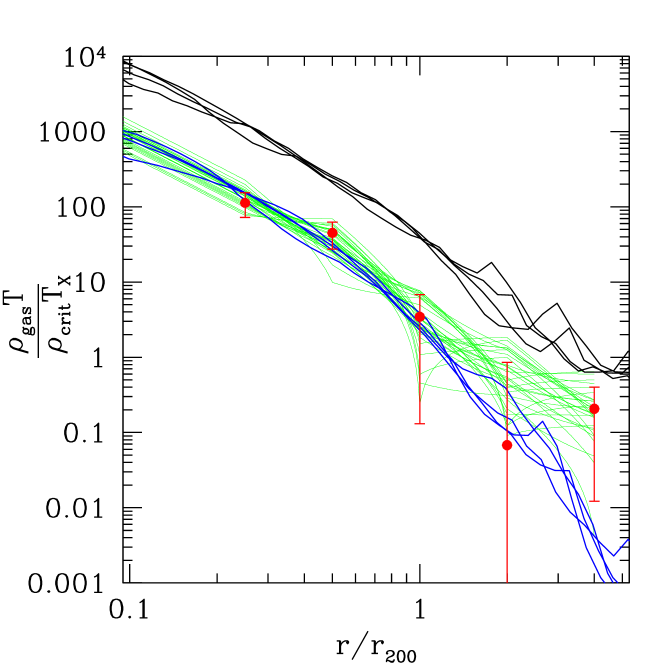
Fig. (4) shows the mean pressure profile for our most massive clusters, with , after we exclude clusters with significant point source contamination. We see that the reconstructed pressure profile (red points/green curves) are in excellent agreement with realistic hydrodynamic simulations kravtsov_etal05 ; nagai_etal06 , in the same temperature range.
4 Are we missing cluster baryons?
One of the most surprising findings of recent SZ observations (e.g. 2006astro.ph..4039L , and references therein) which is confirmed by our WMAP SZ observations at larger scales ALS ; ALNS is that about of cluster baryonic budget is missing from the Intracluster Medium. In fact, WMAP maps are the first to have enough dynamical range to show that these baryons cannot be present within the virial radius of ICM. Similar results are also seen in recent X-ray observations 2003MNRAS.344L..13E ; 2006ApJ…640..691V , while hydrodynamic simulations contain a similar gas fraction in the form of cold gas nagai_etal06 .
On the other hand, stellar mass of cluster galaxies only seems to account for of cluster baryonic budget 2003ApJ…591..749L , leaving about of the cluster baryonic budget (at level) un-accounted for. There does not seem to be a conventional solution to this new dilemma of the ICM physics ALNS .
5 Conclusions and Outlook
As the era of the next generation of CMB experiments is fast approaching, it is vital to understand the kind of signals that these experiments are expected to see, the most significant of which is the thermal SZ effect. Moreover, the SZ effect is believed to be the most efficient and robust way of detecting clusters at high redshifts, which can be used to constrain the history of dark energy in that era. To what extent these promises can be realized is the subject of on-going research and inquiry.
In this note, we argued that despite its low resolution, WMAP, as the highest resolution existing all-sky CMB map, can bring in a unique perspective into the understanding of cluster SZ properties, and ICM physics in general. However, this information can only be extracted through combination with a tracer of low redshift universe, such as galaxy surveys or X-ray cluster observations. We described different methods to exploit this SZ signal, which involve varying degrees of theoretical modeling. In particular, WMAP provides the only available observations of the ICM outskirts, and thus for the first time constrain the cluster total SZ flux (or thermal energy).
Both X-ray and SZ observations of the ICM are prone to systematics and technological limitations that could complicate or confuse their interpretation. While on-going theoretical/numerical studies go a long way in understanding these systematics, it would not be the first time that nature outdid the Astronomers’ imagination. Therefore, complementary cluster observations (and surveys) in SZ, X-rays, and gravitational lensing (along with numerical studies) is the only guaranteed way to obtain a comprehensive picture of the ICM physics, and thus be able to reliably use them as a Dark Energy machine.
The topics discussed here have been borne out of past, or on-going collaborations with Yen-Ting Lin, Yeong-Shang Loh, Daisuke Nagai, Alastair Sanderson, and Michael Strauss. I would like to thank them for continuous scientific discourse and education.
References
- (1) F. Zwicky, ApJ86 (1937) 217.
- (2) R.A. Sunyaev and Y.B. Zeldovich, Comments on Astrophysics and Space Physics 4 (1972) 173.
- (3) J.E. Carlstrom, G.P. Holder and E.D. Reese, ARA&A40 (2002) 643, astro-ph/0208192.
- (4) B.A. Reid and D.N. Spergel, ArXiv Astrophysics e-prints (2006), astro-ph/0601133.
- (5) S. Borgani, ArXiv Astrophysics e-prints (2006), astro-ph/0605575.
- (6) C.L. Bennett et al., ApJS148 (2003) 1.
- (7) G. Hinshaw et al., ArXiv Astrophysics e-prints (2006), astro-ph/0603451.
- (8) N. Afshordi et al., in preparartion (2006).
- (9) N. Afshordi, Y.T. Lin and A.J.R. Sanderson, ApJ629 (2005) 1.
- (10) S. LaRoque et al., ArXiv Astrophysics e-prints (2006), astro-ph/0604039.
- (11) B.A. Benson et al., ApJ617 (2004) 829, astro-ph/0404391.
- (12) N. Afshordi, Y.S. Loh and M.A. Strauss, Phys. Rev. D69 (2004) 083524, astro-ph/0308260.
- (13) P. Fosalba, E. Gaztañaga and F.J. Castander, ApJ597 (2003) L89, astro-ph/0307249.
- (14) P. Fosalba and E. Gaztañaga, MNRAS350 (2004) L37, astro-ph/0305468.
- (15) A.D. Myers et al., MNRAS347 (2004) L67, astro-ph/0306180.
- (16) C. Hernández-Monteagudo and J.A. Rubiño-Martín, MNRAS347 (2004) 403, astro-ph/0305606.
- (17) C. Hernández-Monteagudo, R. Genova-Santos and F. Atrio-Barandela, ApJ613 (2004) L89, astro-ph/0406428.
- (18) C. Hernandez-Monteagudo et al., ArXiv Astrophysics e-prints (2006), astro-ph/0606172.
- (19) N. Afshordi and R. Cen, ApJ564 (2002) 669, astro-ph/0105020.
- (20) J.F. Navarro, C.S. Frenk and S.D.M. White, ApJ490 (1997) 493, astro-ph/9611107.
- (21) R.W. Schmidt, S.W. Allen and A.C. Fabian, MNRAS352 (2004) 1413, astro-ph/0405374.
- (22) R. Lieu, J.P.D. Mittaz and S.N. Zhang, ArXiv Astrophysics e-prints (2005), astro-ph/0510160.
- (23) A.V. Kravtsov, A. Vikhlinin and D. Nagai, ArXiv Astrophysics e-prints (2006), astro-ph/0603205.
- (24) A. Vikhlinin et al., ApJ640 (2006) 691, astro-ph/0507092.
- (25) A.V. Kravtsov, D. Nagai and A.A. Vikhlinin, ApJ625 (2005) 588.
- (26) D. Nagai, submitted (astro-ph/0512208) (2006).
- (27) S. Ettori, MNRAS344 (2003) L13, astro-ph/0305296.
- (28) Y.T. Lin, J.J. Mohr and S.A. Stanford, ApJ591 (2003) 749, astro-ph/0304033.