Spectroscopic Identification of Massive Galaxies at with Strongly Suppressed Star Formation 11affiliation: Based on observations obtained at the Gemini Observatory, which is operated by the Association of Universities for Research in Astronomy, Inc., under a cooperative agreement with the NSF on behalf of the Gemini partnership.
Abstract
We present first results of a spectroscopic survey targeting -selected galaxies at using the GNIRS instrument on Gemini-South. We obtained near-infrared spectra with a wavelength coverage of 1.0–2.5 m for 26 -bright galaxies () selected from the MUSYC survey using photometric redshifts. We successfully derived spectroscopic redshifts for all 26 galaxies using rest-frame optical emission lines or the redshifted Balmer/4000Å break. Twenty galaxies have spectroscopic redshifts in the range , for which bright emission lines like H and [O iii] fall in atmospheric windows. Surprisingly, we detected no emission lines for nine of these 20 galaxies. The median upper limit on the rest-frame equivalent width of H for these nine galaxies is 10 Å. The stellar continuum emission of these same nine galaxies is best fitted by evolved stellar population models. The best-fit star formation rate (SFR) is zero for five out of nine galaxies, and consistent with zero within for the remaining four. Thus, both the H measurements and the independent stellar continuum modeling imply that 45% of our -selected galaxies are not forming stars intensely. This high fraction of galaxies without detected line emission and low SFRs may imply that the suppression of star formation in massive galaxies occurs at higher redshift than is predicted by current CDM galaxy formation models. However, obscured star formation may have been missed, and deep mid-infrared imaging is needed to clarify this situation.
Subject headings:
galaxies: high redshift — galaxies: evolution — galaxies: formation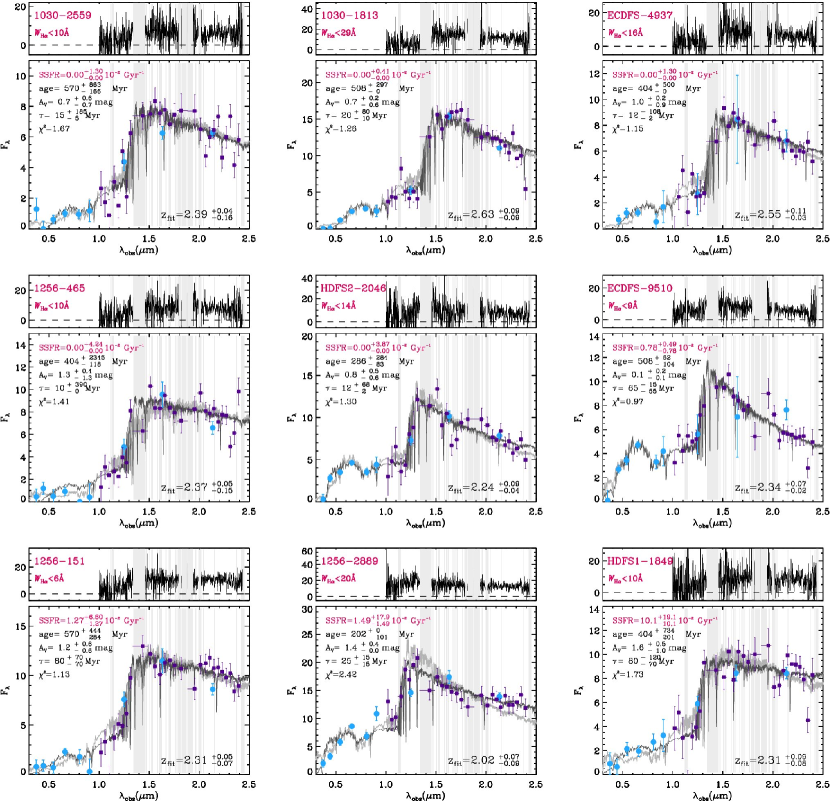
1. INTRODUCTION
Observations imply that stellar populations of high-mass galaxies were formed at higher redshift than those of low-mass galaxies (e.g., Cowie et al., 1996; Juneau et al., 2005). Recent hierarchical CDM models are able to produce dead, massive galaxies at high redshift by incorporating feed-back from active galactic nuclei (AGN; e.g., Croton et al., 2006; Bower et al., 2006; De Lucia et al., 2006; Hopkins et al., 2006). In order to observationally determine when and how star formation in massive galaxies was suppressed it is necessary to identify and study these objects out to the highest redshifts.
Recently, massive and apparently dead galaxies have been identified at (e.g., McCarthy et al., 2004; Saracco et al., 2005; Daddi et al., 2005; Labbé et al., 2005; Reddy et al., 2005, 2006; Papovich et al., 2006). Beyond most studies rely on photometric redshifts and broad-band colors to identify these galaxies. However, as dust and age have similar effects on the broad-band spectral energy distribution (SED), the star formation rates (SFRs) are often not well constrained. Furthermore, their photometric redshifts are not well calibrated, as only a few at have spectroscopic redshifts (Daddi et al., 2005). Thus spectroscopic redshifts and independent stellar population diagnostics are needed to determine the prevalence of “red and dead” galaxies beyond .
Spectroscopic confirmation of non-star-forming galaxies at is complicated due to their faint rest-frame UV emission and lack of nebular emission lines. Deep near-infrared (NIR) spectroscopy provides the best option to confirm such galaxies at , as their relatively bright rest-frame optical luminosity allows direct detection of the stellar continuum. The optical continuum shape, and in particular the Balmer/4000 Å break, can be used to derive redshifts for galaxies without emission lines, and provides independent constraints on stellar populations (Kriek et al., 2006).
To study a high-redshift spectroscopic sample that is not biased towards galaxies with bright emission lines, we are conducting a NIR spectroscopic survey of -selected galaxies with photometric redshifts . Here we report on a surprising result of our survey: the large fraction of galaxies with no detected emission lines. Throughout the letter we assume a CDM cosmology with , , and km s-1 Mpc-1. All broadband magnitudes are given in the Vega-based photometric system.
2. GALAXY SAMPLE AND DATA
The galaxies presented in this letter are drawn from the Multi-wavelength Survey by Yale-Chile (MUSYC). This survey provides optical and deep NIR photometry for several southern and equatorial fields (Gawiser et al., 2006; Quadri et al., 2006). The targets were selected in () to reduce the dispersion in stellar mass and to ensure adequate in the NIR spectra. Additionally, we required a photometric redshift in the range , for which bright rest-frame optical emission lines such as [O iii] and H fall in the and atmospheric windows. The photometric redshifts are derived following the procedure described in Rudnick et al. (2001, 2003).
We observed 26 galaxies with the Gemini near-infrared spectrograph (GNIRS) in 2004 September (GS-2004B-Q-38), 2005 May (GS-2005A-Q-20), 2006 January (GS-2005B-C-12) and 2006 February (GS-2006A-C-6). The spectra of two of these galaxies have already been presented by van Dokkum et al. (2005) and Kriek et al. (2006). All galaxies were observed in cross-dispersed mode, in combination with the short wavelength camera, the 32 line mm-1 grating (R=1000) and the 0675 by 62 slit. In this configuration we obtained a wavelength coverage of 1.0 – 2.5 . The galaxies were observed for 1-4 hours, depending on the brightness of the target and the weather conditions. The observational techniques and reduction of the GNIRS spectra are described in detail by Kriek et al. (2006). For each galaxy we extract a one-dimensional original and low resolution binned spectrum.
To derive the stellar population properties and obtain redshifts for galaxies without emission lines, we fit stellar population models to the low resolution continuum spectra together with the fluxes, following the technique described in Kriek et al. (2006). We use the Bruzual & Charlot (2003) models with a set of exponentially declining star formation histories, a Salpeter (1955) initial mass function (IMF) between 0.1 and 100 , and solar metallicity, and adopt the Calzetti et al. (2000) reddening law. The assumed model parameters (IMF, reddening law, metallicity) are identical to those used by e.g., Förster Schreiber et al. (2004), Shapley et al. (2005), and Papovich et al. (2006).
We obtained spectroscopic redshifts for all 26 galaxies using rest-frame optical emission lines or the Balmer/4000Å break. The ‘break’ redshifts have a median uncertainty of , as determined from fitting the low-resolution continua of emission line galaxies with as a free parameter. 20 of 26 galaxies have spectroscopic redshifts in the range , for which H falls in the -band. In what follows we restrict the sample to the galaxies in this redshift range; the full sample will be described elsewhere (M. Kriek et al., in preparation). We note that the six galaxies that fall out of this redshift range have .111The median of the differences between spectroscopic and photometric redshifts is only for the full sample of 26 galaxies.
3. SUPPRESSED STAR FORMATION
Surprisingly, nine out of the 20 galaxies in the sample show no emission lines in their rest-frame optical spectra. The spectra and best fits of these galaxies are presented in Fig. 1. For these galaxies we derived upper limits on the Hequivalent width () as follows. We have drawn 200 random redshifts from the redshift probability distribution, and determined the 2 upper limit of in each case from the measured noise properties, assuming a rest-frame H FWHM of 500 km s-1 (see van Dokkum et al., 2004) and the best-fit stellar continuum. The adopted limit is the maximum value found in the simulations, excluding the highest 5%. The median upper limit of these nine galaxies (corrected for Balmer absorption) is 10 Å.
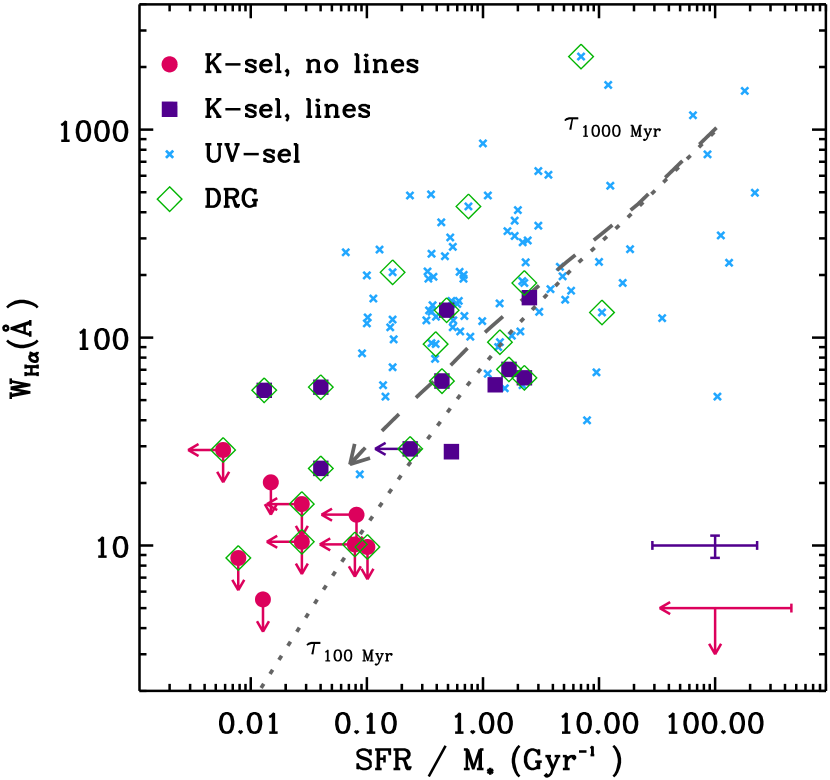
is a measure of the ratio of current to past star formation, and the limits on may imply very low SFRs in these galaxies. We investigate this in Fig. 2, in which we plot the rest-frame upper limits (corrected for Balmer absorption) versus the specific SFRs (SFR / ) derived from our model fits to the spectra. Remarkably, all nine galaxies without detected emission lines (filled red circles) are best fitted by stellar population models with low specific SFRs, and the data points are broadly consistent with the expected relations between these properties (Kennicutt, 1998; Bruzual & Charlot, 2003). For five galaxies the best-fit SFR is zero and the four remaining galaxies have best-fit values that are consistent with zero within . The midmean222mean of the central two quadrants specific and absolute SFRs are and yr respectively, significantly lower than the and yr found for the eleven emission line galaxies. Thus, both the H measurements and the stellar continuum modeling imply that the star formation in these nine galaxies has been strongly suppressed. We note that we find a similar relation when we plot vs. the modeled absolute SFR, as our galaxies span only a small range in stellar mass (). These nine galaxies have a median stellar mass of , a median color of 2.45, and have undergone a median of 21 age/ e-folding times. Six out of nine are distant red galaxies (DRGs, , Franx et al., 2003). As can be seen in Fig. 2 several of the emission line galaxies are also best fitted by stellar population models with low specific SFRs. This may suggest that the gas in these galaxies is not ionized by hot stars; we will explore this in a future paper.
Formally, we find high best-fit values for the dust content for eight out of nine galaxies without emission lines. However, is poorly constrained for most of these galaxies, and models with zero or only small amounts of dust are consistent within . We refitted all 9 galaxies allowing only models without dust. The best fits (Fig. 1, light gray) also yield low specific SFRs, ranging from , with a median value of . The median best-fit stellar age is 0.9 Gyr, which is a factor of larger than when allowing dust. While we cannot draw firm conclusions about the dust content in these galaxies, we note that high may indicate that they are still in the process of losing their gas and dust.
Figure 2 also shows the UV-selected galaxies of Erb et al. (2006a, b, c). These galaxies have similar and specific SFRs as the -selected galaxies with emission lines. However, there is no overlap with the -selected galaxies without detected H emission; both the and the modeled specific SFR are higher for the UV-selected galaxies. Although UV-selection is able to find massive galaxies (e.g., Shapley et al., 2005; Erb et al., 2006b), it does not sample the full distribution of their properties (see also van Dokkum et al., 2006).
4. DISCUSSION
We find that nine out of 20 -selected galaxies at have no detected H emission ( 10Å) and are best fit by stellar population models with low specific SFRs (), implying a fraction of galaxies with strongly suppressed star formation of %. The quoted uncertainty is derived assuming Poisson statistics, and does not include the following systematic errors and caveats. First, our selection criterion could introduce biases, as systematic errors in photometric redshift may correlate with SED type333This effect may be small, as the distribution of specific SFRs of the six objects at is similar to that of the 20 remaining objects. Also, the -band selection criterion could bias our sample, as for starburst galaxies strong emission lines can contribute significantly to the -band flux (Erb et al., 2006a). We do not expect this bias to be strong, as the median contribution of the emission lines to the -band is only 0.04 mag for the eleven emission line galaxies. Third, incompleteness may play a role, as we observed only 20% of the galaxies that meet the selection criteria. We note, however, that according to RS- and KS-tests our -selected sample has a similar distribution of rest-frame -colors as the large mass-limited sample () by van Dokkum et al. (2006), when applying the same -magnitude cut. Furthermore, the assumption that H emission is only due to star formation may lead us to underestimate the fraction.
Finally, and perhaps most importantly, we may miss star formation with very high rest-frame optical extinction. Although most local ULIRGs have high integrated (Å, Liu & Kennicutt, 1995), for some the star-burst regions are almost completely obscured (e.g., Arp 220 has Å) and these objects might be misinterpreted in our analysis. Available 24 m imaging on DRG samples shows that 30-50% have no MIPS counterpart (Webb et al., 2006; Papovich et al., 2006; Reddy et al., 2006), and Reddy et al. (2006) finds that red galaxies with low MIPS fluxes typically have low specific SFRs. To resolve this issue it is necessary to combine our spectra with deep mid/far-infrared imaging to detect hidden star formation.
It is interesting to compare our fraction of galaxies with strongly suppressed star formation to previous studies444The fractions of galaxies with suppressed star formation among DRGs and -selected galaxies are similar in our sample. Our result is consistent with the fraction found by Labbé et al. (2005), as they identified three “red and dead” galaxies from a sample of 11 DRGs in the HDF-S, and with the study of Reddy et al. (2006), who find that seven out of 24 DRGs at are not detected at 24 m, and have an average low specific SFR of 0.05 Gyr-1. However, our fraction is significantly higher than the fractions found by Daddi et al. (2004) and Papovich et al. (2006). Using the criterion, Daddi et al. (2004) identify all their 11 -selected galaxies at as star-forming galaxies. The difference may be partly explained by different definitions, as 4 of our 9 galaxies with suppressed star formation galaxies would have been identified as star-forming galaxies by the criterion. Papovich et al. (2006) finds that 10% of 153 DRGs at show no signs of current star formation. Again, the selection criteria could play a role; none of our galaxies would have been classified as “dead” by Papovich et al. (2006), as they apply the following criteria: age , , age and no X-ray or 24m detection. The sample selection could also be a factor, as the contribution of dusty star-forming galaxies to the DRG population is expected to be higher at . Furthermore, the CDF-S field – in which both the studies by Papovich et al. (2006) and Daddi et al. (2004) were performed – may be atypical (van Dokkum et al., 2006). We stress that our study is the first that is based on spectroscopic redshifts, and that this might also account for differences in the obtained fractions. This will be explored in a future paper.
We note that most current CDM galaxy formation models fail to produce the high fraction of red galaxies at the massive end as found by van Dokkum et al. (2006). One easy way to solve this is by allowing more dust in the galaxies, but we have shown here that a large fraction of galaxies has low specific SFRs, and these are generally absent in these models at (e.g., Somerville, 2004; Nagamine et al., 2005; Kang et al., 2006). Our results may indicate that the suppression of the star formation in the most massive galaxies occurs at higher redshift than has been predicted by current models. In this context, it is interesting to note that not all of the line-emission in our sample may be due to star formation: from our low-resolution GNIRS spectra it appears that several of the emission-line galaxies with low specific SFRs exhibit high [N ii]/H ratios, possibly indicating AGN. High resolution spectra of the line-emitting objects in our sample will be discussed in a future paper (M. Kriek et al., in preparation).
References
- Bower et al. (2006) Bower, R.G., et al. 2006, MNRAS, 370, 645
- Bruzual & Charlot (2003) Bruzual, G. & Charlot, S. 2003, MNRAS, 344, 1000
- Calzetti et al. (2000) Calzetti, D., Armus, L., Bohlin, R.C., Kinney, A.L., Koornheef, J., & Storchi-Bergmann, T. 2000, ApJ, 533, 682
- Cowie et al. (1996) Cowie, L.L., Songaila, A., Hu, E., & Cohen, J.G. 1996, AJ, 112, 839
- Croton et al. (2006) Croton, D.J., et al. 2006, MNRAS, 365, 11
- Daddi et al. (2004) Daddi, E., et al. 2004, ApJ, 617, 746
- Daddi et al. (2005) Daddi, E., et al. 2005, ApJ, 626, 680
- De Lucia et al. (2006) De Lucia, G., Springel, V., White, S.D.M., Croton, D., & Kauffmann, G. 2006, MNRAS, 366, 499
- Erb et al. (2006a) Erb, D.K., Shapley, A.E., Pettini, M., Steidel, C.C., Reddy, N.A., & Adelberger, K.L. 2006, ApJ, 644, 813
- Erb et al. (2006b) Erb, D.K., Steidel, C.C., Shapley, A.E., Pettini, M., Reddy, N.A., & Adelberger, K.L. 2006, ApJ, 646, 107
- Erb et al. (2006c) Erb, D.K., Steidel, C.C., Shapley, A.E., Pettini, M., Reddy, N.A., & Adelberger, K.L. 2006, ApJ 647, 128
- Förster Schreiber et al. (2004) Förster Schreiber, N.M. et al. 2004, ApJ, 616, 40
- Franx et al. (2003) Franx, M. et al. 2003, ApJ, 587, L79
- Gawiser et al. (2006) Gawiser, E. et al. 2006, ApJS, 162, 1
- Hopkins et al. (2006) Hopkins, P.F., Hernquist, L., Cox, T.J., Robertson, B., & Springel, V. 2006, ApJ, 163, 50
- Juneau et al. (2005) Juneau, S., et al. 2005, ApJ, 619, L135
- Kang et al. (2006) Kang, X., Jing, Y.P., & Silk, J. 2006, ApJ in press (astro-ph/0601685)
- Kennicutt (1998) Kennicutt, R.C. 1998, ARA&A, 36, 189
- Kriek et al. (2006) Kriek, M. et al. 2006, ApJ, 645, 44
- Labbé et al. (2005) Labbé, I. et al. 2005, ApJ, 624, L81
- Liu & Kennicutt (1995) Liu, C.T., & Kennicutt, R.C. 1995, ApJ, 450, 547
- McCarthy et al. (2004) McCarthy, P.J. et al. 2004, ApJ, 614, L9
- Nagamine et al. (2005) Nagamine, K., Cen, R., Hernquist, L., Ostriker, J.P., & Springel, V. 2005, ApJ, 627, 608
- Papovich et al. (2006) Papovich, C., et al. 2006, ApJ, 640, 92
- Quadri et al. (2006) Quadri, R., et al. 2006, submitted to ApJ (astro-ph/0606330)
- Reddy et al. (2005) Reddy, N.A., Erb, D.K., Steidel, C.C., Shapley, A.E., Adelberger, K.L., & Pettini, M. 2005, ApJ, 633, 748
- Reddy et al. (2006) Reddy, N.A., et al. 2006, 644, 792
- Rudnick et al. (2001) Rudnick, G., et al. 2001, AJ, 122, 2205
- Rudnick et al. (2003) Rudnick, G., et al. 2003, ApJ, 599, 847
- Salpeter (1955) Salpeter, E.E. 1955, ApJ, 121, 161
- Saracco et al. (2005) Saracco, P. et al. 2005, MNRAS, 357, L40
- Shapley et al. (2005) Shapley, A.E., et al. 2005, ApJ, 626, 698
- Somerville (2004) Somerville, R.S. et al. 2004, ApJ, 600, 135
- van Dokkum et al. (2004) van Dokkum, P.G. et al. 2004, ApJ, 611, 703
- van Dokkum et al. (2005) van Dokkum, P.G., Kriek, M., Rodgers, B., Franx, M., & Puxley, P. 2005, ApJ, 622, L13
- van Dokkum et al. (2006) van Dokkum, P.G., et al. 2006, ApJ, 638, L59
- Webb et al. (2006) Webb, T.M.A., et al. 2006, ApJ, 636, L17