AEGIS: A PANCHROMATIC STUDY OF IRAC-SELECTED EXTREMELY RED OBJECTS WITH CONFIRMED SPECTROSCOPIC REDSHIFTS
Abstract
We study 87 Extremely Red Objects (EROs), selected both to have color redder than , and to have confirmed spectroscopic redshifts. Together, these two constraints result in this sample populating a fairly narrow redshift range at . The key new ingredient included here is deep Spitzer Space Telescope InfraRed Array Camera (IRAC) data. Based on color, we demonstrate that it is possible to classify EROs into early-type, dusty starburst, or power-law (AGN) types. We present ultraviolet to mid-infrared spectral energy distributions (SEDs) and Advanced Camera for Surveys (ACS) images, both of which support our simple IRAC color classification.
Subject headings:
galaxies: evolution — galaxies: high-redshift — infrared: galaxies— galaxies: elliptical and lenticular, cD — galaxies: starburst1. INTRODUCTION
First discovered in the late 1980s (Elston et al., 1988), extremely red objects (EROs) are defined by their very red optical/near-infrared colors. It has been known for some time that the redness of their color constrains these galaxies to be either early-type galaxies, starburst galaxies reddened by dust, or AGN (or a combination of these three classes). However, until recently, with observations limited to -band (or shorter wavelengths), it has proven extremely challenging to accurately classify the EROs by type (Mannucci et al., 2002), even in combination with high-resolution HST imaging (Moustakas et al., 2004).
Although EROs appear to consist of a heterogeneous mix of galaxy classes, the emerging paradigm is that they may well be the high redshift counterparts and progenitors of local massive E and SO galaxies. Their reliable classification and study, especially at intermediate redshift () can provide crucial constraints on the evolution of massive, starburst, dusty and/or ultraluminous infrared galaxies (ULIRGs) known to exist at higher redshift e.g., BzKs (Daddi et al., 2004), BX/BMs (Reddy et al., 2005), Distant Red Galaxies (Franx et al., 2003; Papovich et al., 2006; Conselice, 2006, DRGs), submillimeter and IR-Luminous Lyman Break Galaxies (Huang et al., 2005; Rigopoulou, 2006, ILLBGs).
In the restframe near-IR, old stellar populations show a turndown at wavelengths longer than the restframe ‘bump’, while dusty starburst populations show emission from small hot dust grains. AGN-dominated sources display a power-law spectral energy distribution. In Wilson et al. (2004) we showed how data from Spitzer could begin to help distinguish among different ERO populations. In this paper, we extend our ERO study to take advantage of the rich panchromatic dataset available from the All-wavelength Extended Groth strip International Survey (AEGIS). All magnitudes used in this letter are AB, unless otherwise specified.
2. THE AEGIS DATASET
The Spitzer IRAC (, Fazio et al. 2004) component of the Extended Groth Strip (EGS) survey spans an area of arcmin (Huang et al. 2006, in prep: see also Huang et al. 2004; Barmby et al. 2006; Huang 2006). In conducting this ERO study, we also utilized DEEP2 spectroscopy (Davis et al. 2006, in prep), and (Ashby et al. 2006, in prep), CFHT (Coil et al., 2004), ACS and , deep Subaru (Miyazaki et al., 2002, 27.0 AB, ), (Conselice et al. 2006, in prep), and Spitzer Multiband Imaging Photometer (MIPS, Rieke et al. 2004) imaging. Further details may be found in Davis et al. (2006).
3. IRAC-SELECTED GALAXIES AND THEIR COLOR-COLOR DISTRIBUTION
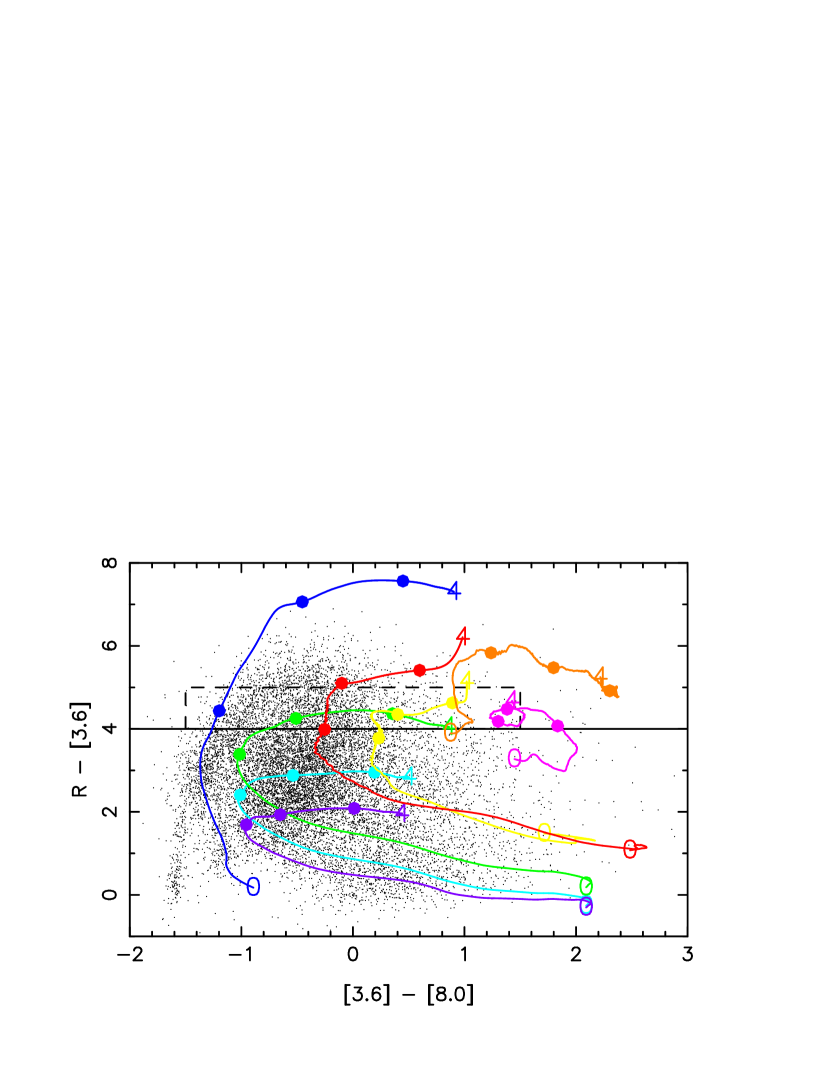
The EGS field contains galaxies detected at (23.9 AB, ). Figure 1 shows an versus color-color diagram. The black points show the -selected galaxies with both good quality Subaru and photometry.
The colored tracks on Figure 1 show the location in color-color space as a function of redshift () for eight non-evolving empirical templates (four common Coleman, Wu, & Weedman 1980 (CWW) templates [E, Sbc, Scd, Im] empirically extended to using ISO data (Huang et al., 2006, in prep), a dusty starburst template [M82], a dusty starburst/ULIRG template [Arp220], and two AGN templates [NGC 1068 and NGC 5506]). While we fully expect these templates to become increasingly inaccurate at high redshift, they do serve to provide simple insight onto the likely nature and redshift distribution of galaxies within this color-color diagram.
A distinctive swath of galaxies is clearly apparent curving from the left to the top of Figure 1 (the plume in the lower left corner is caused by stellar contamination). Notice, especially, the excellent agreement between this swath of galaxies observed in color-color space and the CWW E (blue) track to , when the template noticeably begins to diverge from the “bluer” data. We note that the predictability of the color-redshift relation for early-type galaxies can be utilized as an effective technique for detecting high redshift clusters of galaxies e.g., at in the Spitzer First Look Survey Field (Wilson et al. 2005; Muzzin et al, 2006, in prep). The SpARCS collaboration111http://spider.ipac.caltech.edu/staff/gillian/SpARCS is currently utilizing an even redder color to detect and study clusters to in the Spitzer SWIRE Legacy Fields (Wilson et al., 2006).
We define an ERO to be a galaxy redder in color than . This is the same criterion used in Wilson et al. (2004), and is a very similar selection criterion to the traditional Vega requirement (see Wilson et al. 2004 for a discussion).
From Figure 1, we might expect that only high redshift () early-type, () dusty starburst galaxies, and AGN (at any redshift) would satisfy this extremely red criterion. As we shall demonstrate in the remainder of this letter, this indeed turns out to be the case. Note that late-type CWW Scd (cyan) and irregular (purple) galaxies are never sufficiently red to be classified as an ERO at any redshift, and one would not expect to find any CWW late-type Sbc (green) EROs at .
4. REDSHIFT DISTRIBUTION OF THE SPECTROSCOPIC ERO SAMPLE
There are several thousand EROs in the EGS field. Here, we carry out a pilot study of the 87 EROs with confirmed DEEP2 spectroscopic redshifts. We use spectroscopy in this letter only for redshift determination.
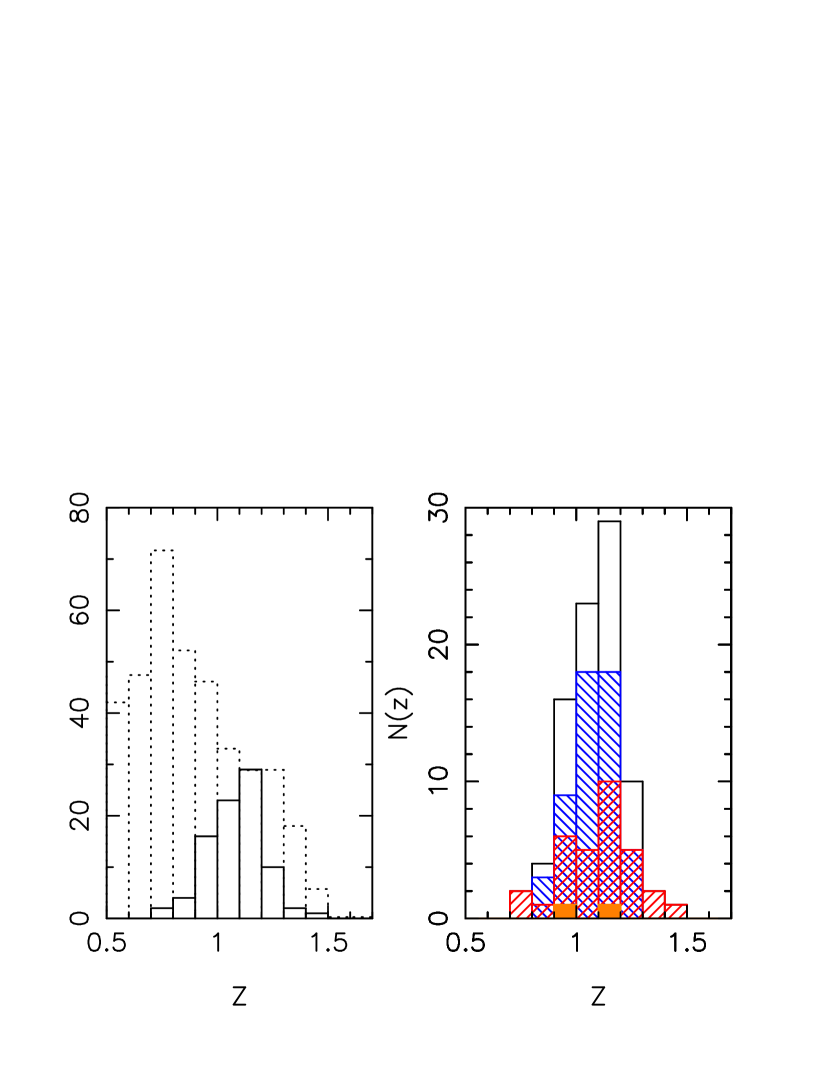
The solid black histogram in the far left panel of Figure 2 shows the redshift distribution of the 87 EROs in our sample. The EROs occupy a relatively narrow redshift range at . The dotted black histogram shows the redshift distribution of those galaxies in the DEEP2 EGS field with good quality spectroscopic redshift determinations (scaled down by a factor of 15).
The fact that none of the EROs are located at is not a DEEP2 selection effect; in EGS, DEEP2 samples the full redshift range (Faber, 2006; Willmer, 2006). It is caused by the additional ERO selection requirement, which effectively excludes low redshift galaxies (Figure 1). The DEEP2+ERO selection function also limits this sample to a fairly bright but narrow range of , with the one exception of 12007954, a 17th magnitude AGN (Le Floc’h, 2006). Note that by selecting only those EROs with spectroscopic redshifts, we may bias our sample against inclusion of any low-redshift extremely dusty galaxies (since optically faint galaxies will not pass the selection requirement of the DEEP2 survey).
5. ERO Classification Using [3.6]-[8.0] Color
It is possible to divide the EROs in this sample into three broad classes by means of their IRAC [3.6]- [8.0] color. In this section, we introduce each of these classes, show examples of their SEDs and discuss the sometime subtle features which are only apparent from such broad-baseline datasets. We also study their morphologies using ACS images.
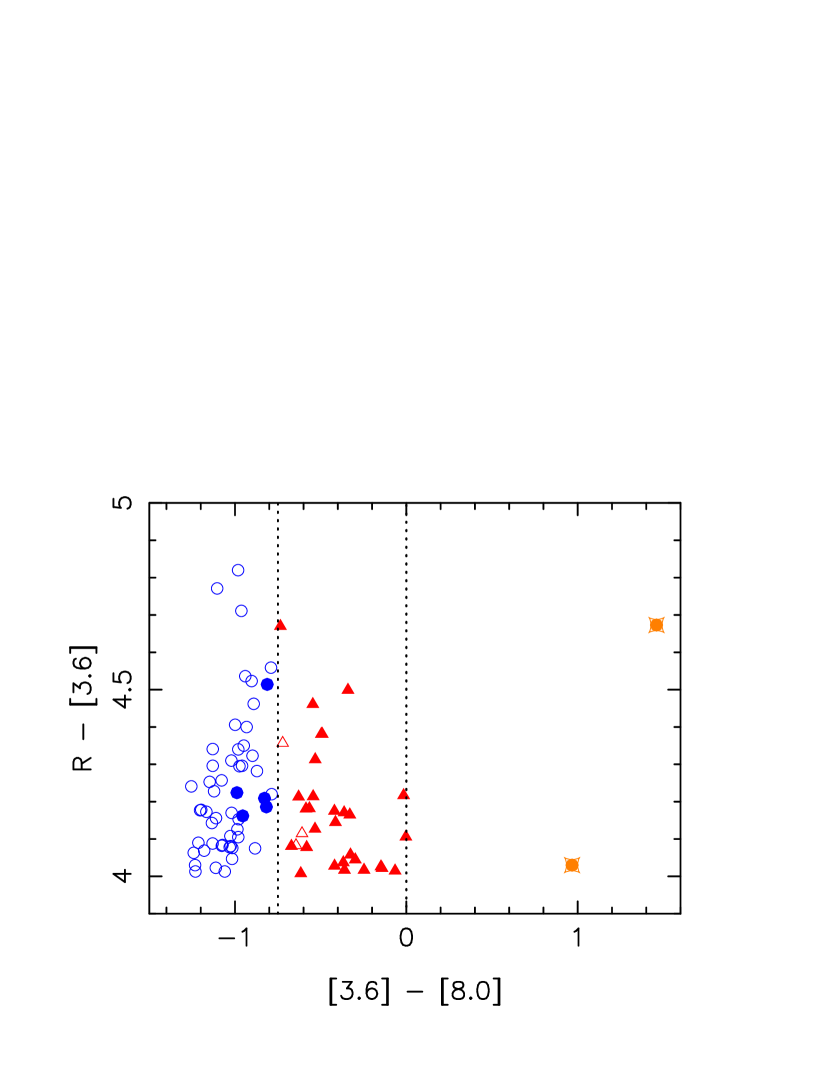
From Figure 1, early-type galaxies are expected to have the bluest () colors, dusty starburst galaxies intermediate colors (), and AGN reddest colors (). The right panel of Figure 2 corresponds to the dashed rectangle in Figure 1 and shows the subsample of 87 EROs with spectroscopic redshifts. We classify galaxies as bulge-dominated early types (blue circles), galaxies as dusty starburst222We use the word “starburst” to mean a galaxy whose IR luminosity is powered by star formation. We do not intend to imply these galaxies have total IR luminosity µm. Indeed, as we shall discuss in § 7 most of these dusty starburst EROs would actually be classified as LIRGs. (red triangles) and [ galaxies as power-law AGN types (orange boxes). As we shall demonstrate, these two simple color cuts do separate the classes rather well. This is because the redshift distribution of this particular sample is rather narrow. For a sample spanning a broader redshift distribution, one might imagine utilizing a more complex color selection to isolate the meanderings of the different populations through color-color space in Figure 1.
We classify 53 of the EROs as early types. They are located at and their redshift distribution is shown by the blue hatching in the middle panel of Figure 2. We classify 32 EROs as being dusty starburst types. The dusty starburst population (shown by the red hatching) has a slightly wider redshift distribution from (presumably because galaxies in this class can contain arbitrary amounts of dust). We classify two EROs as being predominantly power-law types. These are 12007878 at and 12007954 at , and are shown in solid orange (see also Konidaris 2006).
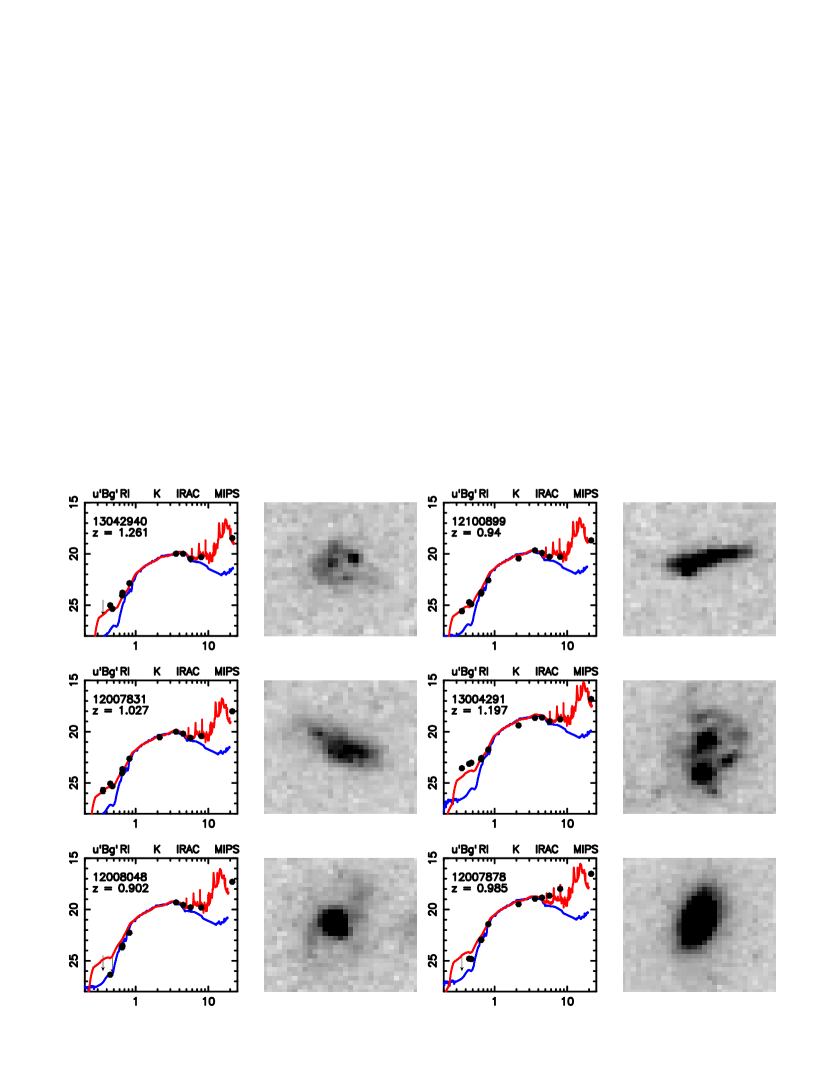
6. Example Spectral Energy Distributions and ACS Images
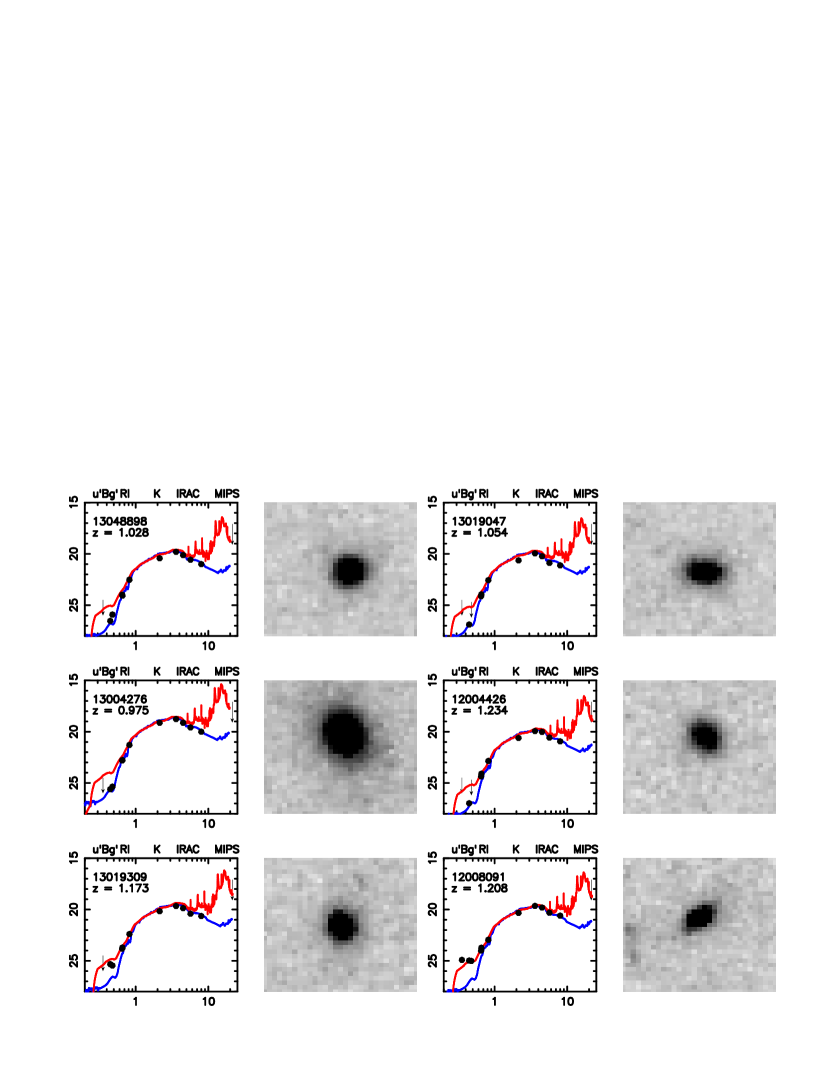
Figures 3 and 4 (Plate 1) show examples of observed SEDs and -band (F814W) postage stamp ACS images. For comparison, also shown are CWW E (blue) and M82 (red) templates (§ 3) as they would appear at the redshift of each ERO. At , IRAC’s channel measures any emission from small hot dust grains (indicative of a dusty starburst galaxy) while the channel measures the stellar peak. A relative red (or blue) color, therefore, can be used to discriminate for (or against) dusty starburst galaxies (and AGN) at this redshift.
6.1. Early-Type EROs
Figure 3 (Plate 1) shows six examples of galaxies IRAC color-classified as early-type EROs. The CWW E template approximates the 13048898, 13019047, 13004276, and 12004426 SEDs very well. The CWW E template appears to underestimate the SEDs of 13019309 and 12008091 in the UV. In all cases the ACS images show clear evidence of bulge-dominated morphologies, supporting our color classification as early types.
A total of 35 of the 53 early-type EROs fall within the ACS footprint. A close inspection of all of the available ACS images reveals them to be predominantly bulge-dominated (E, S0 or Sa-type spirals). A small number () appear to be undergoing mergers. We conclude that choosing a blue [3.6]-[8.0] color successfully selects for EROs with old stellar populations and against those with dusty starburst or power-law features.
6.2. Dusty Starburst and Power-Law EROs
Figure 4 (Plate 1) shows five examples of galaxies IRAC color-classified as dusty starburst EROs, and one power-law ERO (12007878). The M82 template approximates the SEDs of sources 13042940, 12100899, and 12007831 very well, and that of 13004291 reasonably well. In addition to being more mid-IR luminous than an early-type ERO of similar magnitude, the SEDs of these four sources are more luminous in the optical. Their ACS images show clear evidence of disturbed, peculiar, interacting or merging galaxies.
Neither template approximates well the SED of 12008048. Close inspection of the ACS image reveals it to be a face-on spiral galaxy. Since a normal spiral at would not meet the redness criterion, we infer that 12008048 must be an especially dusty spiral.
A total of 17 of the 32 EROs we classify as dusty starbursts fall within the ACS footprint. Close inspection of all of their images reveals many of them () to be disturbed or interacting galaxies, and the remainder () to be late-type spirals.
12007878 shows a monotonically increasing power-law SED. Its host galaxy is clearly bulge-dominated and it can be unequivocally classified as an AGN-dominated source.
7. DISCUSSION
Turning to those EROs which have detections, there are five () amongst the 53 early-type and 29 () amongst the 32 dusty starburst EROs. Both power-law EROs have a detection (14.5 and 16.5). In four out of the five cases of early-type EROs with a detection, an ACS image is available. In all four cases, a merging galaxy with several close neighbors is apparent. The MIPS point-spread function is so it is possible that the signal in each case might be associated with another galaxy entirely.
We use Le Floc’h et al. (2005, Fig. 7) to translate our flux limit (80uJy, 19.1 AB, ) into a lower limit on the total detectable IR luminosity of an ERO in our redshift range. Depending on the model used, at , we are capable of detecting sources more luminous than i.e., some dusty starbursts, and all LIRGS and ULIRGS. At , we are capable of detecting sources more luminous than i.e., LIRGS and ULIRGS. Based on their actual magnitudes and redshifts, most of our “starburst” sources have intrinsic luminosities between and , i.e., LIRG class. Both of the “AGN” sources have intrinsic luminosities of , putting them in the ULIRG class.
Although, in this study, we utilized optical/IRAC colors to classify our ERO sample, IRAC-[24] color selection may be a more effective discriminator at higher redshift (Lacy et al., 2004; Ivison et al., 2004; Sajina et al., 2005).
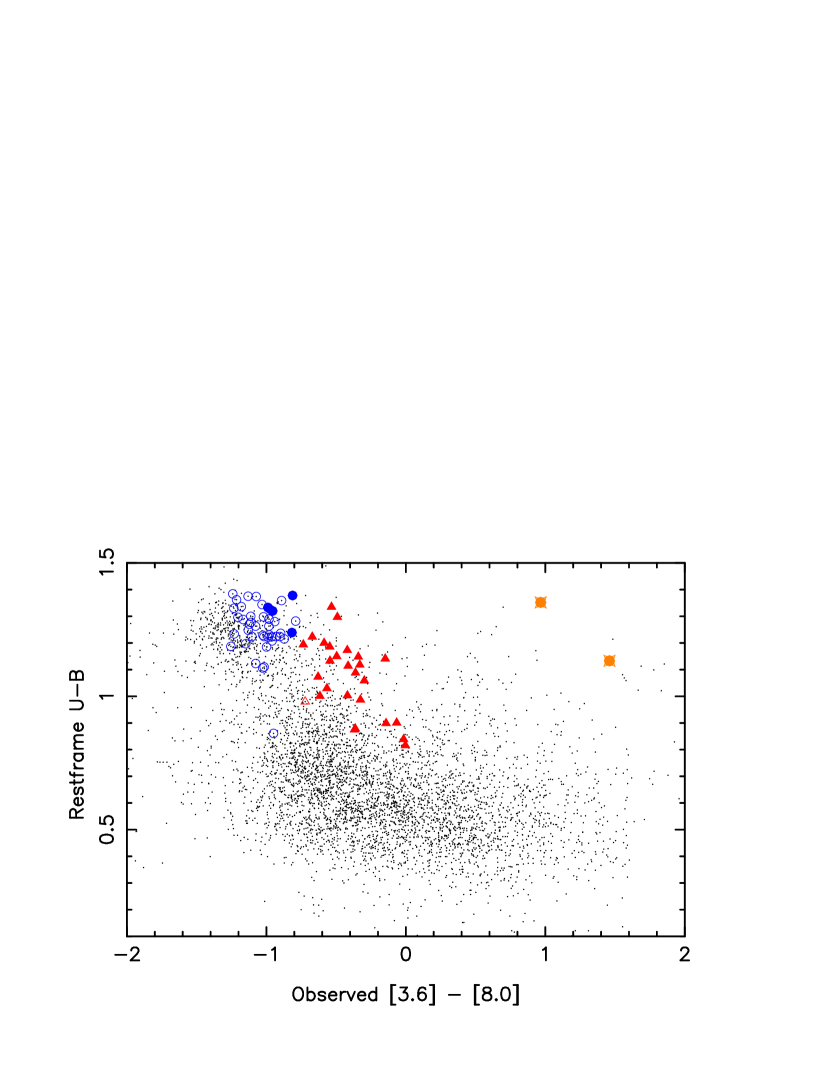
Putting IRAC ERO colors in the context of perhaps more familiar restframe optical colors, Figure 5 shows restframe color versus observed color for all IRAC-detected galaxies with good [8.0] and good CFHT BRI photometry (see Willmer et al. 2006 for details of the conversion to restframe ). The symbols are as in Figure 2. The filled circles in Figure 5 denote the 36 EROs which are also detected at (see also Figure 2). The EROs we classify as early types generally tend to lie on the defined “red-sequence” and the EROs we classify as dusty starburst tend to lie in the “green valley” and at the top of the “blue cloud” (Weiner et al., 2005).
8. CONCLUSIONS
In this paper, we utilized the AEGIS dataset to explore the nature of 87 EROs with confirmed spectroscopic redshifts. IRAC imaging facilitated dividing this sample into three distinct classes using a simple [3.6] -[8.0] color selection technique. We presented SEDs and high-resolution ACS images supporting our (early-type, dusty starburst or power-law) classification.
We showed that the three classes of ERO and their redshift distribution were broadly consistent with what one would expect from a simple color-color diagram (Figure 1). We found 53 early-types, 32 dusty starbursts/LIRGs, and two obvious AGN. Both of these AGN would be classified as ULIRGs.
The selection of this particular sample of EROs was subject to the spectroscopic biases discussed in § 4. We next plan to extend this study to the several thousand IRAC-selected EROs in the AEGIS without spectroscopic redshifts.
References
- Barmby et al. (2006) Barmby, P., et al. 2006, ApJ, 642, 126
- Coil et al. (2004) Coil, A. L, et al., 2004, ApJ, 617, 765
- Coleman et al. (1980) Coleman, G. D., et al., 1980, ApJS, 43, 393
- Conselice (2006) Conselice. 2006, et al., this volume
- Daddi et al. (2004) Daddi, E., et al., 2004, ApJ, 617, 746
- Davis et al. (2006) Davis, M., et al., 2006, this volume
- Elston et al. (1988) Elston, R., Rieke, G. H., & Rieke, M. J. 1988, ApJ, 331, L77
- Faber (2006) Faber. 2006, et al., in press
- Fazio et al. (2004) Fazio, G. G., et al. 2004, ApJS, 154, 10
- Franx et al. (2003) Franx, M., et al. 2003, ApJ, 587, L79
- Huang (2006) Huang. 2006, et al., this volume
- Huang et al. (2004) Huang, J.-S., et al. 2004, ApJS, 154, 44
- Huang et al. (2005) Huang, J.-S., et al. 2005, ApJ, 634, 137
- Ivison et al. (2004) Ivison, R. J., et al. 2004, ApJS, 154, 124
- Konidaris (2006) Konidaris, N. 2006, et al., this volume
- Lacy et al. (2004) Lacy, M., et al. 2004, ApJS, 154, 166
- Le Floc’h et al. (2005) Le Floc’h, E., et al. 2005, ApJ, 632, 169
- Le Floc’h (2006) Le Floc’h. 2006, et al., this volume
- Mannucci et al. (2002) Mannucci, F., 2002, MNRAS, 329, L57
- Miyazaki et al. (2002) Miyazaki, S., et al. 2002, PASJ, 54, 833
- Moustakas et al. (2004) Moustakas, L. A., et al. 2004, ApJ, 600, L131
- Papovich et al. (2006) Papovich, C., et al. 2006, ApJ, 640, 92
- Reddy et al. (2005) Reddy, N. A., Erb, D. K., Steidel, C. C., Shapley, A. E., Adelberger, K. L., & Pettini, M. 2005, ApJ, 633, 748
- Rieke et al. (2004) Rieke, G. H., et al. 2004, ApJS, 154, 25
- Rigopoulou (2006) Rigopoulou. 2006, in press, (astro-ph/0605355)
- Sajina et al. (2005) Sajina, A., Lacy, M., & Scott, D. 2005, ApJ, 621, 256
- Weiner et al. (2005) Weiner, B. J., et al. 2005, ApJ, 620, 595
- Willmer (2006) Willmer. 2006, et al., in press
- Wilson et al. (2004) Wilson, G., et al. 2004, ApJS, 154, 107
- Wilson et al. (2005) Wilson, G., Muzzin, A., & Lacy, M. 2005, ‘Spitzer Space Telescope: New Views of the Universe’ conference (astro-ph/0503638)
- Wilson et al. (2006) Wilson, G., et al. 2006, ‘Spitzer Space Telescope: Infrared Diagnostics of Galaxy Evolution’ conference (astro-ph/0604289)