Variability in red supergiant stars: pulsations, long secondary periods and convection noise
Abstract
We study the brightness variations of galactic red supergiant stars using long-term visual light curves collected by the American Association of Variable Star Observers (AAVSO) over the last century. The full sample contains 48 red semiregular or irregular variable stars, with a mean time-span of observations of 61 years. We determine periods and period variability from analyses of power density spectra and time-frequency distributions. We find two significant periods in 18 stars. Most of these periods fall into two distinct groups, ranging from a few hundred to a few thousand days. Theoretical models imply fundamental, first and possibly second overtone mode pulsations for the shorter periods. Periods greater than 1000 days form a parallel period-luminosity relation that is similar to the Long Secondary Periods of the Asymptotic Giant Branch stars. A number of individual power spectra shows a single mode resolved into multiple peaks under a Lorentzian envelope, which we interpret as evidence for stochastic oscillations, presumably caused by the interplay of convection and pulsations. We find a strong noise component in the power spectra that is remarkably similar in almost all stars of the sample. This behaviour fits the picture of irregular photometric variability caused by large convection cells, analogous to the granulation background seen in the Sun.
keywords:
stars: late-type – stars: supergiants – stars: oscillations – stars: evolution1 Introduction
Red supergiants (RSGs) are evolved, moderately massive (10–30 M⊙) He-burning stars. As such, they are key agents of nucleosynthesis and chemical evolution of the Galaxy, and have also long been known for their slow optical variations. This variability is usually attributed to radial pulsations (Stothers 1969, Wood, Bessell & Fox 1983, Heger et al. 1997, Guo & Li 2002), although irregular variability caused by huge convection cells was also suggested from theory (Schwarzschild 1975, Antia et al. 1984) and observations (e.g. Tuthill, Haniff & Baldwin 1997). The presence of oscillations, in principle, offers the possibility of asteroseismology, i.e. measuring frequencies of stars and then identifying the modes of pulsations via comparing the observations to theoretical models. However, the time scales involved in RSGs makes this approach very difficult. Model calculations predict pulsational instability for fundamental and low-order overtone modes (Stothers 1972, Wood, Bessell & Fox 1983, Heger et al. 1997, Guo & Li 2002), with fundamental periods ranging from 150 to 4,000 days. Consequently, any meaningful period determination may require decades of observations. Here we analyse a homogeneous sample of RSG light curves with a typical time-span of over 22,000 days, which is the longest available observational data for these objects.
Significant interest in RSG pulsations was driven by the discovery of their distinct period-luminosity (P–L) relation. Although the relation is not as tight as for Cepheids or red giant stars, various authors pointed out that because of their great intrinsic brightnesses, RSGs might be useful as extragalactic distance indicators (e.g. Glass 1979, Feast et al. 1980, Wood & Bessell 1985). A recent example is that of Pierce et al. (2000), who re-calibrated the RSG P–L relation in the near-infrared and then measured the distance to M101 from 42 RSGs in that galaxy (Jurcevic et al. 2000). In this respect, galactic RSGs that are members of young O–B associations are particularly important because they can serve as local calibrators of the P–L relation – provided that reliable periods can be measured. Establishing this zero point is one of the by-products of this paper.
Until recently, there was a serious discrepancy between evolutionary models and the empirical Hertzsprung–Russell diagram of RSGs. In particular, stellar evolutionary models seemed unable to produce RSGs that are as cool or as luminous as observed (Massey 2003, Massey & Olsen 2003). A solution was found by Levesque et al. (2005), who derived a new (hotter) temperature scale from optical spectrophotometry for 74 Galactic RSGs, so that most of the discrepancy was removed. In addition, Massey et al. (2005) argued that circumstellar dust around RSGs may account for many magnitudes of extra extinction compared to other stars in the same O–B associations, so that determining fundamental physical parameters can be quite difficult even for the brightest RSGs. The problem is very well illustrated, for instance, by the peculiar RSG VY CMa, for which previous radius estimates of up to 2,800 R⊙ (Smith et al. 2001) were scaled down to 600 R⊙ (Massey, Levesque & Plez 2006), due to the hotter temperature scale alone. These wildly different parameter values could be tested if pulsation mode identification was made possible, which is another motivation for this work.
In the General Catalogue of Variable Stars (GCVS, Kholopov et al. 1985-1988) there are two categories of variable RSGs: SRc and Lc. SRc type stars are semiregular late-type supergiants with amplitudes of about 1 mag and periods from 30 days to several thousand days. In contrast, Lc type stars are irregular variable supergiants having visual amplitudes of about 1 mag. As the distinction between semiregular and irregular behaviour is not well defined in the literature, stars in both categories can possibly reveal important information. So far, the most detailed study of bright galactic RSG variables as a group was that by Stothers & Leung (1971), who discussed periods, luminosities and masses for 22 stars. Their periods were either taken from papers published in the 1950s or (for 8 stars) determined by the authors using visual data. For some stars, such as Ori, Her and Cep, one can find more recent attempts to derive period(s) using various sources of photometric or radial velocity data (e.g. Mantegazza 1982, Smith, Patten & Goldberg 1989, Percy et al. 1996, Brelstaff et al. 1997, Rinehart et al. 2000). However, the typical time-span of analysed observations rarely exceeded 10–15 years and usually with many gaps, thus the derived periods (or mean cycle lengths) did not always agree.
The American Association of Variable Star Observers (AAVSO) has been collecting visual observations of variable stars for almost a century. The AAVSO database is by far the biggest one of its kind, containing over 12 million individual brightness estimates for about 6,000 variable stars. Of these, roughly 50 stars are reasonably well-observed bright galactic RSGs of the GCVS types SRc and Lc. Using their observational records in the AAVSO database, we have carried out a period and light curve analysis of this group of stars. The main aim was to derive periods for all variables. However, it turned out that in some cases the light curves had long enough time-span to study the long-term behaviour of their brightness fluctuations. Therefore, in addition to determining the dominant time-scales, we also discuss the nature and extent of the irregularities.
The paper is organised as follows. In Sect. 2 we describe the sample selection, data processing and analysis. Sect. 3 contains the results, the newly determined periods; Sect. 4 discusses the multiperiodic nature and a comparison with pulsation model predictions. In Sect. 5 we present evidence for stochastic oscillations in some of the stars and the presence of a strong noise. Sect. 6 briefly summarizes the main findings of this study.
2 Sample selection and data analysis
| Star | IRAS-identifier | Class | Sp. type | mmax | mmin | JD [yr] start | JD end | No. points |
|---|---|---|---|---|---|---|---|---|
| SS And | 23092+5236 | SRc | M6II | 9.0 | 10.1 | 2429543 [1939] | 2453735 | 445 |
| NO Aur | 05374+3153 | Lc | M2sIab | 6.0 | 6.5 | 39740 [1967] | 53488 | 425 |
| UZ CMa | 06165–1701 | SRc | M6II | 11.0 | 12.0 | 39385 [1966] | 53700 | 1544 |
| VY CMa | 07209–2540 | * | M5eIbp | 7.4 | 9.8 | 36168 [1957] | 53705 | 5247 |
| RT Car | 10428–5909 | Lc | M2Ia | 8.3 | 9.5 | 39159 [1965] | 53730 | 1324 |
| BO Car | – | Lc | M4Ib | 7.0 | 8.0 | 39159 [1965] | 53729 | 1226 |
| CK Car | 10226–5956 | SRc | M3.5Iab | 7.2 | 8.5 | 39156 [1965] | 53357 | 737 |
| CL Car | 10520–6049 | SRc | M5Iab | 8.2 | 9.6 | 39153 [1965] | 53686 | 539 |
| EV Car | 10186–6012 | SRc | M4.5Ia | 7.4 | 9.0 | 39154 [1965] | 53357 | 694 |
| IX Car | 10484–5943 | SRc | M2Iab | 7.2 | 8.5 | 39165 [1965] | 53730 | 1069 |
| TZ Cas | 23504+6043 | Lc | M2Iab | 8.9 | 10.1 | 34992 [1954] | 53705 | 826 |
| PZ Cas | 23416+6130 | SRc | M2-M4Ia | 8.2 | 10.2 | 40153 [1968] | 53675 | 990 |
| W Cep | 22345+5809 | SRc | M2epIa | 7.0 | 8.5 | 25528 [1929] | 53700 | 6987 |
| ST Cep | 22282+5644 | Lc | M2Iab | 7.9 | 8.9 | 27838 [1934] | 53679 | 1242 |
| Cep | 21419+5832 | SRc | M2eIa | 3.7 | 4.9 | 21566 [1917] | 53732 | 40044 |
| T Cet | 00192–2020 | SRc | M5-M6IIe | 5.2 | 6.8 | 20177 [1913] | 53724 | 6449 |
| AO Cru | 12150–6320 | Lc | M0Iab | 7.5 | 8.3 | 38895 [1964] | 53686 | 1396 |
| RW Cyg | 20270+3948 | SRc | M2-M4Iab | 8.0 | 9.5 | 16428 [1903] | 53693 | 1871 |
| AZ Cyg | – | SRc | M2-4Iab | 7.8 | 10.0 | 29451 [1939] | 53684 | 574 |
| BC Cyg | 20197+3722 | Lc | M3Iab: | 9.0 | 10.8 | 33206 [1949] | 53736 | 777 |
| BI Cyg | 20194+3646 | Lc | M4Iab | 8.6 | 10.6 | 33264 [1949] | 53736 | 1002 |
| TV Gem | 06088+2152 | SRc | M1.3Iab | 6.3 | 7.4 | 27750 [1934] | 53704 | 8449 |
| WY Gem | 06089+2313 | Lc+E: | M2epIab | 7.2 | 7.7 | 25256 [1927] | 53706 | 5548 |
| BU Gem | 06092+2255 | Lc | M1-M2Iab | 6.1 | 7.2 | 32213 [1946] | 53716 | 7598 |
| IS Gem | 06464+3239 | SRc | K3II | 5.6 | 6.0 | 40312 [1969] | 53731 | 2758 |
| Her | – | SRc | M5Iab: | 3.0 | 3.6 | 21840 [1918] | 53708 | 13853 |
| RV Hya | 08372–0924 | SRc | M5II | 7.4 | 8.1 | 21662 [1917] | 51634 | 416 |
| W Ind | 21108–5314 | SRc | M4-M5IIe | 8.5 | 10.2 | 42171 [1973] | 52937 | 399 |
| Y Lyn | 07245+4605 | SRc | M6sIb | 6.8 | 8.2 | 34783 [1953] | 53730 | 7992 |
| XY Lyr | 18364+3937 | Lc | M4-M5Ib | 5.7 | 6.6 | 32500 [1947] | 53709 | 6933 |
| Ori | 05524+0723 | SRc | M2Iab: | 0.3 | 1.2 | 21597 [1917] | 53731 | 19976 |
| S Per | 02192+5821 | SRc | M3Iae | 8.1 | 12.6 | 16160 [1902] | 53734 | 24863 |
| T Per | 02157+5843 | SRc | M2Iab | 8.5 | 9.2 | 16160 [1902] | 53711 | 8726 |
| W Per | 02469+5646 | SRc | M3Iab | 8.7 | 11.3 | 19069 [1910] | 53728 | 16687 |
| RS Per | 02188+5652 | SRc | M4Iab | 8.0 | 9.8 | 33490 [1950] | 53700 | 2045 |
| SU Per | 02185+5622 | SRc | M3.5Iab | 7.3 | 8.7 | 21396 [1915] | 53700 | 3121 |
| XX Per | 01597+5459 | SRc | M4Ib | 7.9 | 9.0 | 23469 [1922] | 53709 | 3044 |
| AD Per | 02169+5645 | SRc | M3Iab | 7.5 | 9.0 | 29545 [1939] | 53700 | 3038 |
| BU Per | 02153+5711 | SRc | M3.5Ib | 8.5 | 10.0 | 33572 [1950] | 53697 | 1413 |
| FZ Per | 02174+5655 | SRc | M0.5-M2Iab | 7.8 | 8.7 | 33897 [1950] | 53697 | 1875 |
| KK Per | 02068+5619 | Lc | M1-M3.5Iab | 7.7 | 8.4 | 40689 [1970] | 53697 | 1680 |
| PP Per | 02135+5817 | Lc | M0-M1.5Iab | 9.0 | 9.5 | 42041 [1973] | 53697 | 1382 |
| PR Per | 02181+5738 | Lc | M1Iab | 7.6 | 8.4 | 40689 [1970] | 53697 | 1616 |
| VX Sgr | 18050–2213 | SRc | M4e-M10eIa | 6.9 | 12.7 | 27948 [1934] | 53664 | 6300 |
| AH Sco | 17080–3215 | SRc | M4III: | 6.5 | 9.6 | 38994 [1965] | 53668 | 1262 |
| Sco | 16262–2619 | Lc | M1.5Iab-b | 0.6 | 1.6 | 21457 [1916] | 53584 | 462 |
| CE Tau | 05292+1833 | SRc | M2Iab | 4.3 | 5.2 | 35053 [1954] | 53723 | 2767 |
| W Tri | 02384+3418 | SRc | M5II | 7.6 | 8.8 | 31018 [1943] | 53705 | 4916 |
To find all well-observed RSG variables, we browsed through the AAVSO light curves of all stars listed as SRc or Lc type red supergiant in the GCVS. As an independent source of well-known galactic RSG stars, we checked the objects in Stothers & Leung (1972), Pierce et al. (2000) and Levesque et al. (2005). The latter paper was also used to collect the main physical parameters of the sample. The full set of stars is presented in Table 1 where, in addition to the GCVS data, we also indicate the starting and ending Julian Dates of the AAVSO light curves and the number of points in the raw data. We kept stars with at least 400 individual points (actually, W Ind only has 399). In total, we retained 234,527 visual magnitude estimates for 48 stars, with a total time-span of 2,926 years, or about 61 years of data for each star.
The data were handled in a similar way to our previous analyses of long-term visual light curves (e.g. Kiss et al. 1999, 2000; Kiss & Szatmáry 2002; Bedding et al. 2005). The raw light curves were plotted and then inspected for outlying points, which were removed by a sigma-clipping procedure. 10-day bins were calculated, which helped make the data distribution more even because in every star, there was gradual increase in the frequency of observations by a factor of 3 to 5 over the 20th century. Without binning, any kind of period determination would have been strongly biased by the latter half of the data.
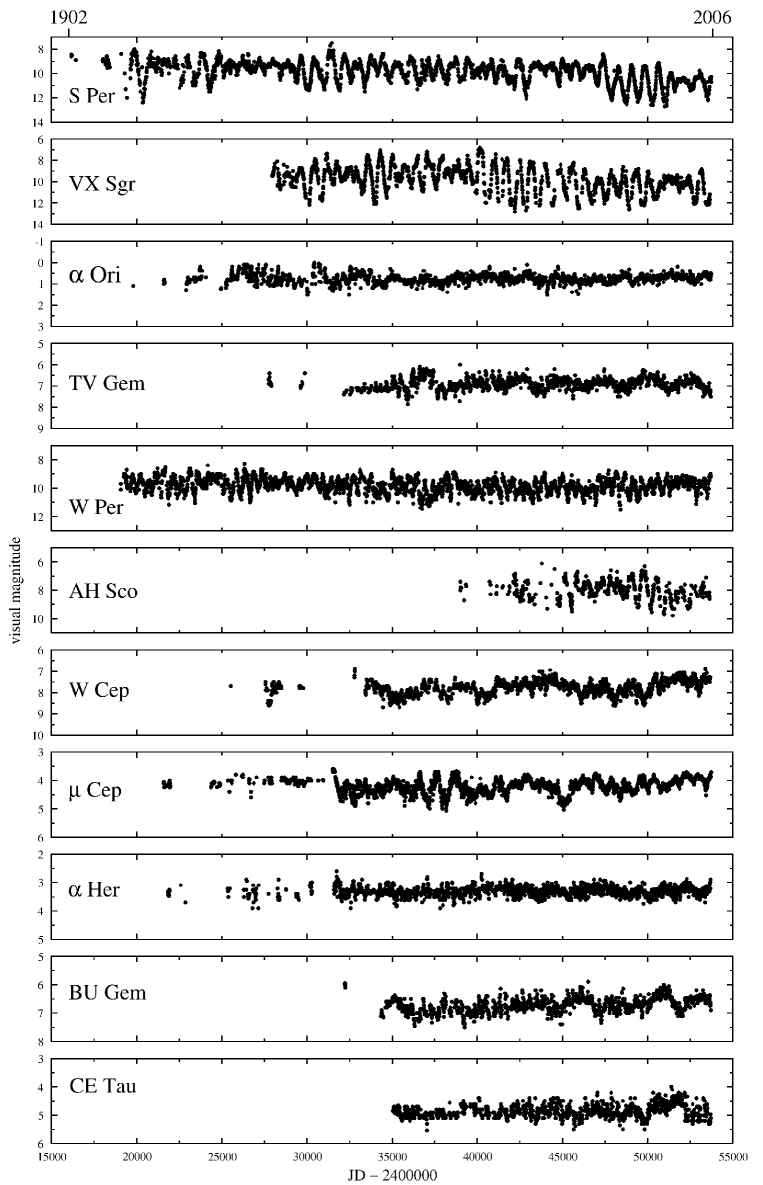
Representative light curves are shown in Fig. 1, where the time axes have the same range to give a comparative illustration of the time-spans of the data. We see various characteristic features in the light curves. The most impressive stars are those with the largest amplitudes, like S Per and VX Sgr, where the full brightness range is similar to that of a Mira-type variable. However, none of the stars are as regular as a Mira. At the other end of the spectrum, we see stars with low amplitudes (1 mag full range) and in many cases, two separate time-scales of variations: a slow one of a few thousand days and a faster one of a few hundred days (e.g. Ori, TV Gem, Her). In between, we also see intermediate-amplitude objects (of 2 to 3 mags), whose light curves are dominated by relatively stable cycles, even suggesting the presence of stable oscillations (W Per, AH Sco). However, in many of the stars, there seems to be no stable periodicity, although the data clearly show real brightness fluctuations (e.g. Cep, BU Gem, CE Tau).

To detect periodicities we calculated Fourier spectra of the light curves and then identified frequencies of power excesses. For this, we used Period04 of Lenz & Breger (2004) to carry out standard iterative sine-wave fitting. In every iteration, a sine-wave corresponding to the highest peak in the frequency spectrum was fitted and subtracted from the data. The spectrum was then recalculated using the residual data. The iterative procedure was stopped when the residual spectrum did not contain peaks more than three times the noise floor. We then merged the frequencies in a few well-confined groups, within which the amplitude-weighted centroid defined a mean “cycle length” of the star. These were later refined using a quantile analysis (see below). In the stars with highest amplitudes (e.g. S Per, VX Sgr) we found integer multiples of the dominant frequency, showing the non-sinusoidal shape of the curve; in those cases, the harmonics were not treated as separate periods.
To allow direct comparison between the stars, and because the oscillation modes are resolved, we converted the power (=amplitude2) spectra to power density (power per frequency resolution bin, expressed in mag2(c/d)-1), since the latter is independent of the length of the observations (Kjeldsen & Bedding 1995, App. A.1). Heavily smoothed power density spectra (PDS) were then used to determine the frequency dependence of the noise (observational as well as astrophysical), which seem to be the dominant factor in some of the variables.
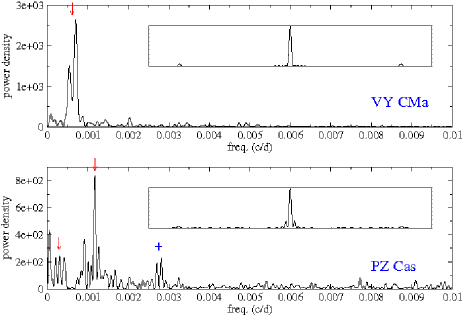
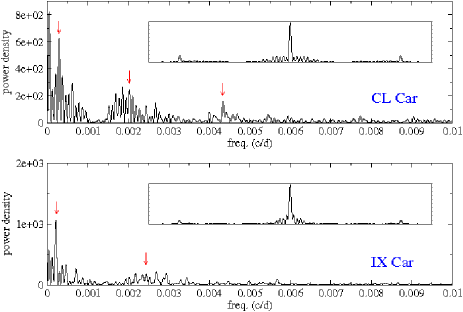
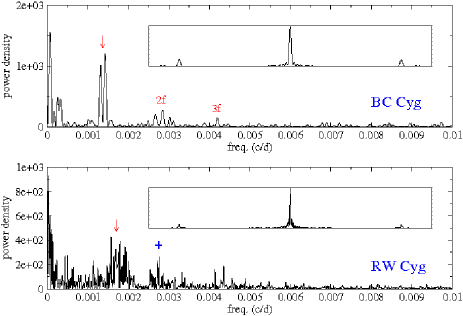
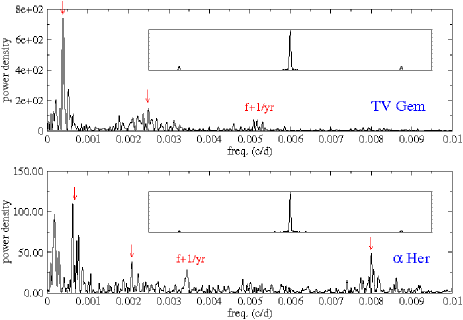
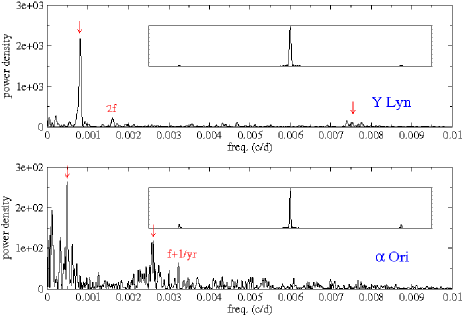
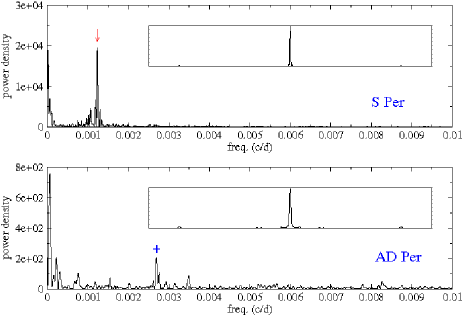
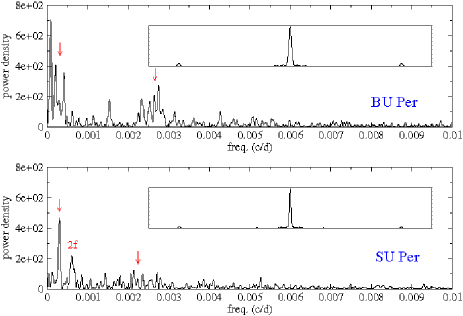
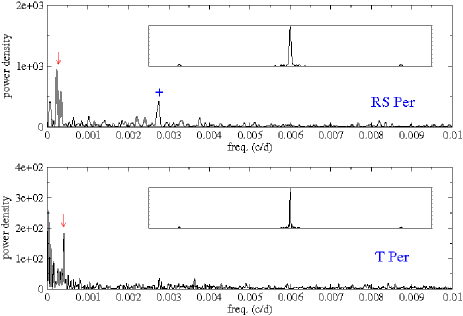
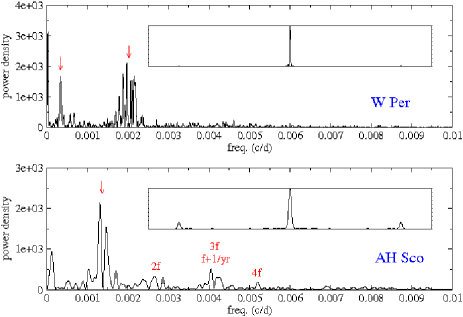
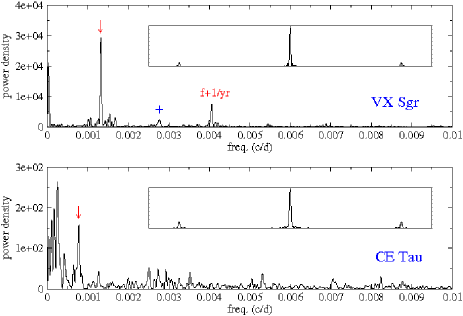
Sample power spectra are plotted in Figs. 2-3, where we also show the spectral window for each star. In high-amplitude stars close to the ecliptic plane (AH Sco, VX Sgr), we see strong yearly aliases, and that is why there are relatively high peaks in the spectra that remained unmarked. Also, for a few stars we find relatively strong peaks at a period of exactly 1-yr, whose reality is quite doubtful. Since these variables have very red colours, visual observations can be affected by seasonal poor visibility, when the stars are observed at such high air-masses that the colour difference between the variable and comparison stars may lead to differential extinction of a few tenths of a magnitude. We found very similar 1-yr periods in semiregular red giants (Kiss et al. 1999), so that periods between 355 and 375 days that were based on a single sharp peak were omitted from further analysis.
As can be seen from the spectral windows in Figs. 2-3, the typical sampling is excellent and most of the structures in the PDS are real. The closely spaced peaks and their power distribution is very similar in shape to those of the solar-like oscillators and pulsating red giants with stochastic behaviour (Bedding 2003, Bedding et al. 2005). For that reason, hereafter we make an important distinction between the instantaneous period of the star, which can be measured from a shorter subset of the light curve and the mean period, which has the real physical meaning. Due to the seemingly irregular nature of the light variations, there are certain limitations in assigning “periods” to the observations. Assuming that stochastic excitation and damping occur in these stars, one will always measure different period values from datasets that are comparable in length to the mode lifetime; however, that does not mean that the physical frequency of that particular mode has changed. In that sense we avoid using the term “period change”, because what we can measure does not imply any change at all in the period of the pulsation mode.
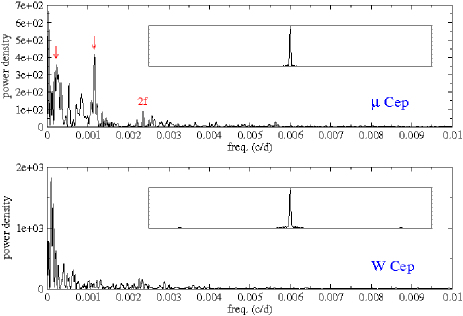
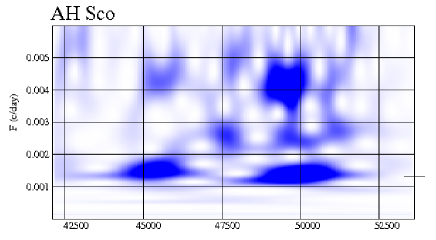
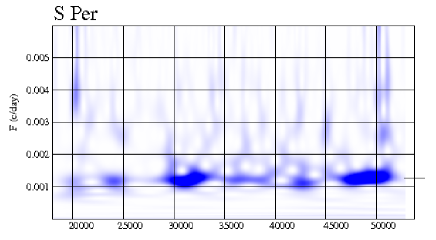
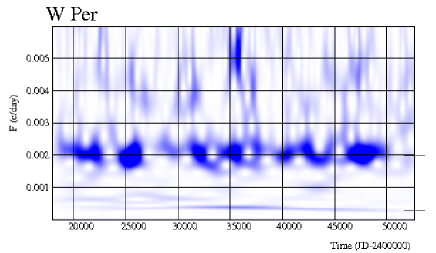
Further support to this was given by time-frequency analysis, which can reveal time-dependent modulations of the frequency content (e.g. Szatmáry, Vinkó & Gál 1994, Foster 1996, Bedding et al. 1998, Szatmáry, Kiss & Bebesi 2003, Templeton, Mattei & Willson 2005). We checked several time-frequency distributions for gradual period evolution using the software package TIFRAN (TIme FRequency ANalysis), developed by Z. Kolláth and Z. Csubry at the Konkoly Observatory, Budapest (Kolláth & Csubry 2006). In all cases, the wavelet maps clearly showed that close multiplets in the power spectra corresponded to a single peak that was subject to a time-dependent “jitter” with no signs of long-term evolution. Sample wavelet maps are shown in Fig. 4, with mean frequencies marked by the horizontal ticks. It is obvious, for example, that what seems to be two closely spaced peaks in AH Sco does in fact reflect a slight shift of of the dominant peak in the middle of the dataset. Similarly, the broad power excess in W Per (Fig. 3) corresponds to a peak that is highly variable in time. This behaviour is very typical for most of the stars and is similar to that of the semiregular red giant variables (e.g. Percy et al 1996, 2003). The fluctuations of the instantaneous frequency usually do not exceed 5–10% of the mean, although in extreme cases (like Ori, TV Gem) the full width of a power excess hump can have relative width of about 20% in frequency.
Keeping in mind these time-dependent changes, we determined mean periods as follows. We identified probable dominant frequencies from the well-defined humps of power excesses in the PDS, as described above. Then we selected the low- and high-frequency limits of each hump as the frequencies where the power density reached the level of the noise. In this interval the cumulative distribution of the power was calculated and normalized to 1. The 0.5-quantile, the frequency where the normalized distribution crossed the 0.5 value is adopted as the mean frequency of the hump. Similarly, the width of the power excess was assigned to be the difference between 0.166 and 0.834 quantiles, divided by 2. This way one can assume that at any given time the instantaneous period is within the [meanwidth] interval with 1-sigma confidence.
This method is somewhat subjective with the selection of the initial frequency intervals. But the quantiles are the most sensitive to the position of the peak and this stabilizes the results against the initial conditions. We tested this with comparing the results of the above discussed initial setup and another, strongly different test setup, where one of the initial positions was set twice further from the other one. The mean frequency was changed only by a few per cent, despite the obviously wrong initial settings. The width is almost similarly stable with a variation of 5–20%. This showed that the uncertainty of the mean frequency is usually in the order of a few percent, being much smaller than the natural jitter present in the stars. In several cases we fitted Lorentzian envelopes to the power excess humps (see details in Sect. 5) to measure the centroid frequency and its damping rate. For every star with well-defined, regular humps the results were very similar to those of the quantile analysis. However, for other stars the PDS is quite noisy and the assumption of Lorentzian power distribution is not true, so that fitting Lorentzians was not possible for the whole sample.
3 Results
| Star | Period(s)range | Period(s) | Source | Star | Period(s)range | Period(s) | Source |
| this study [d] | literature [d] | this study [d] | literature [d] | ||||
| SS And | 15917 | 152.5 | 1 | Her | 1245, 50050, 1480200 | 128, long | 10 |
| NO Aur | (0.05) | — | — | RV Hya | (0.10) | 116 | 1 |
| (UZ CMa) | 36211,38.40.3 | 82.5 | 1 | W Ind | 19315 | 198.8 | 1 |
| 41 | 2 | (Y Lyn) | 1333, 124050 | 110 | 1 | ||
| VY CMa | 1600190 | — | — | 1190, 133 | 6 | ||
| RT Car | 20125, 448146 | — | — | 110, 1400 | 10 | ||
| BO Car | (0.08) | — | — | XY Lyr | 122 | 120 | 11 |
| CK Car | (1/f) | 525 | 1 | Ori | 38830, 2050460 | 2200 | 3 |
| 500: | 2 | 2000 | 7 | ||||
| CL Car | 490100, 22914, 26001000 | 513 | 1 | 400, 1478 | 8 | ||
| 952 | 2 | 2000, 200, 290, 450 | 9 | ||||
| EV Car | 27626,820230 | 347 | 1 | S Per | 81360 | 822 | 1 |
| 235 | 2 | 745, 797, 952, 2857 | 12 | ||||
| IX Car | 40850, 44002000 | 400 | 1 | T Per | 2500460 | 2430 | 1 |
| TZ Cas | 3100 | — | — | 290, 2800 | 3 | ||
| PZ Cas | 850150, 3195800 | 925 | 1 | W Per | 50040, 2900300 | 485, 2667 | 1 |
| 900 | 3 | 467, 3060 | 3 | ||||
| W Cep | (1/f) | — | — | RS Per | 42001500 | — | — |
| ST Cep | 33001000 | 2050 | 3 | SU Per | 43070, 30501200 | 533 | 1 |
| Cep | 86050, 4400 | 730, 4400 | 1 | 500 | 3 | ||
| 4500 | 3 | XX Per | 31501000 | 415, 4100 | 1 | ||
| 873, 4700 | 4 | AD Per | (1/f) | 362.5 | 1 | ||
| 850 | 9 | BU Per | 38130, 36001000 | 367 | 1 | ||
| 840 | 10 | ||||||
| (T Cet) | 2983, 1613 | 159 | 1 | 365, 2950 | 3 | ||
| 110:, 280: | 11 | FZ Per | 36813 | 184 | 1 | ||
| AO Cru | (0.06) | — | — | KK Per | (0.04) | — | — |
| RW Cyg | 58080 | 550 | 1 | PP Per | (0.05) | — | — |
| 586 | 3 | PR Per | (0.05) | — | — | ||
| AZ Cyg | 49540, 33501100 | 459 | 1 | VX Sgr | 75456 | 732 | 1 |
| BC Cyg | 72040 | 700 | 1 | AH Sco | 73878 | 714 | 1 |
| BI Cyg | (0.10) | — | — | Sco | 1650640 | 1733 | 3 |
| TV Gem | 42645, 2550680 | 400, 2248 | 5 | 350 | 9 | ||
| 182 | 3 | CE Tau | 1300100 | 165 | 1 | ||
| WY Gem | 35324 | — | — | 140-165, 730 | 8 | ||
| BU Gem | 2450750 | — | — | 272, 1200: | 9 | ||
| (IS Gem) | (0.02) | — | — | W Tri | 1076, 590170 | 108 | 1 |
Sources: 1 - GCVS (+ notes); 2 - ASAS (Pojmanski 2002); 3 - Stothers & Leung (1971); 4 - Mantegazza (1982); 5 - Wasatonic, Guinan & Engle (2005); 6 - Szatmáry & Vinkó (1992); 7 - Goldberg (1984); 8 - Wasatonic & Guinan (1998); 9 - Percy et al. (1996); 10 - Percy, Wilson & Henry (2001); 11 - Percy et al. (2001); 12 - Chipps, Stencel & Mattei (2004)
We present the derived periods in Table 2. In total, we determined 56 periods for 37 stars; in 6 cases ours is the first period determination in the literature. We found published periods for 31 stars, but except for a few well-studies variables (e.g. Cep, Ori, S Per), most of them were quite neglected in the past three decades. Nevertheless, the overall agreement with the catalogued periods is good: for the shortest period stars (e.g. SS And, T Cet, Y Lyn, W Tri) our findings are in perfect agreement with the GCVS or other, more recent studies (with the differences staying below 2–3%). In a few cases we could not infer any clear coherent signal from the curves, so we show the upper limits on the semi-amplitude in parentheses.
In Fig. 5 we compare our periods with the literature. For this comparison we selected those periods from the literature that were definitely corresponding to ours. There are three significant outliers, namely CL Car at 2600 d (with 952 d from ASAS project), ST Cep at 3300 d (with 2050 d from Stothers & Leung 1971) and XX Per at 3100 d (with 4100 d also from Stothers & Leung 1971). In case of CL Car, we checked the ASAS observations of the star and found that the 952 d period is an error. For ST Cep and XX Per our data have significantly longer time-span, so that the newly determined values are likely to be more accurate.

We have attempted to confirm the red supergiant status of stars in our sample. The minimum absolute bolometric magnitude for red supergiants is about mag (Meynet & Maeder 2003), which can be translated to mag using the relation that connects extinction-corrected bolometric and -band magnitudes (Josselin et al. 2000). In our sample, bolometric magnitudes were recently determined for 18 stars by Levesque et al. (2005) and of these only ST Cep is located near the minimum luminosity, with mag. A few stars have useful Hipparcos parallaxes ( Ori, Sco, Her, CE Tau), and all are at least 1 mag brighter than mag. A particularly interesting star is Her because its period (125 d) is very short for a supergiant star. For instance, Jura & Kleinmann (1990) rejected all red supergiant candidates with periods less than 150 d, although it was clearly established from long-period variables in the Large Magellanic Cloud that the least luminous red supergiants can have periods between 100 and 150 d (Wood, Bessell & Fox 1983). For Her, mag (Richichi & Percheron 2002) and mas (ESA 1997), implying mag, so our conclusion is that shorter periods ( d) can indeed exist in RSGs.
For four stars, whose names are shown in parentheses in Table 2, the RSG class is somewhat doubtful. For UZ CMa, both the AAVSO light curve and the ASAS -band observations infer a periodicity around 40 days; the ASAS CCD- light curve is very typical of a short period red giant semiregular variable, presumably on the AGB, which is also supported by the luminosity class II. IS Gem, although classified as SRc, has too early a spectral type (K3II) and its -band absolute magnitude is only mag, being consistent with the luminosity class. For T Cet, the periods and their ratio of 1.87 are fairly typical for semiregular AGB stars (Kiss et al. 1999), and its Hipparcos parallax and 2MASS magnitude imply M mag, which is too faint. Y Lyn is a very typical semiregular variable with a long-secondary period, which is a well-known but still poorly understood phenomenon in AGB stars (Wood, Olivier & Kawaler 2004). Moreover, its -band absolute magnitude from the Hipparcos parallax and 2MASS -magnitude is only mag. For these reasons, hereafter we exclude these four stars from further analysis.
4 Discussion of the multiperiodic nature
According to the theoretical predictions, multiple periodicity may arise from multimode pulsations. Radial oscillations have long been predicted by model calculations, starting from the pioneering work of Stothers (1969). Two extensive investigations on pulsation properties of RSGs were recently published by Heger et al. (1997) and Guo & Li (2002). Although they treated convection in a different way (Heger et al. adopted the Ledoux criterion and treated semiconvection according to Langer, Sugimoto & Fricke (1983); Guo & Li used the mixing-length theory of Böhm-Vitense (1958) and adopted the Schwarzschild criterion to determine the boundaries of convection and semiconvection zones), both studies confirmed earlier results and predicted excitation of the fundamental, first and possibly second overtone modes. The fundamental mode’s growth rate always exceeded that of the overtone modes and was found to increase with luminosity for a given mass. On the other hand, studies of convection in the envelopes of red giants and supergiants showed that the dominant convective elements can be comparable in size to the stellar radius, which could explain both the observed irregular variations (Schwarzschild 1975, Antia et al. 1984) and the hotspots on late-type supergiants, detected using interferometric techniques (Tuthill, Haniff, & Baldwin 1997). A similar mechanism was proposed by Stothers & Leung (1971) for explaining the longer periods of RSG variables, arguing that the similarity of those periods and the time scale of convective turnover suggests a link between the two phenomena. Interestingly, periods that are too long were also found in other luminous stars. Maeder (1980) calculated empirical pulsation constants of blue-yellow supergiants, which were found to be systematically larger than the theoretical Q value for the fundamental mode of radial oscillation. Maeder (1980) suggested that those long periods can be due to non-radial oscillations of gravity modes. The same mechanism was proposed by Wood, Olivier & Kawaler (2004) as a possible explanation of the long-secondary periods of AGB stars.
4.1 Period–luminosity relations
A significant fraction of our sample can be characterized by two dominant periods, one of a few hundred days and one of 1500–2000 days. The strong similarity that we found in many cases argues for the reality of these long periods. Some of the light curves are more than twice as long as those analysed by Stother & Leung (1971) and the fact that we derive very similar values for the long periods indicates the reliability of the results. To reveal deeper insights into the nature of the multiply periodic variations, we studied the period–luminosity distribution for all stars having a useful estimate of luminosity.
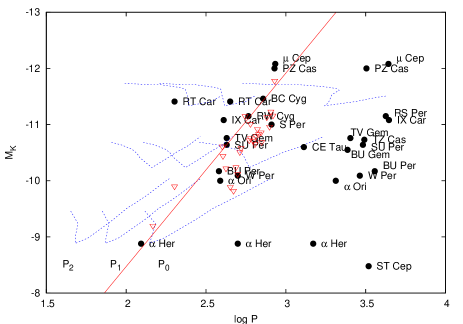
To construct the period–-band absolute magnitude diagram, we took the following steps: (i) values from Levesque et al. (2005) were converted to using the Josselin et al. (2000) relation; (ii) for Her, Ori and CE Tau we used Hipparcos parallaxes and K-band data to calculate directly; (iii) for comparison we added RSGs in the Large Magellanic Cloud, taken from Wood, Bessell & Fox (1983). The resulting P–L diagram is shown in Fig. 6, where the lines represent fundamental, first overtone and second overtone modes for models of solar metallicity by Guo & Li (2002). The help distinguish between the two sequences, periods longer than 1000 d were plotted with different symbols.
The shorter periods are well matched by the fundamental and first overtone modes of the models. Moreover, there is perfect agreement with the LMC red supergiant sample, too. Cep and PZ Cas are above the luminosity range of the models and it is possible that in those cases the longer period is the fundamental mode. RT Car and maybe IX Car seem to be too luminous for fundamental pulsation, but otherwise models strongly favour fundamental or first overtone modes for the shorter periods. It is worth noting that Her has an almost identical counterpart in the LMC, which provides a retrospective confirmation of the reality of the 125 d period.
Excluding the short period of RT Car, we fitted the following period– magnitude relation to the solid dots in Fig. 6:
with 0.46 mag rms, which is about the typical uncertainty of individual absolute magnitudes. The slope of this relation is very similar to the slope of the Mira P–L relation in the Large Magellanic Cloud (, Ita et al. 2004). The agreement shows the similarity of pulsations in red giant and red supergiant stars. However, the zero points are very different, as the Ita et al. relation for fundamental mode AGB stars has a zero point of +1.540.08 mag (with ).
The long secondary periods (LSPs) remain beyond the limits of the models, and both the updated models and the refined physical parameters of the stars keep the original conclusion on the peculiar nature of LSPs by Stothers & Leung (1971) unchanged. They cannot be explained by radial pulsations, because the period of the fundamental mode is the longest possible for that kind of oscillation. Metallicity effects also cannot explain the LSPs. Looking at the positions, for instance, Her or Ori, their absolute magnitudes are 1–2 mags fainter than those of the solar metallicity models. According to Guo & Li (2002), , which means that unphysically large metallicities (10–100 times solar) would be needed to account for the low luminosities. A possibility is that heavy circumstellar extinction in -band makes the stars fainter. Massey et al. (2005) indeed found many magnitudes of circumstellar -band extinction in a number of galactic RSGs, which showed that the effect may not be negligible (for example, in Fig. 6 Her, Ori and CE Tau were not corrected for this). Furthermore, it is known that the reddest Mira stars in the Small Magellanic Cloud have -band magnitudes that are fainter by 1–2 mag than predicted by the Mira P–L relation (Kiss & Bedding 2004), which is similar to what we see here for the red supergiants. On the other hand, the very good agreement for the shorter periods between the galactic and the LMC samples argues against this explanation (see, e.g., Her and the closest LMC point in Fig. 6). Also, the 4–5 mags extra optical extinction that has been found in cluster RSGs by Massey et al. (2005) could hardly explain the 1–2 mags extra extinction in the -band, unless the extinction law of the circumstellar matter is extremely different of the “standard” one (, Schlegel, Finkbeiner & Davis 1998). Therefore, the LSP P–L sequence is a separate entity, whose origins needs further investigation (possibly together with the AGB LSP phenomenon).
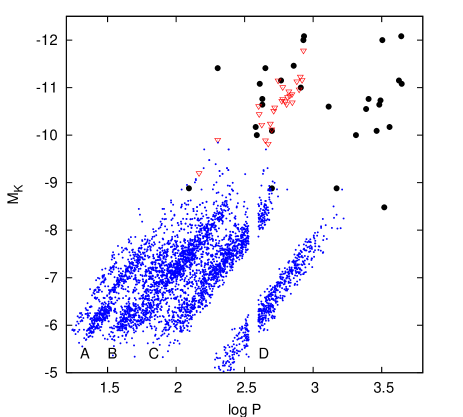
In Fig. 7 we compare the period–-magnitude relations for RSGs in our galactic sample (large black dots) and in the LMC (red triangles) with red-giant variables in the LMC (small blue dots), as observed by the MACHO project (data taken from Derekas et al. 2006). The MACHO sample comprises low-mass stars on the RGB and AGB. There is some similarity between the P–L relations of the supergiants and the less luminous RGB and AGB stars, although the lack of precise distance estimates for our sample of RSGs makes a detailed comparison difficult. Also, we expect the RSG sequences to be broad because these stars cover a large range of stellar masses. Nevertheless, it does appear that the shorter periods of the RSG stars mostly align better with Sequence B of the low-mass stars rather than with Sequence C, which would imply pulsation in the first-overtone rather than the fundamental. It would clearly be valuable to have long time series for a large sample of LMC stars, which could be obtained by analysing the photographic plate archives.
4.2 Pulsation constants


Further interesting details are revealed by examining the pulsation constants and . The first is the classical period-density relation, while the second is the natural form of the pulsation constant if the oscillations are confined to the upper layers of the envelope (Gough, Ostriker & Stobie 1965). Stothers (1972) showed that for pulsation models of massive red supergiants, of the fundamental mode was more constant than . We have calculated both quantities for the stars in Fig. 6 as follows. Radius values were either taken from Levesque et al. (2005) or calculated from the parallax-based luminosity ( Her and CE Tau) and temperature ( Her: Levesque et al. 2005; CE Tau: Wasatonic & Guinan 1998). Masses were estimated from the approximate relation , which comes from evolutionary calculations (Levesque et al. 2005); for this, values were taken from Levesque et al. (2005) or calculated from .
We plot the resulting pulsation constants and as function of period in Fig. 8. In addition to the empirical values, we also show fundamental- and first overtone-mode models of Guo & Li (2002). Based on this diagram we draw several conclusions. Firstly, looking at the model calculations, of the fundamental mode is indeed a better constant than , in accordance with the theoretical expectations, while the first overtone-mode models show an opposite behaviour. Secondly, all periods less than 1000 d agree with fundamental pulsation for both and (except for RT Car). Thirdly, there is a remarkable feature of the pulsation constants: the mean value of for the shorter periods and the mean value of for the long periods are practically equal: and . Although this might be coincidence, it may suggest that the fundamental period and the long secondary period are intimately connected via the relation , which could be used as test for future models of the LSPs.
One application of the two pulsation constants could be checking the consistency of a given set of physical parameters for a star with the observed periodicity. A notoriously ambiguous case is VY CMa, for which vastly different radius estimates can be found in the literature, ranging from 600 up to 2,800 R⊙ (Massey, Levesque & Plez 2006 and references therein). For example, Monnier et al. (1999) adopted M⊙ and R⊙, while Massey, Levesque & Plez (2006), using the new temperature scale of Levesque et al. (2005), arrived to M⊙ and R⊙. Using the mean cycle length of 1,600 d, the high-mass/large radius parameter set results in and , both being consistent with fundamental mode pulsation. For the low-mass/small radius set, the two constants are and , which could be acceptable if the 1600 d period referred to a long secondary period. At this stage, unfortunately, the periodicity does not help solve the problem, but since no other RSG has a fundamental-mode period greater than 1000 d, we have a slight preference for the low-mass/small radius set and the LSP interpretation of the 1,600 d periodicity.
5 Evidence for stochastic oscillation and noise
5.1 Lorentzian envelopes in the power spectra
The AAVSO observations span many decades and sometimes almost a century, thus we are now in a better position to understand the irregularity of RSG variability than previous researchers. Not much effort was put into this direction in the past: irregularity was taken as a general description of non-periodic brightness fluctuation in red giants and supergiants. For semiregular red giants the nature of irregularities was addressed by Lebzelter, Kiss & Hinkle (2000), who compared simultaneous light and velocity variations in a sample of late-type semiregular variables (of the GCVS types SRa and SRb) and concluded that the observed variability is most likely a combination of pulsations and additional irregularity introduced by, e.g., large convective cells. The latter phenomenon is theoretically expected (Schwarzschild 1975, Antia et al. 1984), although not much is known on the time-dependent behaviour of the integrated flux variations that arise from the huge convective cells. Percy et al. (2003) found growth/decay timescales of 1–5 years in a sample of small-amplitude pulsating red giant stars, which they interpreted as the natural growth (or decay) times for the pulsation modes. Recently, Bedding et al. (2005) discussed the possibility of solar-like excitation of the semiregular variable L2 Pup. In that star the the power distribution closely resembles that of a stochastically excited damped oscillator and is strikingly similar to close-up views of individual peaks in the power spectrum of solar oscillations: there is a single mode in the spectrum which is resolved into multiple peaks under a well-defined Lorentzian envelope. The envelope’s width gives the damping time (or mode lifetime), which is one of the main characteristics of a damped oscillator. Bedding et al. (2005) argued that the close similarity may imply solar-like excitation of oscillations, presumably driven by convection. Another interpretation could be that the cavity of oscillations is changing stochastically due to the convective motions, which affects the regularity of the pulsations.
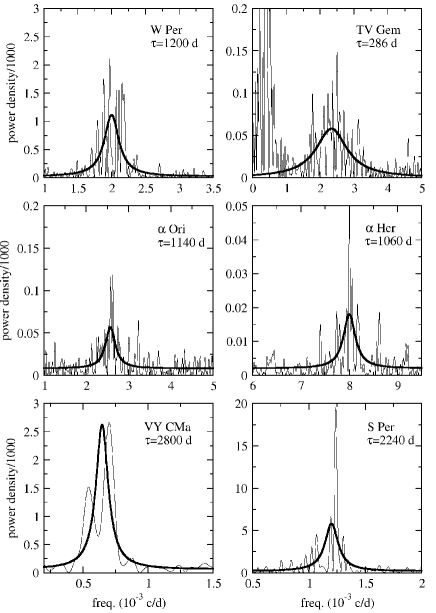
We find the very same structures in the power spectra of several RSGs: a well-defined Lorentzian envelope under which the power is split into a series of narrow peaks. Probably the best example is W Per (Fig. 3), where the window function is practically free of any kind of alias structure, so that no false structure due to poor sampling arises in the power spectrum. Other convincing examples include Ori, TV Gem, S Per, AH Sco, VY CMa and Her, whereas in a few stars the power is so spread over a large range of frequencies that no regular envelope can be traced in the spectrum.
Adopting the same approach as Bedding et al. (2005), i.e. assuming a stochastically excited damped oscillator, we have fitted Lorentzian profiles to the power spectra assuming statistics with two degrees of freedom. This is based on a maximum-likelihood fit, assuming an exponential distribution of the noise (Anderson, Duvall & Jefferies 1990, Toutain & Fröhlich 1992). The fit gives the centroid frequency and the half-width at half power , which can be converted to mode lifetime via .
We show the clearest examples of the Lorentzian fits in Fig. 9. We have looked for correlations between mode lifetime, luminosity and length of the long secondary periods. Generally, the mode lifetime is typically 3–4 times the pulsation cycle, with notable exceptions of TV Gem (less than 1) and Her (about 8). There might be a slight correlation between the long secondary period and the mode lifetime, but the small number of multiperiodic stars with well-defined Lorentzian fits prevented a firm conclusion.
5.2 noise
We also investigated the nature of irregularities through the shape of the noise level in the power spectra. The analysis of fluctuation power spectra density is a common tool in studies of unpredictable and seemingly aperiodic variability, i.e. noise that arises from a stochastic process. In this context, the noise is intrinsic to the source and not a result of measurement errors (such as Poisson noise). In astrophysics, X-ray light curves of active galaxies and interacting binaries have been a major inspiration of such studies (e.g. Vaughan et al. 2003 and references therein). Of particular interest are noise series whose power spectra are inverse power functions of frequency, the so-called noises, for which examples have been found in a wide range of natural phenomena (Press 1978). Bak, Tang & Wiesenfeld (1987) showed that dynamical systems with spatial degrees of freedom naturally evolve into a self-organized point. noise in these systems simply reflects the dynamics of a self-organized critical state of minimally stable clusters of all length scales, which in turn generates fluctuations on all time scales. Specifically, turbulence is a phenomenon, for which self-similar scaling is believed to occur both in time and space. Therefore, combining the Bak, Tang & Wiesenfeld (1987) theory with the Schwarzschild (1975) mechanism of producing irregular variability via large convective cells, one expects a strong noise component in the power spectra of RSG brightness fluctuatios, similarly to solar granulation background (e.g. Rabello-Soares et al. 1997).
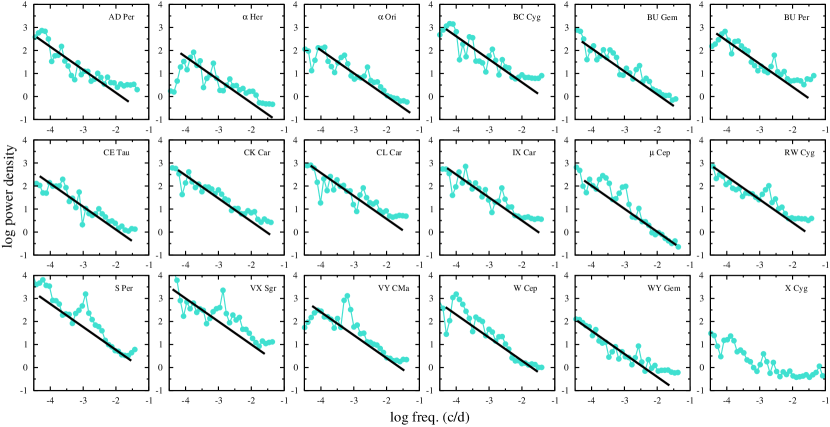
That is exactly what we find for the vast majority of the sample. In Fig. 10 we plot smoothed power density spectra in log-log representation. These were calculated from the initial spectra after transforming to the log-log scale and then binning them with a stepsize of 0.1 dex. Besides 17 RSGs, we also show the averaged power density spectrum of the AAVSO observations of the classical Cepheid variable X Cygni, which varies between mag with a period of 16.38 d. This star, being a strictly regular pulsating variable, served as a test object for the power distribution of visual observational errors. As indicated by the lower right panel of Fig. 10, the power distribution is much flatter for almost three orders of magnitude, with only a slight rise towards the lowest frequencies. This is likely to arise from the fact that not many AAVSO observers are active for more than 10,000 days, so there is a fluctuation of observers on time-scales of longer than a few 1000 days. It is also apparent that the mean power in X Cyg is much lower than in any of the RSGs, scattering between log PD = 0–1. Its brightness range is roughly in the middle of the sample (see Table 1), the time-span is about 20,000 days, so that the mean noise level should be representative of the typical AAVSO light curve in our set.
The RSG spectra look remarkably similar to each other. There is a roughly linear power increase towards the low-frequency end, which has very similar slope in almost all cases. Generally, we do not detect any flattening at the lowest frequencies, except for ( is the time-span of the data), which suggests that the observations are too short to extend over the whole range of time-scales of fluctuations that is present in these stars (with Her being an exception). Formal linear fits of the spectra resulted in slopes ranging from 0.8 to 1.2, but none was significantly different of 1. Furthermore, distinct features in the spectra (like the peaks of the periods) made it difficult to fit the overall slope of the “noise continuum” accurately, and because of that we fixed the slopes at 1 and fitted the zero-points only, excluding the frequency ranges of the higher power concentrations. The results are indicated by the thick black lines in Fig. 10.
Based on the close similarity of the log-log power spectra we conclude that there is a universal frequency scaling behaviour in the brightness fluctuations of red supergiant stars that fits very well the expectations for background noise from convection. It is not surprising that period determination is so difficult for these variables: the longer we observe, the more power will be detected in the low-frequency range, suggesting the presence of more and more “periods” that are comparable to the full length of the data. Periods identified with the fundamental mode are definitely real – although strongly affected by the high-noise in the systems. We think most of the long-secondary periods are also real, because we see a consistent picture in many different stars. However, random peaks at the lowest frequencies naturally develop due to the strong noise signal and it would be misleading to interpret each peaks as periods. Particularly good examples are AD Per and W Cep, of which the latter has variations up to 2 mags in visual but the power follows a well-defined distribution (with a slope that may be a bit larger than 1). The whole set of phenomena is strikingly similar to what is observed in the Sun and other solar-like oscillators. The photometric granulation noise in a main-sequence solar-like oscillator has a time-scale of minutes and micromagnitude amplitudes. At the other end of the spectrum we see these pulsating red supergiants with time-scales of years and noise amplitudes reaching tenths of a magnitude; the underlying physical mechanisms seem to be the same all across the Hertzsprung–Russell-diagram.
Finally, there is interesting correlation between the zeropoints of the fitted lines and the light curve amplitudes. The two highest amplitude stars, S Per and VX Sgr, have the highest noise levels, reaching one to two orders of magnitudes higher at than any other variable. This shows they are fundamentally more dynamic in pulsation and noise generation, which reminds us the predicted “superwind” phase of RSGs just preceding the supernova explosion. Pulsation model calculations by Heger et al. (1997) have shown that very large pulsation periods, amplitudes and mass-loss rates may be expected to occur at and beyond central helium exhaustion over the time-scale of the last few 104 years. The physical reason for this is the resonant character of pulsations when the pulsation period and the Kelvin-Helmholtz time-scale of the pulsating envelope evolve into the same order of magnitude. A similar result was found by Bono & Panagia (2000), whose pulsation models showed larger amplitude and more irregular variations for lower values of Teff, which turned out to be the main governer of the pulsational behaviour. As Lekht et al. (2005) noted for S Per, overall dimming of the star after a period of stronger oscillations may be due to subsequent enhanced mass-loss and ejection of a dust shell that screens the stellar radiation. This is clearly seen for S Per and VX Sgr, and maybe in AH Sco and VY CMa, giving supporting evidence for variations of the pulsation driven mass-loss on a time-scale of 20 years.
6 Conclusions
Red supergiants as variable stars have long been known for their semiregular brightness fluctuations. Using the extremely valuable database of visual observations of the AAVSO, we were able to study the main characteristics of their regular and irregular variations. From a detailed analysis of power spectra and time-frequency distributions, this paper discussed the properties of pulsations and their physical implications.
The sample contains several types of light variations. A few stars (S Per, VX Sgr, AH Sco) have very large peak-to-peak amplitudes that may reach up to 4 magnitudes in the visual. These objects show both the most coherent periodic signals and the highest level of noise in the power spectrum, which might be a sign of a “superwind” phase of RSGs that precedes the supernova explosion. We argue that multiple periods found by other studies were sometimes artifacts caused by the extreme noise levels of the systems. A more common type of variability is characterized by two distinct periods, one of a few hundred days and one of a few thousand days. The archetypes of these stars are Ori and TV Gem, both having a period around 400 days and another around 2000 days. The shorter periods can be identified with the radial fundamental or low-order overtone modes of pulsation, while the longer one is very similar to the Long Secondary Periods of AGB stars, whose origin is not known yet, but could be due to binarity, magnetic activity or non-radial -modes (Wood et al. 2004). Besides fundamental pulsation, we also see evidence for first and possibly second overtone modes. Finally, in a few stars we cannot infer any periodicity at all (e.g. W Cep, AD Per) and these are the truly irregular variables dominated by the noise in the power spectrum.
The period jitter of the pulsation modes produces in the power spectrum a well-defined Lorentzian envelope. Interpreting this as evidence for stochastically excited and damped oscillations, we measured the mode-lifetime (or damping rate) in red supergiants for the first time. In most stars it is several times longer than the period of pulsations. Since the damping rate depends on the stellar structure and convection properties in a complex way, with many weakly constrained theoretical parameters (e.g. Balmforth 1992) and, moreover, currently there are no theoretical calculations directly applicable to red supergiants, it is impossible to qualify the agreement with theoretical expectations. However, the strong noise component that seems to be ubiquitous in the whole sample, strongly favours the Schwarzschild (1975) mechanism of producing random brightness variations with huge convection cells, analogous to the granulation background seen in the Sun.
Finally, stochastic oscillations discussed in this paper may offer an explanation for the seemingly random behaviour of less luminous red giants stars. For example, random cycle-to-cycle fluctuations of the periods of Mira stars (e.g. Eddington & Plakidis 1929, Percy & Colivas 1999) are likely to be analogous to the period jitter we found here. It would be helpful to have theoretical models that are specifically designed for these phenomena, because the extensive records of homogeneous visual observations allow us measuring noise properties of red giant and supergiant stars quite accurately. In principle, internal physics could be probed through these accurate measurements provided that realistic models are calculated.
Acknowledgments
This work has been supported by a University of Sydney Postdoctoral Research Fellowship, the Australian Research Council, the Hungarian OTKA Grant #T042509 and the Magyary Zoltán Public Foundation for Higher Education. We sincerely thank variable star observers of the AAVSO whose dedicated observations over many decades made this study possible. LLK also thanks the kind hospitality of Dr. Arne Henden, the Director of the AAVSO, and all the staff members at the AAVSO Headquarter (Cambridge, MA) during his visit in early 2006. The NASA ADS Abstract Service was used to access data and references.
References
- [] Abramyan, G.V., 1984, Astrophysics, 20, 126
- [] Anderson, E.R., Duvall, T.L., Jr., & Jefferies, S.M., 1990, ApJ, 364, 699
- [] Antia, H.M., Chitre, S.M., & Narasimha, D., 1984, ApJ, 282, 574
- [] Bak, P. Tang, C., & Wiesenfeld, K., 1987, Phys. Rev. Let., 59, 381
- [] Balmforth, N.J., 1992, MNRAS, 255, 603
- [] Bedding, T.R., 2003, Ap&SS, 284, 61
- [] Bedding, T.R., Zijlstra, A.A., Jones, A., & Foster, G., 1998, MNRAS, 301, 1073
- [] Bedding, T.R., Kiss, L.L., Kjeldsen, H., Brewer, B.J., Dind, Z.E., Kawaler, S.D., & Zijlstra, A.A., 2005, MNRAS, 361, 1375
- [] Bono, G., & Panagia, N., 2000, ASP Conf. Series, 203, 105
- [] Böhm-Vitense, E., 1958, Z. Astrophys., 46, 108
- [] Brelstaff, T., Lloyd, C., Markham, T., & McAdam, D., 1997, JBAA, 107, 135
- [] Chipps, K.A., Stencel, R.E., & Mattei, J.A., 2004, JAAVSO, 32, 1
- [] Derekas, A., Kiss, L.L., Bedding, T.R., Lah, P., Szabó, Gy.M., 2006, ApJ, submitted
- [] Eddington, A.S., & Plakidis, L., 1929, MNRAS, 90, 65
- [] ESA, 1997, The Hipparcos and Tycho Catalogues, ESA SP-1200
- [] Feast, M.W., Catchpole, R.M., Carter, B.S., & Roberts, G., 1980, MNRAS, 193, 377
- [] Foster, G., 1996, AJ, 112, 1709
- [] Glass, I.S., 1979, MNRAS, 186, 317
- [] Goldberg, L., 1984, PASP, 96, 366
- [] Gough, D.O., Ostriker, J.P., & Stobie, R.S., 1965, ApJ, 142, 1649
- [] Guo, J.H., & Li, Y., 2002, ApJ, 565, 559
- [] Heger, A., Jeannin, L., Langer, N., & Baraffe, I., 1997, A&A, 327, 224
- [] Ita, Y., et al., 2004, MNRAS, 347, 720
- [] Josselin, E., Blommaert, J.A.D.L., Groenewegen, M.A.T., Omont, A., & Li, F.L., 2000, A&A, 357, 225
- [] Jura, M., & Kleinmann, S.G., 1990, ApJS, 73, 769
- [] Jurcevic, J.S., Pierce, M.J., & Jacoby, G.H., 2000, MNRAS, 313, 868
- [] Kholopov, P.N., et al., 1985-1988, General Catalogue of Variable Stars, 4th edition, Nauka, Moscow
- [] Kiss, L.L., & Bedding, T.R., 2004, MNRAS, 347, L83
- [] Kiss, L.L., Szatmáry, K., Cadmus, R.R., Jr., & Mattei, J.A., 1999, A&A, 346, 542
- [] Kiss, L.L., Szatmáry, K., Szabó, Gy., & Mattei, J.A., 2000, A&AS, 145, 283
- [] Kiss, L.L., & Szatmáry, K., 2002, A&A, 390, 585
- [] Kjeldsen, H., & Bedding, T.R., 1995, A&A, 293, 87
- [] Kolláth, Z., & Csubry, Z., 2006, Mem.S.A.It., 77, 109
- [] Langer, N., Sugimoto, D., & Fricke, K.J., 1983, A&A, 126, 207
- [] Lebzelter, T., Kiss, L.L., & Hinkle, K.H., 2000, A&A, 361, 167
- [] Lekht, E.E., Rudnitskij, G.M., Mentoza-Torres, J.E., Tolmachev, A.M., 2005, A&A, 437, 127
- [] Lenz, P., & Breger, M., 2005, Comm. Asteroseis., 146, 53
- [] Levesque, E.M., Massey, P., Olsen, K.A.G., Plez, B., Josselin, E., Maeder, A., & Meynet, G., 2005, ApJ, 628, 973
- [] Maeder, A., 1980, A&A, 90, 311
- [] Mantegazza, L., 1982, A&A, 111, 295
- [] Massey, P., 2003, ARA&A, 41, 15
- [] Massey, P., & Olsen, K.A.G., 2003, AJ, 126, 2867
- [] Massey, P., Plez, B., Levesque, E., Olsen, K.A.G., Clayton, G.C., & Josselin, E., 2005, ApJ, 634, 1286
- [] Massey, P., Levesque, E.M., & Plez, B., 2006, ApJ, in press
- [] Meynet, G., & Maeder, A., 2003, A&A, 404, 975
- [] Monnier, J.D., Tuthill, P.G., Lopez, B., Cruzalebes, P., Danchi, W.C., & Haniff, C.A., 1999, ApJ, 512, 351
- [] Percy, J.R., & Colivas, T., 1999, PASP, 111, 94
- [] Percy, J.R., Desjardnis, A., Yu, L., & Landis, H.J., 1996, PASP, 108, 139
- [] Percy, J.R., Dunlop, H., Lola, K., & Thompson, R.R., 2001, IBVS, No. 5041
- [] Percy, J.R., Nyssa, Z., & Henry, G.W., 2001, IBVS, No. 5209
- [] Percy, J.R., Wilson, J.B., & Henry, G.W., 2001, PASP, 113, 983
- [] Percy, J.R., Besla, G., Velocci, V., & Henry, G.W., 2003, PASP, 115, 479
- [] Pierce, M.J., Jurcevic, J.S., & Crabtree, D., 2000, MNRAS, 313, 271
- [] Pojmanski, G., 2002, Acta Astron., 52, 397 (see also: http://archive.princeton.edu/asas/)
- [] Press, W., 1978, Comments on Astrophysics, 7, 103
- [] Rabello-Soares, M.C., Roca Cortes, T., Jimenez, A., Andersen, B.N., & Appourchaux, T., 1997, A&A, 318, 970
- [] Richichi, A., & Percheron, I., 2002, A&A, 386, 492
- [] Rinehart, S.A., Hajian, A.R., Houck, J.R., & Terzian, Y., 2000, PASP, 112, 977
- [] Schlegel, D.J., Finkbeiner, D.P., & Davis, M., 1998, ApJ, 500, 525
- [] Schwarzschild, M., 1975, ApJ, 195, 137
- [] Smith, M., Patter, B.M., & Goldberg, L., 1989, AJ, 98, 2233
- [] Smith, N., Humphreys, R.M., Davidson, K., Gehrz, R.D., Schuster, M.T., & Krautter, J., 2001, AJ, 121, 1111
- [] Stothers, R., 1969, ApJ, 156, 541
- [] Stothers, R., 1972, A&A, 18, 325
- [] Stothers, R., & Leung, K.C., 1971, A&A, 10, 290
- [] Szatmáry, K., & Vinkó, J., 1992, MNRAS, 256, 321
- [] Szatmáry, K., Vinkó, J., & Gál, J., 1994, A&AS, 108, 377
- [] Szatmáry, K., Kiss, L.L., & Bebesi, Zs., 2003, A&A, 398, 277
- [] Templeton, M.R., Mattei, J.A., & Willson, L.A., 2005, AJ, 130, 776
- [] Toutain, T., & Fröhlich, C., 1992, A&A, 257, 287
- [] Tuthill, P.G., Haniff, C.A., & Baldwin, J.E., 1997, MNRAS, 285, 529
- [] Vaughan, S., Edelson, R., Warwick, R.S., & Uttley, P., 2003, MNRAS, 345, 1271
- [] Wasatonic, R., Guinan, E.F., 1998, IBVS, No. 4629
- [] Wasatonic, R., Guinen, E., & Engle, S., 2005, AAS Meeting 205, #122.06
- [] Wood, P.R., 2000, PASA, 17, 18
- [] Wood, P.R., & Bessel, M.S., 1985, PASP, 97, 681
- [] Wood, P.R., Bessell, M.S., & Fox, M.W., 1983, ApJ, 272, 99
- [] Wood, P.R., Olivier, E.A., & Kawaler, S.D., 2004, ApJ, 604, 800