The Chemical Evolution of Helium
Abstract
We report on measurements of the abundance toward the outer Galaxy H region S 206 with the NRAO Green Bank telescope. Observations of hydrogen and helium radio recombination lines between were made toward the peak radio continuum position in S 206. We derive = , 20% lower than optical recombination line results. It is difficult to reconcile the large discrepancy between the optical and radio values even when accounting for temperature, density, and ionization structure or for optical extinction by dust. Using only M17 and S 206 we determine = in the Galaxy, consistent with standard chemical evolution models. High helium abundances in the old stellar population of elliptical galaxies can help explain the increase in UV emission with shorter wavelength between 2000 and 1200 Å, called the UV-upturn or UVX. Our lower values of are consistent with a normal helium abundance at higher metallicity and suggest that other factors, such as a variable red giant branch mass-loss with metallicity, may be important. When combined with abundances in metal poor galaxy H regions, Magellanic cloud H regions, and M17 that have been determined from optical recombination lines including the effects of temperature fluctuations, our radio abundance ratio for S 206 is consistent with a helium evolution of = 1.6. A linear extrapolation to zero metallicity predicts a primordial abundance ratio about 5% lower than that given by the Wilkinson Microwave Anisotropy Probe and standard Big Bang nucleosynthesis. The measured abundances may be systematically underestimated by a few percent if clumping exists in these H regions.
1 Introduction
Helium is the second most abundant element in the Universe. Most of the is thought to have been produced during the era of primordial nucleosynthesis several minutes after the Big Bang (Peebles, 1966). Measurements of the primordial abundance ratio have been made by observing optical emission lines in low metallicity extragalactic H regions and either taking the average value of in the most metal poor objects (e.g., Searle & Sargent 1972) or extrapolating back to zero metallicity (e.g., Peimbert & Torres-Peimbert 1974). Dwarf irregular and blue compact galaxies have been extensively studied (Izotov & Thuan, 2004, and references therein). More recently, the primordial helium abundance has been determined by using cosmic microwave background (CMB) observations from the Wilkinson Microwave Anisotropy Probe (WMAP) to measure the baryon-to-photon ratio along with standard Big Bang nucleosynthesis (SBBN) calculations (Romano et al., 2003; Cyburt et al., 2003; Coc et al., 2004). Depending on the adopted uncertainties the measured abundance is either in agreement with WMAP/SBBN or lower than expected (Izotov & Thuan, 2004; Olive & Skillman, 2004; Steigman, 2005).
The only other significant known source of helium is the synthesis of in stars (Burbidge et al., 1957). The rate of production is typically expressed relative to the change in metallicity, , where and are the helium and metal abundances by mass. The functional form of is determined by observations of in objects with different metallicities. A variety of sources have been used: extragalactic H regions (Peimbert & Torres-Peimbert, 1974; Pagel et al., 1992; Skillman et al., 1994; Peimbert et al., 2000; Izotov & Thuan, 2004), Galactic H regions (Shaver et al., 1983; Peimbert et al., 1988; Baldwin et al., 1991; Deharveng et al., 2000), Galactic planetary nebula (D’Odorico et al., 1976; Maciel, 2001), K dwarf stars (Pagel & Portinari, 1998; Jimenez et al., 2003), and the Sun (Basu & Anita, 1995; Share & Murphy, 1997; Bahcall et al., 2005a, b).
The primary diagnostic for direct measurements of has been optical recombination lines (ORLs). There are multiple, bright transitions of H and in H regions and planetary nebulae (PNe). Moreover, transitions of heavier elements can be used to probe the ionization structure and metallicity. The observed H and line intensities must be converted into a abundance ratio. Sources of uncertainty in these calculations include (1) underlying absorption lines from stellar emission; (2) collisional excitation of H and He lines; (3) He optical depth effects; and (4) density, temperature and ionization structure (Olive & Skillman, 2001; Luridiana, 2003; Peimbert et al., 2003).
Radio recombination lines (RRLs) are weaker than ORLs but their interpretation should be simpler. The high principal quantum number (n) states of hydrogen and helium should be altered by radiative and collisional effects in the same way so that the ratio of the intensities is equal to the abundance ratio. There still exists the ionization structure problem since there is no way to directly measure neutral helium. Early RRL observations of Galactic H regions, however, produced abundances that varied with n (Lockman, 1982). (See Roelfsema & Goss [1992] for a review of high spatial resolution RRL observations with interferometers.) This effect was attributed to (1) departures from LTE that would effect H and differently (Baldwin et al., 1991); (2) a geometric effect that assumes the degree of helium ionization decreases from the center of the H region and that observations with higher n have lower spatial resolution (Mezger, 1980); and (3) that poor spectral baselines would systematically effect either the pressure broadened high-n transitions or the weaker helium lines due to confusion with weak H emission along the line of sight (Lockman, 1982). Peimbert et al. (1992a) used , , and RRL transitions at the same spatial resolution and determined abundance ratios consistent within the errors. These data had better sensitivity and improved spectral baselines over previous RRLs measurements (Balser et al., 1994). Nevertheless, the uncertainty in was around 10% or larger.
We report here sensitive H and radio recombination line observations toward the H region S 206 to compare with ORL results. This outer Galaxy H region is ionized by an O4-O5 star and is the only object in a survey of 36 high excitation H regions that contains no neutral helium (Deharveng et al., 2000). Optical recombination lines of H and were made with a Fabry-Perot spectrophotometer and abundances were calculated for different positions, diaphragm sizes, and determined electron temperatures. The average value of those listed in their Table 1 is . Recent RRL data for S 206 yeilds (Quireza et al., 2006). The quoted uncertainties are based on the formal errors of Gaussian fits to the line profiles. Instrumental spectral baseline effects will produce uncertainties that can be as large as the random errors (Balser et al., 1994; Quireza et al., 2006). Improved RRL data would provide an important independent constraint on the ORL results.
2 Observations
The observations were made at X-band () with the National Radio Astronomy Observatory111The National Radio Astronomy Observatory is a facility of the National Science Foundation operated under cooperative agreement by Associated Universities, Inc. 100 Green Bank telescope (GBT) in June 2004. The GBT has an unblocked aperture that significantly reduces reflections from various parts of the telescope structure. These reflections produce standing waves that limit the detection or accurate measurement of weak, wide spectral lines (Balser et al., 1994; Bania et al., 1997). The Sharpless H region S206 was observed at the J2000 position (right ascension = 04:03:15.87, declination = +51:18:54) assuming an LSR (radio) velocity of . The half-power beamwidth (HPBW) of the GBT is 80′′ at a frequency of 9.
The flux density scale was measured by injecting noise into the signal path of a known intensity as a function of frequency. This intensity scale was verified using the astronomical calibration source NGC 7027 which has a flux density of 6.0 Jy between (Peng et al., 2000). These two methods of calibration are consistent to within 5-10%. Local pointing and focus corrections were made approximately every two hours using nearby pointing sources (Condon & Yin, 2001).
Continuum data were taken at a frequency of 9 with a bandwidth of 320 using the digital continuum receiver. A Nyquist sampled continuum image of S 206 was produced by driving the telescope back and forth in right ascension at a rate of 60′ per minute for 60. The image consists of 121 raster scans offset by in declination. An integration time of 0.1 provided sampling in right ascension. The continuum data were analyzed using AIPS++. A linear baseline was fit to the outer 10% of each raster scan and subtracted from the data. The two orthogonal circular polarizations were averaged. The data were placed on a uniform grid using a prolate spheroidal convolving function.
Spectra were taken using the total power position switching mode where a reference position (OFF) was observed offset minutes in right ascension from the source and then the target position (ON) was observed. The reference and target positions were observed for 6 minutes each for a total of 12 minutes. The GBT Spectrometer was configured with 8 spectral windows times 2 orthogonal circular polarizations (LCP and RCP) for a total of 16 independent spectra. Each spectrum consisted of 4096 channels with a bandwidth of 50 yielding a frequency resolution of 12.2. All spectra have been Hanning smoothed.
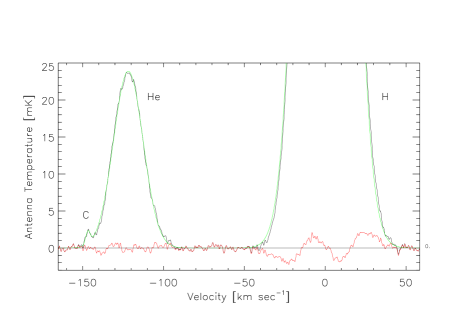
Table 1 summarizes the H radio recombination lines that were observed. Listed are the Hn transition, the Hn RRL frequency, the corresponding velocity resolution, the spectral window center frequency, and higher order H RRLs within the 50 bandwidth. The corresponding He RRLs are shifted higher in frequency. The frequency at the center of the band was typically offset in frequency from the Hn transition to observe higher-order RRLs that can be used to model the physical properties of S 206 and monitor system performance (e.g., Balser et al. 1999).
The spectral line data were calibrated and analyzed using an IDL software package created for single-dish data reduction.222See http://www.bu.edu/iar/research/dapsdr/. Each spectrum was visually inspected and a very small fraction of the data were edited due to interference. Because RRLs involve high-n transitions the expected line profiles should be similar between adjacent lines. Therefore the Hn, Hen, and Cn transitions can be averaged to increase the signal-to-noise ratio. The velocity resolution of each spectral window is different, however, because they are centered at different sky frequencies. Moreover, the spectra are sampled at different velocities. Therefore all spectra were re-sampled onto the 87 band using a sin(x)/x interpolation (Roshi et al., 2005). The 86 band was not used because of confusion with higher order RRLs. Therefore there were 14 independent spectra, 7 RRLs times 2 polarizations, each with a typical noise of mK. The expected noise of the averaged spectrum is mK= 0.27 mK, very close to the measured noise of 0.28 mK.
3 Results
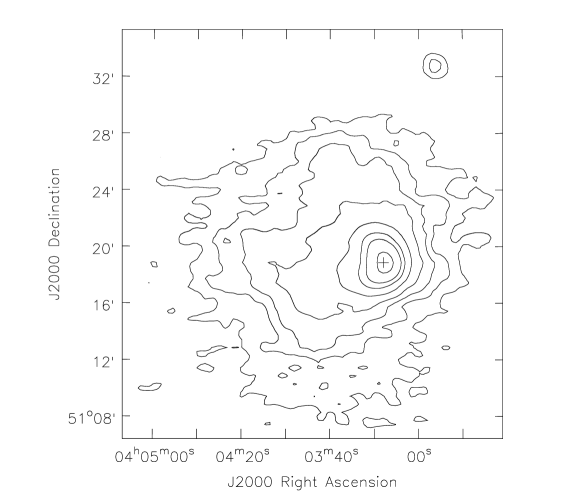
The GBT continuum image of S 206 is shown in Figure 1. This relatively low resolution radio continuum image suggest a core/halo morphology (c.f., Walmsley et al. 1975; Balser et al. 1995). Higher resolution radio observations reveal structure within the core component (Deharveng et al., 1976; Albert et al., 1986; Balser et al., 1995; Omar et al., 2002). Optical H images of S 206 are similar in morphology and contrast to the radio continuum images, suggesting no high extinction dust clouds (Deharveng et al., 1976). The major source of ionizing radiation is BD+50886 which has been classified as either an O4 or O5V star (Crampton & Fisher, 1974; Hunter & Massey, 1990). The ionizing star is located about one arcmin to the east of the brightest emission, consistent with a blister-type model with the H region being mass-limited to the east and photon-limited to the west. Infrared studies support this general picture (Albert et al., 1986; Pişmiş & Mampaso, 1991; Mookerjea et al., 1999).
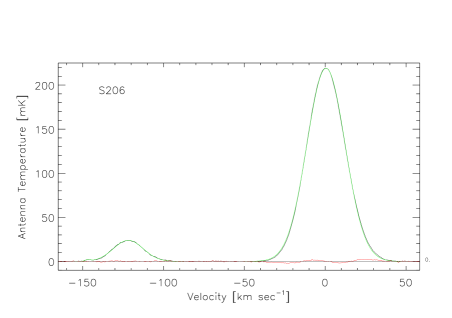
The averaged alpha-line spectrum is shown in Figure 2. The H and transitions are detected with high signal-to-noise ratios. Shown are Gaussian fits to the data along with the residuals. The data are well modeled by a single Gaussian function; although there is some evidence of non-Gaussian structure in the residuals for the H and He transitions. Table 2 summarizes the results of the Gaussian models. Listed are the peak intensity and the full-width half-maximum linewidths, along with their associated errors.
Although the GBT spectral baselines are much improved over traditionally designed single-dish telescopes, there does exist some baseline structure. Therefore a low-order ( or ) polynomial model was fit to the line-free baseline regions of each alpha-line spectrum and subtracted from the data. This removes the continuum level and any instrumental baseline structure before the data are re-sampled to the 87 velocity scale. The measured noise of the line-free regions is consistent with the theoretically predicted value. The calculated abundance ratio, based on Gaussian models, is . The uncertainty is based on the formal errors of the Gaussian model. The abundance ratio is proportional to the ratio of the He and H RRL intensity. Therefore, the uncertainty of % in the absolute intensity scale cancels. We tested this by averaging the LCP and RCP spectra separately. The ratios for LCP, RCP, and the combined (LCP plus RCP) are consistent to within the random uncertainties. We estimate a systematic error of about 0.1 percent based on different baseline models. The helium within the H region of S 206 appears to be fully ionized; therefore we determine = .
4 Discussion
The abundance ratio determined using RRLs in S 206 is 20% lower than values determined from ORLs. Direct comparison of using radio and optical techniques is often difficult because the two methods usually do not probe the same region. Therefore any true variation in or ionization structure will complicate the comparison. For example, ORLs are typically observed using a long slit across the nebula while RRLs are observed over a larger area, especially when single-dish telescopes are used. Also, dust can cause significant extinction at optical wavelengths whereby only the near side of the nebula is probed, while RRLs at cm-wavelengths are sensitive to the entire volume within the telescope’s resolution or beam. Nevertheless, the ORLs discussed in Deharveng et al. (2000) were observed with a Fabry-Perot for different positions and diaphragm sizes that covers the GBT’s beam. Also, infrared and optical images of S 206 indicate that there are no high extinction dust clouds (Deharveng et al., 1976; Albert et al., 1986; Pişmiş & Mampaso, 1991; Mookerjea et al., 1999). Therefore, the radio and optical data should sample a similar volume of the nebula. The ratio is constant to within the uncertainties throughout the nebula while the ratio varies from (Deharveng et al., 2000). Therefore S 206 should contain no neutral helium.
abundance ratios calculated using ORLs are a weak function of the electron temperature (Peimbert, 1995). Electron temperatures determined from collisionally excited lines (CELs) are sensitive to higher temperature regions while recombination line and recombination continua are sensitive to lower temperature regions. Therefore, temperature inhomogeneities can be probed using at least two of these different temperature diagnostics. Peimbert (1967) developed a formalism to determine the effects of temperature fluctuations using two parameters: the average temperature () and the mean squared temperature fluctuation (). For example, abundances determined using ratios of CELs of [O ] can overestimate the electron temperature and thus the helium abundance (Peimbert & Costero, 1969; Peimbert & Torres-Peimbert, 1974; Peimbert, 1995; Peimbert et al., 2002). Even for uniform electron temperature nebulae, density fluctuations can alter the emissivities of CELs that are used to determine the electron temperature (Rubin, 1989; Viegas & Clegg, 1994).
For S 206, Deharveng et al. (2000) used electron temperatures from the [O ] CEL ratios where K is the mean of their individual temperature measurements. Models of S 206 using RRL and continuum emission including non-LTE effects determine an electron temperature of K (Balser et al., 1999). For the GBT data here we calculate an LTE electron temperature of K using the line and continuum data (Mezger & Höglund, 1967). Therefore it does not appear that temperature or density fluctuations can account for the large differences in determined from ORLs and RRLs.
Liu et al. (2000) have proposed that cold, H-deficient clumps exist in nebulae that dominate the ORL emission. Since the H and He recombination lines are more heavily weighted toward the cold, dense clumps, the measured abundance will be overestimated compared to the average value. But ORLs and RRLs have the same dependence on density and therefore should be affected in the same way. Thus, it seems difficult to explain the helium abundance discrepancy between the optical and radio results for S 206.
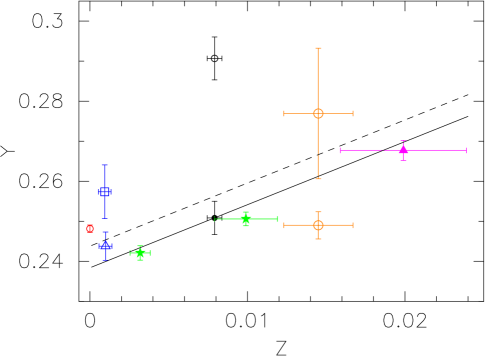
Figure 3 plots the abundance ratio by mass () versus the metallicity () for both Galactic and extragalactic sources. For S 206 we convert the abundance ratio by number () to using (e.g., Pagel et al. 1992). We use the oxygen abundance as a proxy for and assume that 45% of metals is comprised of oxygen by mass (i.e., ; Maciel [2001]). The oxygen abundance for S 206 is taken from Deharveng et al. (2000) where we have increased the abundance by 0.08 dex to correct for depletion in dust. We convert the O/H abundance by number () to the oxygen abundance by mass () using .
Accurate abundance ratios are difficult to measure in the Galaxy. Helium cannot be directly measured in the Sun and is typically inferred from other observables. In Figure 3 we plot the Solar helium abundance determined from stellar evolution models (Grevesse et al., 1996) and from helioseismology (Basu & Anita, 2004). New atmospheric models of the Sun predict lower mass fractions for the heavy elements that are inconsistent with helioseismology and produce lower values of (Bahcall et al., 2005a). Other measurements of in the Galaxy include ORLs and RRLs in H regions and planetary nebulae (PNe). The major problem with such studies is to determine the total abundance ratio. This requires a correction for any neutral helium that resides within the H region since neutral helium cannot be directly observed. The Orion nebula is the best studied, nearby Galactic H region. Two distinct values of have been determined in Orion based on both optical and radio observations: (Baldwin et al., 1991; Pogge et al., 1992) and (Peimbert et al., 1988; Rubin et al., 1991; Esteban et al., 1999a). The different abundances arise primarily from differences in the ionization correction for neutral helium. The lower abundance is based on an analysis that predicts very little neutral helium. Because of these discrepancies, Peimbert (1993) suggested that M17 is a better source to use for measuring because the radiation field should produce little neutral helium. We plot the helium abundance of for M17 (Peimbert & Peimbert, 2002; Peimbert, 2003). This abundance ratio is based on a reanalysis of the data from Esteban et al. (1999b) using a self consistent method that includes temperature fluctuations (Peimbert & Peimbert, 2002). The new value of is slightly smaller. Radio measurements of in M17 are typically in good agreement with the optical results (Peimbert et al., 1988, 1992a, 1992b; Peimbert, 1993; Esteban et al., 1999b; Tsivilev & Krasnov, 1999). Nevertheless, the radio observations are usually dominated by systematic effects that produce nonrandom frequency structure in the instrumental baselines (Balser et al., 1994; Bania et al., 1997). Also, most of the RRL data have been observed toward the brighter south-west component (M17S), while the optical data are from the north-east (M17N). Quireza et al. (2006) have observed RRLs toward M17N, very close to the M17-3 position of Peimbert et al. (1992a), and determine , consistent with the optical result.
Using only M17 and S 206 to measure the chemical evolution of helium we calculate = in the Galaxy. Chemical evolution models are consistent with although higher values can be produced by enriched supernovae winds (see below). Other recent estimates of helium production from Galactic H regions determine (Esteban et al., 1999b; Deharveng et al., 2000; Maciel, 2001). Local estimates of in the Galaxy have been made by using the fine structure in the main sequence of nearby stars with Hipparcos data. The estimates range from (Pagel & Portinari, 1998; Jimenez et al., 2003).
Measurements of are also important in understanding the excess of UV emission observed in elliptical galaxies which may be a useful diagnostic of age (Yi et al., 1999). Observations of UV radiation toward elliptical galaxies measure an increase in UV emission with shorter wavelengths between 2000 and 1200 Å that has been called the UV-upturn or UVX (see O’Connell [1999] for a review). Since it’s discovery over 25 years ago the interpretation of the UVX has been controversial. Recent evidence suggests that the source of the UVX is the old stellar population of early-type galaxies (Greggio & Renzini, 1990; Dorman, et al., 1993, 1995; Yi et al., 1997, 1998). In particular, extreme horizontal branch stars and their progeny are thought to be the main candidates for the UVX. Higher helium abundances will produce larger UV emission, although the adopted mass-loss on the red giant branch is very important (Dorman, et al., 1995; Yi et al., 1998). Yi et al. (1998) prefer a moderate increase in helium ( 2) to explain the UVX, while Dorman, et al. (1995) prefer a smaller helium abundance. Our observations of in the Galaxy suggest smaller helium production at higher metallicities.
H regions in the Magellanic clouds provide a measure of at intermediate metallicities. In Figure 3, we plot determined from ORLs including corrections for temperature fluctuations for NGC 346 in the SMC (Peimbert et al., 2000; Peimbert, 2003, and references therein) and 30 Doradus in the LMC (Peimbert, 2003). Observations of in the Magellanic clouds have the advantage that the H regions are relatively metal poor and the nebulae can be spatially resolved from the ionizing stars.
There has been a significant effort to measure in very low metallicity objects, such as blue compact galaxies, where a more direct estimate of the primordial helium abundance () can be made. Although it is difficult to resolve individual H regions for these more distant objects the lower metallicity produces a very hard radiation field that should ionize all of the helium. In Figure 3 we show the mean values determined from 7 metal poor dwarf galaxies from the original analysis (Izotov & Thuan, 2004, = ) and a reanalysis of the same data (Olive & Skillman, 2004, = ). Using 5 metal poor galaxies Peimbert et al. (2002) determine values that are significantly lower than previous determinations when including the effects of temperature fluctuations. Assuming = 3.5 they determine = . These results are summarized as a solid line in Figure 3 where we have assumed that oxygen contains 45% of the metals by mass or = 1.6. The primordial helium abundance from WMAP/SBBN is also shown with = (Spergel et al., 2006).
The abundances for S 206 are shown in Figure 3 for both the optical and radio data. Our radio value is consistent with the optically determined values of for metal poor galaxy H regions, Magellanic H regions, and M17 when temperature fluctuations are included and a constant helium evolution of = 1.6 from stars. A value of = was adopted by Peimbert et al. (2000) based on results from different chemical evolution models of irregular galaxies and the Galaxy (Carigi et al., 1995, 1999; Chiappini et al., 1997; Carigi, 2000). Since the range of metallicities in metal poor galaxies is small it is difficult to empirically determine from these observations. Chemical evolution models are in general consistent with a linear relationship between and , although they are sensitive to stellar yields (Pilyugin, 1993; Fields & Olive, 1998). Generic models produce while enrichment from supernovae winds can increase this value (Marconi et al., 1994; Fields, 1996; Copi, 1997; Fields & Olive, 1998; Chiappini et al., 2002).
Olive & Skillman (2004) concluded that the uncertainties in determining from ORLs in extragalactic objects have been underestimated. They suggest a more conservative range for the primordial helium abundance of based on the analysis of ORLs from metal poor galaxies. This range of values for covers the results from other studies, including the WMAP/SBBN prediction. Nevertheless, it is interesting that all of the filled symbols in Figure 3 which include results from ORLs that have been corrected for temperature fluctuations and our S 206 RRL result are consistent with a single value for and chemical evolution models. These abundances predict a primordial value that is lower than that given by WMAP/SBBN (Peimbert et al., 2000; Peimbert, 2003).
Mathis & Wood (2005) have produced Monte Carlo photo-ionization models of H regions that include a hierarchical density distribution of clumps. They predict that even for very hot stars ( K) there exists some neutral helium within the H region for models that include clumping. A sharp increase in density causes hydrogen to compete more effectively for He-ionizing photons; hence He+/He decreases. They estimate an increase of % in to correct for clumping. This would increase for both ORLs and RRLs studies depending on the amount of clumping in each H region. The dashed line in Figure 3 corresponds to a 3% increase in relative to the solid line. A 5% increase will reconcile the lower abundances in Figure 3 defined by the solid line with WMAP/SBBN.
5 Conclusion
The following are the main results of our observations with the NRAO Green Bank telescope of hydrogen and helium radio recombination lines between toward the outer Galaxy H region S 206:
-
1.
We determine a abundance ratio of in S 206. The GBT data are of high quality. The unblocked aperture of the GBT has significantly reduced the systematic effects of traditionally designed single-dish telescopes. Moreover, the GBT Spectrometer can tune to 8 RRLs simultaneously. These independent spectra were averaged to increase the signal-to-noise ratio.
-
2.
Our RRL measurement of in S 206 is 20% lower than ORL results (Deharveng et al., 2000). Although temperature and density fluctuations can result in an overestimate of optically determined values of , these effects appear to be small. ORLs of hydrogen and helium along with CELs of oxygen indicate no neutral helium in S 206. There is also no evidence of significant dust extinction suggesting that the optical and radio emission lines are probing the same volume of gas. Therefore, it is difficult to explain the helium abundance discrepancy between the optical and radio results for S 206.
-
3.
Using only M17 and S 206 we determine = in the Galaxy, consistent with standard chemical evolution models. High helium abundances in the old stellar population of elliptical galaxies can help explain the increase in UV emission with shorter wavelength between 2000 and 1200 Å, called the UV-upturn or UVX. Our lower values of are consistent with a normal helium abundance at higher metallicity and suggest that other factors, such as a variable red giant branch mass-loss with metallicity, may be important.
-
4.
Our abundance for S 206 is consistent with a helium evolution of = 1.6 when combined with metal poor galaxy H regions, Magellanic cloud H regions, and M17 that have been determined with ORLs including the effects of temperature fluctuations. These data are consistent with a primordial helium abundance of = (Peimbert et al., 2002), significantly lower than the WMAP/SBBN value of = (Spergel et al., 2006). The measured abundances may be systematically underestimated by a few percent if clumping exists in these H regions (Mathis & Wood, 2005).
References
- Albert et al. (1986) Albert, C. E., Schwartz, P. R., Bowers, P. F., & Rickard, L. J. 1986, AJ, 92, 75
- Bahcall et al. (2005a) Bahcall, J. N., Basu, S., Pinsonneault, M. Serenelli, A. M. 2005a, ApJ, 618, 1049
- Bahcall et al. (2005b) Bahcall, J. N., Serenelli, A. M., & Basu, S. 2005b, ApJ, 621, L85
- Baldwin et al. (1991) Baldwin, J. A., Ferland, G. J., Martin, P. G., Corbin, M. R., Cota, S. A., Peterson, B. M., & Slettebak, A. 1991, ApJ, 374, 580
- Balser et al. (1994) Balser, D. S., Bania, T. M., Brockway, C. J., Rood, R. T., & Wilson, T. L. 1994, ApJ, 430, 667
- Balser et al. (1999) Balser, D. S., Bania, T. M., Rood, R. T., & Wilson, T. L. 1999, ApJ, 510, 759
- Balser et al. (1995) Balser, D. S., Bania, T. M., Rood, R. T., & Wilson, T. L. 1995, ApJS, 100, 371
- Balser et al. (2001) Balser, D. S., Goss, W. M., De Pree, C. G. 2001, AJ, 121, 371
- Bania et al. (1997) Bania, T. M., Balser, D. S., Rood, R. T., Wilson, T. L., & Wilson, T. J. 1997, ApJS, 113, 353
- Basu & Anita (1995) Basu, S., & Anita, H. M. 1995, MNRAS, 276, 1402
- Basu & Anita (2004) Basu, S., & Anita, H. M. 2004, ApJ, 606, L85
- Burbidge et al. (1957) Burbidge, E. M., Burbidge, G. R., Fowler, W. A., & Hoyle, F. 1957, Rev. Mod. Phys. 29, 547
- Carigi (2000) Carigi, L. 2000, Rev. Mexicana Astron. Astrofis., 36, 171
- Carigi et al. (1999) Carigi, L., Colín, P., & Peimbert, M. 1999, ApJ, 514, 787
- Carigi et al. (1995) Carigi, L., Colín, P., Peimbert, M., & Sarmiento, A. 1995, ApJ, 445, 98
- Chiappini et al. (1997) Chiappini, C., Matteucci, F., & Gratton, R. 1997, ApJ, 477, 765
- Chiappini et al. (2002) Chiappini, C., Renda, A., & Matteucci, F. 2002, A&A, 395, 789
- Coc et al. (2004) Coc, A., Vangioni-Flam, E., & Angulo, C. 2004, ApJ, 600, 544
- Condon & Yin (2001) Condon, J. J., & Yin, Q. F. 2001, PASP, 113, 362
- Copi (1997) Copi, C. J. 1997, ApJ, 487, 704
- Crampton & Fisher (1974) Crampton, D., & Fisher, W. A. 1974, Publ. Dominion Astrophys. Obs., 14, 283
- Cyburt et al. (2003) Cyburt, R. H., Fields, B. D., & Olive, K. A. 2003, Phys. Lett., B567, 227
- Deharveng et al. (1976) Deharveng, L., Israel, F. P., & Maucherat, M. 1976, A&A, 48, 63
- Deharveng et al. (2000) Deharveng, L., Pea, M., Caplan, J., & Costero, R. 2000, MNRAS, 311, 329
- D’Odorico et al. (1976) D’Odorico, S., Peimbert, M., & Sabbadin, F. 1976, A&A, 47, 341
- Dorman, et al. (1995) Dorman, B., O’Connell, R. W., & Rood, R. T. 1995, ApJ, 442, 105
- Dorman, et al. (1993) Dorman, B., Rood, R. T., & O’Connell, R. W. 1993, ApJ, 419, 596
- Esteban et al. (1999a) Esteban, C., Peimbert, M., Torres-Peimbert, S., & Escalante, V. 1999a, MNRAS, 295, 401
- Esteban et al. (1999b) Esteban, C., Peimbert, M., Torres-Peimbert, S., & García-Rojas, J. 1999b, Rev. Mexicana Astron. Astrofis., 35, 65
- Fields (1996) Fields, B. D. 1996, ApJ, 456, 478
- Fields & Olive (1998) Fields, B. D., & Olive, K. A. 1998, ApJ, 506, 177
- Greggio & Renzini (1990) Greggio, L., & Renzini, A. 1990, ApJ, 364, 35
- Grevesse et al. (1996) Grevesse, N., Noels, A., & Sauval, A. J. 1996, in ASP Conf. Ser. 99, Cosmic Abundances, ed. S. S. Holt & G. Sonneborn (San Francisco: ASP), 117
- Hunter & Massey (1990) Hunter, D. A., & Massey, P. 1990, AJ, 99, 846
- Izotov & Thuan (2004) Izotov, Y. I., & Thuan, T. X. 2004, ApJ, 602, 200
- Jimenez et al. (2003) Jimenez, R., Flynn, C., MacDonald, J., & Gibson, B. K. 2003, Science, 299, 1552
- Liu et al. (2000) Liu, X.-W., Storey, P. J., Barlow, M. J., Danziger, I. J., Cohen, M., & Bryce, M. 2000, MNRAS, 312, 585
- Lockman (1982) Lockman, F. J., & Brown, R. L. 1982, ApJ, 259, 595
- Luridiana (2003) Luridiana, V. 2003, Proc. XXXVIIth Moriond Astrophysics Meeting, The Cosmological Model, ed. Y. Giraud-H raud, C. Magneville, & J. Tran Thanh Van (Vietnam: The Gioi Publishers), 159
- Mathis & Wood (2005) Mathis, J. S., & Wood, K. 2005, MNRAS, 360, 227
- Maciel (2001) Maciel, W. J. 2001, Ap&SS, 277, 545
- Marconi et al. (1994) Marconi, G., Matteucci, F., & Tosi, M. 1994, MNRAS, 270, 35
- Mezger & Höglund (1967) Mezger, P. G., & Höglund, B. 1967, ApJ, 147, 490
- Mezger (1980) Mezger, P. G. 1980, in Radio Recombination Lines, ed. P. A. Shaver (Dordrecht: Reidel), 81
- Mookerjea et al. (1999) Mookerjea, B., Ghosh, S. K., Karnik, A. D., Rengarajan, T. N., Tandon, S. N., Verma, R. P. 1999, ApJ, 522, 285
- O’Connell (1999) O’Connell, R. W. 1999, ARA&A, 37, 603
- Olive & Skillman (2001) Olive, K. A., & Skillman, E. 2001, NewA, 6, 119
- Olive & Skillman (2004) Olive, K. A., & Skillman, E. D. 2004, ApJ, 617, 29
- Omar et al. (2002) Omar, A., Chengalur, J. N., & Roshi, D. A. 2002, A&A, 395, 227
- Pagel & Portinari (1998) Pagel, B. E. J., & Portinari, L. 1998, MNRAS, 298, 747
- Pagel et al. (1992) Pagel, B. E. J., Simonson, E. A., Terlevich, R. J., & Edmunds, M. G. 1992, MNRAS, 255, 325
- Peebles (1966) Peebles, P. J. E. 1966, ApJ, 146, 542
- Peimbert (2003) Peimbert, A. 2003, ApJ, 584, 735
- Peimbert (1967) Peimbert, M. 1967, ApJ, 150, 825
- Peimbert (1993) Peimbert, M. 1993, Rev. Mexicana Astron. Astrofis., 27, 9
- Peimbert (1995) Peimbert, M. 1995, in The Analysis of Emission Lines, ed. R. E. Williams & M. Livio (Cambridge: Cambridge Univ. Press), 165
- Peimbert & Costero (1969) Peimbert, M., & Costero, R. 1969, Bol. Obs. Tonantzintla y Tacubaya, 5, 3
- Peimbert & Peimbert (2002) Peimbert, M., & Peimbert, A. 2002, Rev. Mexicana Astron. Astrofis. Ser. Conf., 14, 47
- Peimbert et al. (2002) Peimbert, A., Peimbert, M., & Luridiana, V. 2002, ApJ, 565, 668
- Peimbert et al. (2003) Peimbert, M., Peimbert, A., Luridiana, V., & Ruiz, M. T. 2003, in ASP Conf. Ser. 297, Star Formation Through Time, ed. E. Perez, R. M. Gonzalez Delgado & G. Tenorio-Tagle (San Francisco: ASP), 81
- Peimbert et al. (2000) Peimbert, M., Peimbert, A., & Ruiz, M. T. 2000, ApJ, 541, 688
- Peimbert et al. (1992a) Peimbert, M., Rodríguez, L. F., Bania, T. M., Rood, R. T., & Wilson, T. L. 1992a, ApJ, 395, 484
- Peimbert & Torres-Peimbert (1974) Peimbert, M., & Torres-Peimbert, S. 1974, ApJ, 193, 327
- Peimbert et al. (1992b) Peimbert, M., Torres-Peimbert, S., & Ruiz, M. T. 1992b, Rev. Mexicana Astron. Astrofis., 24, 155
- Peimbert et al. (1988) Peimbert, M., Ukita, N., Hasegawa, T., & Jugaku, J. 1988, PASJ, 40, 581
- Peng et al. (2000) Peng, B., Kraus, A., Krichbaum, T. P., & Witzel, A. 2000, A&AS, 145, 1
- Pişmiş & Mampaso (1991) Pişmiş, P., & Mampaso, A. 1991, MNRAS, 249, 385
- Pilyugin (1993) Pilyugin, L. S. 1993, A&A, 277, 42
- Pogge et al. (1992) Pogge, R. W., Owen, J. M., & Atwood, B. 1992, ApJ, 399, 147
- Quireza et al. (2006) Quireza, C., Rood, R. T., Balser, D. S., & Bania, T. M. 2006, ApJ, in press
- Roelfsema & Goss (1992) Roelfsema, P. R., & Goss, W. M. 1992, A&A Rev., 4, 161
- Romano et al. (2003) Romano, Tosi, Matteucci, & Chiappini 2003, MNRAS, 346, 295
- Roshi et al. (2005) Roshi, D. A., Balser, D. S., Bania, T. M., Goss, W. M., & De Pree, C. G. 2005, ApJ, 625, 181
- Rubin (1989) Rubin, R. H. 1989, ApJS, 69, 897
- Rubin et al. (1991) Rubin, R. H., Simpson, J. P., Haas, M. R., Erickson, E. F. 1991, ApJ, 374, 564
- Searle & Sargent (1972) Searle, L., & Sargent, W. L. W. 1972, ApJ, 173, 25
- Share & Murphy (1997) Share, G. H., & Murphy, R. J. 1997, ApJ, 484, L165
- Shaver et al. (1983) Shaver, P. A., McGee, R. X., Newton, L. M., Danks, A. C., & Pottasch, S. R. 1983, MNRAS, 204, 53
- Skillman et al. (1994) Skillman, E., Terlevich, R. J., Kennicutt, R. C., Garnett, D. R., & Terlevich, E. 1994, ApJ, 431, 172
- Spergel et al. (2006) Spergel et al. 2006, astro-ph/0603449
- Steigman (2005) Steigman, G. 2005, in the Proceedings of the ESO/Arcetri Workshop, Chemical Abundances and Mixing in Stars in the Milky Way and its Satellites, ed. L. Pasquini and S. Randich (Springer-Verlag: Berlin), in press
- Tsivilev & Krasnov (1999) Tsivilev, A. P., & Krasnov, V. V. 1999, AZh, 76, 588
- Viegas & Clegg (1994) Viegas, S. M., & Clegg, R. E. S. 1994, MNRAS, 271, 993
- Walmsley et al. (1975) Walmsley, C. M., Churchwell, E., Kazès, I., & Le Squéren, A. M. 1975, A&A, 41, 121
- Yi et al. (1997) Yi, S., Demarque, P., & Oemler, A., Jr. 1997, ApJ, 486, 201
- Yi et al. (1998) Yi, S., Demarque, P., & Oemler, A., Jr. 1998, ApJ, 492, 480
- Yi et al. (1999) Yi, S., Lee, Y.-W., Woo, J.-H., Park, J.-H., Demarque, P., & Oemler, A., Jr. 1999, ApJ, 513, 128
| Transition | ()a | ()b | ()c | Other Transitionsd |
|---|---|---|---|---|
| H86 | 10161.3029 | 0.360 | 10161.3029 | H108; H162; H169 |
| H87 | 9816.8669 | 0.373 | 9812.0000 | H137; H156; H164; H171 |
| H88 | 9487.8238 | 0.386 | 9505.0000 | H126; H173 |
| H89 | 9173.3233 | 0.399 | 9183.0000 | H140; H175; H188 |
| H90 | 8872.5708 | 0.412 | 8877.0000 | H113; H129; H177 |
| H91 | 8584.8232 | 0.426 | 8584.8232 | H154; H179; H186 |
| H92 | 8309.3850 | 0.440 | 8300.0000 | H132; H145; H181; H181 |
| H93 | 8045.6050 | 0.455 | 8045.6050 | H167; H183; H190 |
| Transition | (mK) | (mK) | () | () |
|---|---|---|---|---|
| H | 219.12 | 0.14 | 27.83 | 0.02 |
| He | 23.87 | 0.16 | 21.61 | 0.17 |
| C | 1.73 | 0.42 | 3.35 | 0.97 |