Radio evidence on the mass loss bi-stability jump
Abstract
We present the results of a first campaign of radio continuum observations toward supergiants with spectral types in the range O8 - B3. Three targets out of twelve were detected with the ATCA and the VLA. The measured fluxes and the upper limits yielded values of the stellar mass-loss rates and the wind efficiencies. The comparison of predicted and derived values of shows a good agreement.
Instituto Arg. de Radioastronomía, C.C.5, (1894) V. Elisa, Argentina
Keele University, Astrophysics, Lennard-Jones Lab, ST5 5BG, UK
Dep. de Fís., U. de Jaén, C. Las Lagunillas, E. A3, 23071 Jaén, Spain
STScI, 3700 San Martin Drive, Baltimore, MD 21218, U.S.A.
ATNF, CSIRO, PO Box 76, Epping, NSW 1710, Australia
Lamers et al. (1995) showed that for massive, early-type stars, the ratio between the measured terminal velocity and the escape velocity drops from 2.6 to 1.3, at stellar effective temperatures () around 25 kK. This so-called bi-stability jump (BSJ) was studied later by Vink et al. (1999), who found it to be due to the change in the ionization of the Fe lines that drive the wind. The authors also predict a jump in the mass-loss rate by a factor of five, for stars at the same luminosity, but this effect has to be proved observationally.
For a thermal stellar wind, the mass loss rate can be derived by means of radio data; the measured continuum flux density is proportional to (e.g. Panagia & Felli 1975, Benaglia et al. 2001).
In order to study the behavior of the mass loss rate at at both sides of the BSJ, we started a project to gather all results of previous radio observations and to extend the sample with new detections. Here we present the new observations.
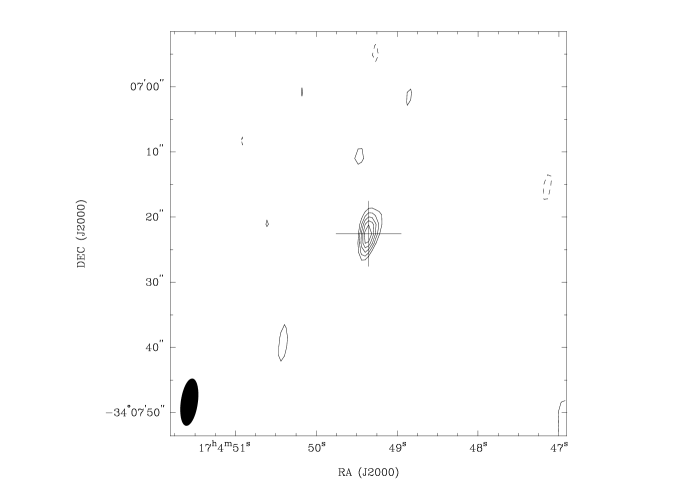
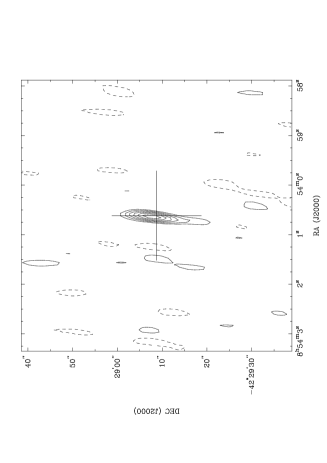
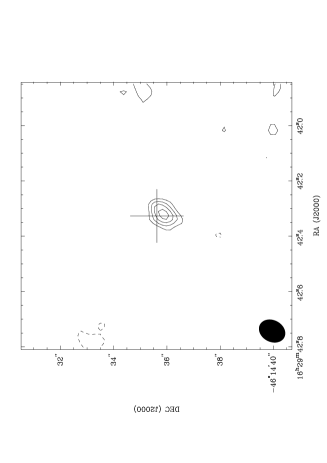
We have performed high resolution continuum observations of the supergiants listed in Table 1. Eight of them were observed using the VLA, at 8.46 GHz, for 1 h each. The rest were observed with the ATCA at 17.8 GHz, during 4 h. HD 76341, HD 148379 and HD 154090 were detected (Figs. 1-2).
Table 1 lists the target stars, some stellar parameters adopted, and the measured flux densities ( upper limit for non-detections). We have derived the mass loss rate and the corresponding wind efficiency . The last column gives the expected mass-loss rates. At first sight, these radio data appear in reasonable agreement with predictions, although we note a large discrepency for HD 148379. The issue therefore warrants further investigation with a larger sample, which is forthcoming (Benaglia et al., in prep.).
| Star | Sp. Class. | Tel. | |||||
|---|---|---|---|---|---|---|---|
| (kpc) | (mJy) | ||||||
| HD 42087 | B2.5 Ib | VLA | 1.2 | 0.14 | 0.60 | ||
| HD 43384 | B3 Iab | VLA | 1.4 | 0.24 | 0.82 | ||
| HD 47432 | O9.7 Ib | VLA | 1.7 | 0.15 | 0.64 | ||
| HD 76341 | O9 Ib | VLA | 1.9 | 1.31 | |||
| HD 112244 | O8.5 Iab(f) | ATCA | 1.5 | 0.3 | 0.52 | ||
| HD 148379 | B1.5 Iape | ATCA | 1.0 | 0.03 | |||
| HD 154090 | B0.7 Ia | VLA | 1.1 | ||||
| HD 156154 | O8 Iab(f) | VLA | 2.2 | 0.15 | 0.69 | ||
| HD 157246 | B1 Ib | ATCA | 1.1 | 0.18 | 0.08 | ||
| HD 165024 | B2 Ib | ATCA | 0.8 | 0.18 | 0.14 | ||
| HD 204172 | B0 Ib | VLA | 3.0 | 0.08 | 1.30 | ||
| BD-11 4586 | O8 Ib(f) | VLA | 1.8 | 0.3 | 0.88 |
References
Benaglia, P., Cappa, C.E., & Koribalski, B. 2001, A&A, 200, 58
Lamers, H.J.G.L.M., Snow, T.P., & Lindholm, D.M. 1995, ApJ, 455, 269
Panagia, N., & Felli, M. 1975, A&A, 39, 1
Vink, J.S, de Koter, A., & Lamers, H.J.G.L.M. 1999, A&A, 35, 181