Photometric and spectroscopic evolution of the type IIP supernova SN 2004et
Abstract
We present optical photometry and spectroscopy of the type IIP supernova SN 2004et that occurred in the nearby galaxy NGC 6946. The observations span a time range of 8 days to 541 days after explosion. The late time bolometric luminosity and the H luminosity in the nebular phase indicate that of 56Ni was synthesised during the explosion. The plateau luminosity, its duration and the expansion velocity of the supernova at the middle of the plateau indicate an explosion energy of ergs. The late time light curve and the evolution of the [OI] and H emission line profiles indicate the possibility of an early dust formation in the supernova ejecta. The luminosity of [OI] 6300, 6364 Å doublet, before the dust formation phase, is found to be comparable to that of SN 1987A at similar epochs, impling an oxygen mass in the range , and a main sequence mass of for the progenitor.
keywords:
supernovae: general - supernovae: individual: SN 2004et - galaxies: individual: NGC 69461 Introduction
Supernovae have been classified mainly based on their spectrum near maximum, the events which show the presence of hydrogen lines have been termed as supernovae type II (SNe II) and those which do not show hydrogen are classified as type I. Type II events are thought to arise from the gravitational collapse of stars more massive than . SNe II have been further divided based on their light curve (Baron, Ciatti & Rosino, 1979) as type II-L (linear) and type II-P (plateau). Supernovae type IIP (SNe IIP) are characterized by a plateau of nearly constant luminosity in their light curve, originating because of propagation of a cooling and recombination wave through the supernova envelope.
(2003) has shown that SNe IIP form a sequence from low-luminosity, low-velocity, nickel-poor events to bright, high velocity, nickel-rich objects. Further, there is an indication that more massive progenitors produce more energetic explosion and supernovae with greater energies produce more nickel. The direct identification of the progenitor of a few SNe IIP indicates these events arise from stars with masses in the range (Smartt et al. 2004, Van Dyk et al. 2003, Li et al. 2006).
SN 2004et was discovered by Moretti on Sept. 27, 2004 in the nearby starburst galaxy NGC 6946, which has already produced seven supernovae during 1917 to 2003. Based on a high resolution spectrum that showed a relatively featureless spectrum with a very broad, low contrast H emission, Zwitter, Munari & Moretti (2004) classified the supernova as a type II event, which was later confirmed by a low resolution spectrum taken on 2004 Oct 01 by Filippenko et al. (2004). The P-Cygni profile of H was greatly dominated by the emission component, while the other hydrogen Balmer lines had a more typical P-Cygni profile. The continuum was quite blue, although there was very low flux shortward of 4000Å. The supernova was detected in the radio frequencies at 22.460 GHz and 8.460 GHz on 2004 Oct 5.128 (Stockdale et al., 2004), suggesting the presence of appreciable circumstellar material around SN 2004et. Based on pre-explosion images of NGC 6946, Li et al. (2005) identified the candidate progenitor as a yellow supergiant with an estimated zero age main sequence mass of . The identification of the progenitor was confirmed with post-outburst Hubble Space Telescope images obtained on 2005 May 02 (Li, Filippenko & Van Dyk, 2005). This makes SN 2004et one of the few core-collapse supernovae with a directly identified progenitor.
The proximity and brightness of SN 2004et made it an ideal target for an intensive monitoring. We present in this paper the results based on extensive photometric and spectroscopic observations of SN 2004et during 8 - 541 days since explosion.
2 Observations and Data Reduction
2.1 Photometry
SN 2004et was observed with the 2m Himalayan Chandra Telescope (HCT) of the Indian Astronomical Observatory (IAO), Hanle, India, using the Himalaya Faint Object Spectrograph Camera (HFOSC), equipped with a pixel CCD. The central region of the CCD used for imaging covers a field of view of 10x10 arcmin, with a scale of 0.296 arcsec pixel-1. The photometric monitoring of SN 2004et, in Bessell filters (Bessell, 1990), began on 2004 September 29, soon after its discovery, and continued until 2006 March 16.
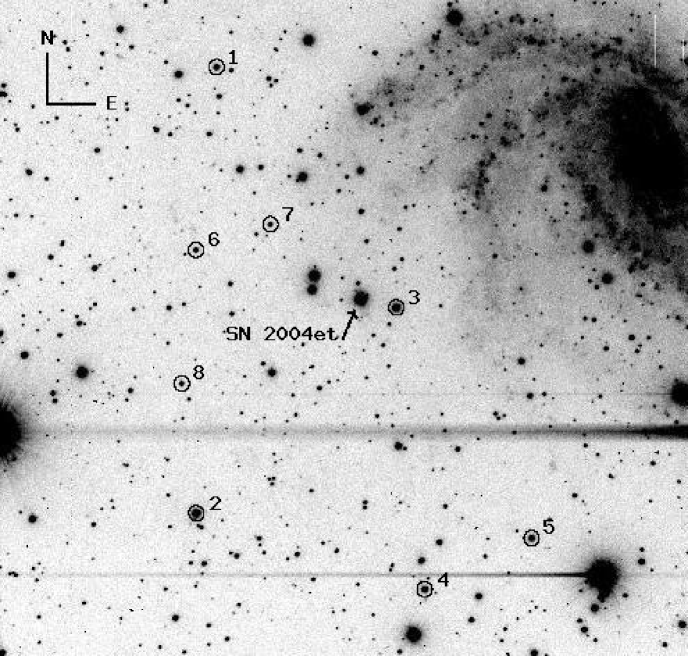
The data were bias subtracted, flat-field corrected and cosmic rays removed adopting the standard manner, using the various tasks available under the IRAF software. Data obtained on photometric nights were calibrated using standard fields (Landolt, 1992) and a sequence of local standards in the supernova field (ref. Fig. 1) were used for photometric calibration of the supernova. Table 1 gives the magnitudes of the secondary standards averaged over a few photometric nights.
Aperture photometry was performed on the local standards using an aperture of radius determined based on an aperture growth curve. The magnitudes of the supernova and also the local standards were estimated using the profile-fitting method, using a fitting radius corresponding to the full width at half maximum of the stellar profile. The difference between aperture and profile-fitting magnitudes was obtained using the standards and this correction was applied to the supernova magnitude. The supernova magnitudes were calibrated differentially with respect to the local standards listed in Table 1, the final magnitude of the supernova was derived by taking an average of these estimates. The estimated supernova magnitudes and errors are listed in Table 2. The errors in the magnitudes were estimated by combining the fit errors in quardature with those introduced by the transformation of instrumental magnitudes into the standard system.
| ID | U | B | V | R | I |
|---|---|---|---|---|---|
| 1 | |||||
| 2 | |||||
| 3 | |||||
| 4 | |||||
| 5 | |||||
| 6 | |||||
| 7 | |||||
| 8 |
| Date | J.D. | Phase* | U | B | V | R | I |
| 2453000+ | (days) | ||||||
| 29/09/2004 | 278.202 | 7.70 | |||||
| 30/09/2004 | 279.225 | 8.73 | |||||
| 01/10/2004 | 280.200 | 9.70 | |||||
| 06/10/2004 | 285.118 | 14.62 | |||||
| 07/10/2004 | 286.065 | 15.57 | |||||
| 09/10/2004 | 288.059 | 17.56 | |||||
| 11/10/2004 | 290.060 | 19.56 | |||||
| 12/10/2004 | 291.237 | 20.74 | |||||
| 13/10/2004 | 292.077 | 21.58 | |||||
| 14/10/2004 | 293.103 | 22.60 | |||||
| 15/10/2004 | 294.114 | 23.61 | |||||
| 16/10/2004 | 295.125 | 24.62 | |||||
| 17/10/2004 | 296.066 | 25.57 | |||||
| 22/10/2004 | 301.046 | 30.55 | |||||
| 23/10/2004 | 302.045 | 31.55 | |||||
| 26/10/2004 | 305.083 | 34.58 | |||||
| 27/10/2004 | 306.055 | 35.55 | |||||
| 29/10/2004 | 308.218 | 37.72 | |||||
| 30/10/2004 | 309.125 | 38.62 | |||||
| 01/11/2004 | 311.132 | 40.63 | |||||
| 05/11/2004 | 315.053 | 44.55 | |||||
| 11/11/2004 | 321.034 | 50.53 | |||||
| 12/11/2004 | 322.067 | 51.57 | |||||
| 16/11/2004 | 326.046 | 55.55 | |||||
| 20/11/2004 | 330.070 | 59.57 | |||||
| 24/11/2004 | 334.072 | 63.57 | |||||
| 25/11/2004 | 335.035 | 64.54 | |||||
| 04/12/2004 | 344.063 | 73.56 | |||||
| 08/12/2004 | 348.041 | 77.54 | |||||
| 12/12/2004 | 352.034 | 81.53 | |||||
| 16/12/2004 | 356.096 | 85.60 | |||||
| 29/12/2004 | 369.038 | 98.54 | |||||
| 06/01/2005 | 377.044 | 106.54 | |||||
| 10/01/2005 | 381.044 | 110.54 | |||||
| 13/01/2005 | 384.043 | 113.54 | |||||
| 23/01/2005 | 394.041 | 123.54 | |||||
| 07/03/2005 | 436.511 | 166.01 | |||||
| 24/03/2005 | 454.490 | 183.99 | |||||
| 01/04/2005 | 462.484 | 191.98 | |||||
| 10/04/2005 | 471.473 | 200.97 | |||||
| 13/04/2005 | 474.472 | 203.97 | |||||
| 15/04/2005 | 476.469 | 205.97 | |||||
| * Relative to the epoch of date of explosion(JD = 2453270.5) | |||||||
| Date | J.D. | Phase* | U | B | V | R | I |
|---|---|---|---|---|---|---|---|
| 2453000+ | (days) | ||||||
| 21/04/2005 | 482.403 | 211.90 | |||||
| 06/05/2005 | 497.392 | 226.89 | |||||
| 27/05/2005 | 518.448 | 247.95 | |||||
| 28/05/2005 | 519.385 | 248.89 | |||||
| 01/06/2005 | 523.393 | 252.89 | |||||
| 07/06/2005 | 529.402 | 258.90 | |||||
| 20/06/2005 | 542.419 | 271.92 | |||||
| 24/06/2005 | 546.410 | 275.91 | |||||
| 25/06/2005 | 547.418 | 276.92 | |||||
| 09/07/2005 | 561.414 | 290.91 | |||||
| 19/07/2005 | 571.406 | 300.91 | |||||
| 23/07/2005 | 575.267 | 304.77 | |||||
| 01/08/2005 | 584.290 | 313.79 | |||||
| 07/08/2005 | 590.250 | 319.75 | |||||
| 17/08/2005 | 600.298 | 329.80 | |||||
| 23/08/2005 | 606.235 | 335.73 | |||||
| 10/09/2005 | 624.223 | 353.72 | |||||
| 28/09/2005 | 642.095 | 371.59 | |||||
| 30/09/2005 | 644.133 | 373.63 | |||||
| 17/10/2005 | 661.207 | 390.71 | |||||
| 27/10/2005 | 671.175 | 400.67 | |||||
| 23/11/2005 | 698.109 | 427.61 | |||||
| 26/12/2005 | 731.103 | 460.60 | |||||
| 06/03/2006 | 801.493 | 531.29 | |||||
| 16/03/2006 | 811.426 | 540.93 | |||||
| * Relative to the epoch of date of explosion(JD = 2453270.5) | |||||||
2.2 Spectroscopy
The spectroscopic observations of SN 2004et started on 2004 Oct 16 and continued until 2005 Dec 30, corresponding to 25 days to 465 days after explosion. The journal of observation is given in Table 3. All spectra were obtained in the wavelength range 3500-7000 Å and 5200-9200 Å at a spectral resolution of 7Å. A few spectra, in the wavelength range 4000–8500 Å were also obtained with the 1m telescope at the Vainu Bappu Observatory, Kavalur, India, using the UAG spectrograph. All data were reduced using the standard routines within IRAF. The data were bias corrected, flat-fielded and the one dimensional spectra were extracted using the optimal extraction method. The wavelength calibration was done using FeAr and FeNe lamp spectra. The instrumental response curves were obtained using spectrophotometric standards observed on the same night and the supernova spectra were brought to a relative flux scale. On a few nights when the spectrophotometric standards were not observed, the response curves obtained on other nights were used for the flux calibration. The flux calibrated spectra in the two different regions were combined to a weighted mean to give the final spectrum on a relative flux scale. The spectra were brought to an absolute flux scale using zero points obtained by comparing with the photometric magnitudes. The telluric lines are not removed from the spectra.
| Date | J.D. | Phase* | Range |
| 2453000+ | (days) | Å | |
| 16/10/04 | 295.1 | 24.60 | 3500-7000; 5200-9200 |
| 22/10/04 | 301.1 | 30.60 | 3500-7000; 5200-9200 |
| 27/10/04 | 306.0 | 35.50 | 5200-9200 |
| 30/10/04 | 309.1 | 38.60 | 3500-7000; 5200-9200 |
| 01/11/04 | 311.2 | 40.70 | 3500-7000; 5200-9200 |
| 11/11/04 | 321.0 | 50.50 | 3500-7000; 5200-9200 |
| 16/11/04 | 326.1 | 55.60 | 3500-7000; 5200-9200 |
| 18/11/04 | 328.1 | 57.50 | 4000-8500† |
| 19/11/04 | 329.2 | 58.60 | 4000-8500† |
| 24/11/04 | 334.0 | 63.50 | 3500-7000; 5200-9200 |
| 04/12/04 | 344.1 | 73.60 | 3500-7000; 5200-9200 |
| 14/12/04 | 354.0 | 83.50 | 3500-7000; 5200-9200 |
| 17/12/04 | 357.0 | 86.50 | 3500-7000; 5200-9200 |
| 29/12/04 | 369.1 | 98.60 | 3500-7000; 5200-9200 |
| 12/01/05 | 383.1 | 112.60 | 3500-7000; 5200-9200 |
| 03/03/05 | 433.5 | 163.00 | 3500-7000; 5200-9200 |
| 13/03/05 | 443.5 | 173.00 | 3500-7000; 5200-9200 |
| 25/03/05 | 455.4 | 184.90 | 3500-7000; 5200-9200 |
| 10/04/05 | 471.4 | 200.90 | 3500-7000; 5200-9200 |
| 21/04/05 | 482.4 | 211.90 | 3500-7000; 5200-9200 |
| 06/05/05 | 497.4 | 226.90 | 3500-7000; 5200-9200 |
| 28/05/05 | 516.3 | 245.80 | 3500-7000; 5200-9200 |
| 01/06/05 | 523.4 | 252.90 | 3500-7000; 5200-9200 |
| 07/06/05 | 529.4 | 258.90 | 3500-7000; 5200-9200 |
| 25/06/05 | 547.4 | 276.90 | 3500-7000; 5200-9200 |
| 19/07/05 | 571.4 | 300.90 | 3500-7000; 5200-9200 |
| 01/08/05 | 584.3 | 313.80 | 3500-7000; 5200-9200 |
| 17/10/05 | 661.2 | 390.70 | 3500-7000; 5200-9200 |
| 27/10/05 | 671.1 | 400.60 | 3500-7000; 5200-9200 |
| 23/11/05 | 598.1 | 427.60 | 3500-7000; 5200-9200 |
| 30/12/05 | 735.1 | 464.60 | 3500-7000; 5200-9200 |
| * Relative to the epoch explosion (JD = 2453270.5). | |||
| Observed from VBO, Kavalur. | |||
2.3 Light Curve
The light curves of SN 2004et in the bands are plotted in Fig. 2. Based on the non-detection of the supernova, with a limiting magnitude of , on September 22.017 and the subsequent detection at a magnitude of on September 22.983, Li et al. (2005) constrained the date of explosion to be 2004 September 22.0 (JD 2453270.5). Our photometric observations of SN 2004et thus span the range of 8 days (JD 2453278.2) to 541 days (JD2453811.4) since explosion.
A family of cubic spline fits were made to the observed data points around maximum to estimate the date of maximum and maximum magnitude. The dates of maximum and maximum magnitudes were determined as an average of the values of these fits with the uncertainties given by the respective standard deviation of the estimates. The values thus obtained are (max)= 12.17 on JD 2453279.93, (max)= 12.89 on JD 2453280.90, (max)= 12.55 on JD 2453286.58, (max)= 12.15 on JD 2453291.47 and (max)= 11.91 on JD 2453294.57. The maximum occurred 10 days after the explosion.
The light curves in the bands show an initial rise, followed by a plateau in the bands, which extends upto 110 days from the date of explosion. The plateau in the light curves and a decline rate of mag in the light curve over the first 100 days since maximum light establishes that SN 2004et is a type IIP event, since the decline rate for SNe IIP is (Patat et al., 1994). After the initial rise to maximum, the band light curve declines rapidly till 100 days, while the decline in the band is less steep compared to that of the band. The band light curve shows a slowly declining trend in the plateau phase while the light curve in the and bands show a nearly constant brightness during the plateau phase.

Following the plateau phase, the light curve displays a steep decline of mag in days (day to ; JD2453380 to JD2453420). Subsequently, the decline is linear in all the bands, with decline rates of 0.64, 1.04, 1.01 and 1.07, from 180 days to 310 days after explosion. The decline rate steepens beyond 310 days to 0.84, 1.21, 1.31 and 1.39. The photometric evolution of SNe IIP at late phases is powered by radioactive decay of 56Co into 56Fe, and the expected decay rate is mag (100 d)-1, especially in the band (Patat et al., 1994). Except for the band, the decay rates obtained during the early nebular phase (180–310 days) are close to that of 56Co decay, suggesting that during this phase -ray trapping was efficient. However, the steeper decay rate beyond day 310 indicates that either the supernova had become more transparent to -rays and -ray leakage was significant, or dust formation occurred in the supernova ejecta, or it could be a consequence of both the phenomena.
A comparison of the light curves of SN 2004et with those of the well studied SNe IIP, SN 1999em (Leonard et al., 2002a), and SN 1999gi (Leonard et al., 2002b) is made. The light curves of SN 1999em and SN 1999gi, shifted by arbitrary units in magnitude to match the respective light curves of SN 2004et, are also plotted in Fig. 2. The light curves of all the three SNe are remarkably similar during the early phases. The length of the plateau is also very similar, 100 - 120 days for all three events. However, the rate of decline during the nebular phase (beyond day 150) is different; SN 2004et has a steeper decline, indicating a probable difference in the fraction of -rays that escape through the supernovae ejecta. It may be noted that the late time photometry of the supernovae are affected significantly by the underlying background of the host, which may flatten the light curve. However, as SN 2004et occurred in the outskirts of the spiral arm, with probably no bright underlying region, background contamination in the late phase is expected to be low, but that may not be the case with SN 1999em and SN 1999gi.
In Fig. 3, we compare the absolute light curve of SN 2004et with those of other SNe IIP, namely, SN 1999em (Leonard et al. 2002a; 2001; 2003), SN 1999gi (Leonard et al., 2002b), SN 1997D (, 2001 and references therein), SN 1990E (Schmidt et al., 1993) and SN 1987A (, 1988). The supernovae magnitudes have been corrected for extinction using the Cardelli, Clayton & Mathis (1989) extinction law and the following : 0.21 for SN 1999gi, 0.10 for SN 1999em, 0.00 for SN 1997D, 0.50 for SN 1990E and 0.15 for SN 1987A. A value of = 0.41 is used for SN 2004et (refer Section 4). The distance used to calculate the absolute magnitudes and fluxes are 11.1 Mpc for SN 1999gi (Leonard et al., 2002b), 11.7 Mpc for SN 1999em (Leonard et al., 2003), 13.4 Mpc for SN 1997D (, 2001 and references therein), 21 Mpc for SN 1990E (Schmidt, Krishner & Eastman, 1992) and 0.0468 Mpc for SN 1987A (, 1988). A distance of 5.6 Mpc is used for SN 2004et (refer Section 4). Distance estimates for SN 1990E and SN 1999gi are based on the expanding photosphere method (EPM), SN 1999em distance estimate is based on Cepheid variables (Leonard et al., 2003). For SN 1999em Cepheid distance is nearly 50% greater than the values derived using the EPM. The major source of discrepancy between the distances based on EPM and Cepheid may be attributed to the underestimate of the theoretically derived dilution factors used in EPM analysis, however, other sources of statistical and systematic uncertanity can not be neglected.
The shape of the light curves of SN 2004et, SN 1999em and SN 1999gi are very similar and the length of the plateau is also almost the same. The absolute magnitude of SN 2004et is similar to that of SN 1990E and is brighter than the other SNe IIP compared here. The average absolute magnitude during the plateau phase, estimated by taking the unweighted mean of the magnitudes from 20 to 100 days after the explosion is for SN 2004et, for SN 1999gi and for SN 1999em.
The reddenning corrected , , and colour curves of SN 2004et are shown in Fig. 4. Also shown in the same figure, for comparison, are the respective colour curves of SN 1999em, SN 1999gi and SN 1990E. There is a noticable difference in the colour evolution of SN 2004et with those of other SNe IIP in comparison. As noted by Li et al. (2005), during the first month the and colours of SN 2004et evolve more slowly compared to SN 1999em, the same trend continues till 150 days since explosion. During this period the overall colours of SN 2004et are bluer compared to the other SNe IIP. Beyond 200 days after explosion, the and colours of SN 2004et are similar to the other SNe IIP. The colour is bluer compared to SN 1999em even beyond day 200.


3 Spectroscopy
3.1 Spectroscopic evolution
The spectroscopic evolution of SN 2004et in the rest frame of the SN is displayed in Fig. 5 and Fig. 7. All the spectra have been Doppler corrected for the recession velocity of the host galaxy, taken as 45 km sec-1 (, 1981). Our first spectrum corresponds to 25 days after explosion. The spectrum has a blue continuum with well developed P-Cygni profiles of hydrogen Balmer lines (upto H). The H line is emission dominated with a shallow P-Cygni profile, which appears to consist of two components. The second, high velocity absorption component is shown marked A in Fig. 5. Apart from the hydrogen Balmer lines, CaII (H & K) lines 3934, 3968 Å, Fe II 5169 Å and the CaII IR triplet 8498, 8542, 8662 Å are clearly seen in the spectrum. Interstellar NaI D absorption features at 5890, 5896 Å are also present. By day 39, NaI D absorption lines, Fe II lines 4924, 5018, 5535 Å, Sc II line 5527 Å and other blends of Fe II, Sc II, Ba II start appearing. Fig. 6 shows the spectrum taken 63 days after the explosion, with line identification following Leonard et al. (2002a). In the later phase, days after explosion, except for H and H, the Balmer lines are obscured by metal lines.
The two-component P-Cygni profile of H noted by (Li et al., 2005) in a spectrum obtained 20 days after the explosion, is clearly seen in our spectrum of day . This feature was present until days, until the end of the plateau phase. This feature was also present in the spectrum of SN 1999em and has been identified as a high velocity component of H (Leonard et al., 2002a). Similar high velocity component features are noticed in the H and Na I lines also. These high velocity components could be arising due to interaction of the supernova ejecta with the pre-supernova circumstellar material. Baron et al. (2000) interpret the double component P-Cygni profiles as being produced by a combination of the usual wide P-Cygni profile and a second P-Cygni profile with a highly blueshifted absorption, corresponding to two line forming regions in the expanding atmosphere of the supernova.
As the supernova ages, the absorption components of H, H and the CaII IR triplet become narrower and deeper. In the blue region of the spectrum numerous metal lines due to Fe, Sc, Ba and Sr appear and the emission line strength increases with time till the supernova enters into the nebular phase. The spectrum obtained days after the explosion is still dominated by absorption features due to metal lines, indicating that the supernova had not yet entered into the nebular phase. However, forbidden lines due to oxygen [O I] 6300, 6364 Å, iron [Fe II] 7155 Å, calcium [Ca II] 7291, 7324 Å start appearing in the spectrum. The spectrum obtained days after explosion shows a significant evolution compared to day 113. The spectrum is more emission dominated, featuring the onset of the nebular phase. In this spectrum, the H profile has narrowed down and the nebular emission lines of [O I] 6300, 6364 Å and [Ca II] 7291, 7324 Å are well developed.
In the spectra of day 391 and later, the [Ca II] 7291, 7324 Å line is strong compared to H, a feature noticed in the spectrum of SN 1999em around the same epoch (, 2003), but not detected in the SNe IIP, SN 1990E (, 1994), SN 1997D (, 2001 and references therein) and SN 2003gd (Hendry et al., 2005). Fig. 8 shows the luminosity evolution of the nebular lines, H and [OI] 6300, 6364 Å for SN 2004et. Also shown in the same figure, for a comparison, are the corresponding luminosities for SN 1987A at similar epochs. The nebular line luminosities of SN 2004et before day 300 are similar to SN 1987A. Beyond day 400, SN 2004et lines have lower luminosities.


3.2 Expansion velocity of SN 2004et
The photospheric velocity of the ejecta can be estimated from the minimum of the absorption feature of weak, unblended lines. (2001) have shown that the use of Fe II (multiplet 42) at 4924, 5018, 5169 Å provides a good estimate of the photospheric velocity during the plateau phase. As the supernova ages, it becomes difficult to define the minimum of Fe II 5169 Å line and hence the velocity measurement using this line is not a good estimate at these phases. The photospheric velocity estimated using these lines is plotted in Fig. 9. The velocity estimated using the Fe II 4924 Å line (ref. Fig. 9) is lower due to the blending of this line with Ba II 4934 Å (Hendry et al., 2005).
Also plotted in the Fig. 9 are the velocities determined using the absorption minima of H, H, and the high velocity component of H. These velocity estimates are higher due to higher optical depths. The evolution of the high velocity component of H is similar to that of normal component. A comparison of the photospheric expansion velocity determined for SN 2004et, using the weak unblended iron lines, with those of SN 1999em (, 2001) and SN 1999gi (Leonard et al., 2002b) indicates that SN 2004et has a higher expansion velocity at simliar epochs. For further analyses, we use the average photospheric velocity estimated using the weak iron lines.

4 Reddening and distance estimates
The interstellar Na lines are clearly seen in the spectra presented here. The equivalent width of the Na I D lines measured from the spectra presented here is 1.70Å, which corresponds to a total reddening of mag, following the empirical relation by Barbon et al. (1990). This estimate is consistent with the estimate by Zwitter, Munari & Moretti (2004) based on equivalent widths of the Na I lines in a high resolution spectrum. The Galactic reddening in the direction of NGC 6946 is mag (Schlegel, Finkbeiner & Davis, 1998), which implies that the supernova has suffered minimal extinction in the host galaxy. We use (Zwitter, Munari & Moretti, 2004) mag as the total reddening for further analysis.
The HI Tully Fisher relation (, 1994) indicates a distance of 5.5 Mpc to NGC 6946, while the CO Tully Fisher relation (Schoniger & Sofue, 1994) indicates a distance of 5.4 Mpc. The “expanding photosphere method” for the IIP supernova SN 1980K that occurred in NGC 6946 (Schmidt et al., 1994) yields a distance of 5.7 Mpc. (2002) have shown that the expansion velocities of the ejecta of SNe IIP are correlated with their bolometric luminosities during the plateau phase. Based on this correlation they establish a “standard candle method (SCM)” to estimate the distance to the supernovae. Nugent et al. (2006) proposed a refinement to the SCM method by introducing the use of colour during the plateau phase at day 50 to perform extinction correction rather than relying on colours at the end of the plateau. Using equation 1 of Nugent et al. (2006), with the fitting parameters for low redshift SNe IIP and the observed expansion velocity at day 50 km sec-1 we estimate the distance to SN 2004et as Mpc. Based on all the estimates, an average distance of 5.6 Mpc is assumed for SN 2004et.
5 bolometric light curve and 56Ni mass
5.1 bolometric light curve
The photometry presented in Section 2.3 is used to derive the bolometric light curve of SN 2004et. The optical magnitudes have been corrected for reddening values mentioned in Section 2.3 using Cardelli, Clayton & Mathis (1989) extinction law, the corrected magnitudes are then converted to fluxes according to Bessell, Castelli & Plez (1998). The bolometric fluxes were derived by fitting a spline curve to the and fluxes and integrating it over the wavelength range 3200Å to 10600Å, determined by the response of the filters used. There are some gaps in the band light curve specially after the plateau; the missing magnitudes were obtained by interpolation. In the later stage, however, the light curve is linearly extrapolated to get the missing magnitudes in the band. No corrections have been applied for the missing fluxes in the ultra-voilet and the near infra-red region. Fig. 10 shows the bolometric light curve of SN 2004et. Also plotted in the same figure are the bolometric light curves of SN 1999em, SN 1999gi, SN 1997D and SN 1990E. The bolometric light curve for SN 1990E is taken from the literature (Schmidt et al., 1993), while for other supernovae the bolometric luminosities are derived from the photometry reported in the references cited in Section 2.3. Since no band magnitudes were available for SN 1999gi and SN1997D the contribution of the flux to the total flux was assumed to be similar to SN 1999em and SN 2004et. A comparison of the bolometric light curve of SN 2004et with the other SNe IIP indicates SN 2004et had a higher luminosity. The luminosity during the initial phases is very similar to SN 1990E but its considerably lower in the post-plateau decline.

5.2 56Ni mass
For most SNe IIP, the early (150-300d) bolometric luminosity on the radioactive tail is equal to the luminosity of the radiaoctive decay of 56Co. The mass of 56Ni synthesized during the supernova explosion can thus be estimated from the late time bolometric light curve. In absence of infra-red photometry for SN 2004et, we followed (2003), to estimate the tail bolometric luminosity , using the magnitudes during the nebular phase and a bolometric correction of 0.26 mag. The tail luminosity is then used to estimate the nickel mass using equation 2 in (2003). Based on the luminosity of SN 2004et during 250 to 315 days, estimated using the magnitudes, we estimate the 56Ni mass to be .
(2003) find a correlation with the 56Ni mass and the rate of decline in the band light curve from the plateau to the tail. The maximum gradient during the transition from plateau to nebular phase, defined by a steepness parameter , is found to anticorrelate with 56Ni mass, in the sense that the steeper the decline at the inflection, the lower is the 56Ni mass. Using a sample of 10 SNe IIP, (2003) derive the following relation
| (1) |
An accurate determination of the steepness parameter requires a well sampled band light curve during the end of plateau to the beginning of the radioactive tail. Unfortunately, we do not have a very well sampled light curve during this phase. However, with the available points, we estimate the steepness parameter as . Using this, the mass of 56Ni is found to be , which agrees very well with the 56Ni mass derived from magnitude on the radioactive tail.
The nickel mass may also be estimated comparing the bolometric light curve of SN 2004et with that of SN 1987A, assuming that the -ray deposition for SN 2004et is the same as that for SN 1987A. The tail bolometric luminosity of SN 2004et () is found to be times fainter than that of SN 1987A. This implies a 56Ni mass of for SN 2004et, for a value of for SN 1987A (Turatto et al., 1998 and references therein). This will be the lower limit of 56Ni mass, as the bolometric curve for SN 2004et does not include contribution from near-infra-red region.
The mean nickel mass derived using the band magnitudes in the nebular phase and steepness parameter is .
Chugai (1990) and (2003) find that the H luminosity at the nebular phase can be used to estimate the nickel mass. The H luminosity is found to be proportional to 56Ni mass during 200-400 days after the explosion. Comparing the H luminosity of SN 2004et around day 250 (ref. Fig. 8 top panel) with that of SN 1987A during the same phase, it is found that the H luminosities in both SNe are similar. Assuming the mass, energy and mixing conditions do not vary strongly, this indicates the nickel mass in SN 2004et to be similar to that estimated for SN 1987A. This is consistent with the photometric estimates.
6 Dust formation in the ejecta
The formation of dust in the supernova ejecta increases the rate of decline of the optical, especially the band, light curve, as the optical light is reprocessed by the dust and an excess emission in is observed. Further, dust formation in the inner envelope of the supernova ejecta shifts the peak of the optical and infrared emission lines towards blue, due to a preferential extinction of the redshifted edge of the emission lines by the dust (Lucy et al., 1991). The signature of dust formation was seen in SN 1987A (Danziger et al., 1991) and SN 1999em (, 2003) as an observable blueshift in the emission peaks of the [OI] doublet components, beyond days. It should be noted that both SNe showed an early blueshift ( days) in the [OI] component, probably as a result of superposition of the blend of Fe II lines (multiplet 74).

Fig. 11 shows the temporal evolution of the H and [O I] 6300, 6364 Å line profiles during 277–465 days. A blueshift in the emission peak is clearly seen beyond day 300 in both lines. Further, the H line shows a clear flattening of the emission peak. The blueshift in the emission peak and the flattening were seen in both SN 1987A and SN 1999em during the dust formation epoch. The absence of any ‘blue bump’ in the [OI] line due to Fe II 6250 Å feature (ref. Fig. 11, top panel) indicates that the observed blue shift in the emission peak is not due to a blending of Fe II lines, and more likely due to dust formation.
It is evident from Fig. 3 that the decline rate of the light curve of SN 2004et in the band starts steepening days after the explosion. A similar effect was seen in both SN 1987A and SN 1999em during dust formation. It should, however, be noted here that dust formation occurred at much later phases, beyond day 400 in both these SNe.
The evolution of the emission line profiles together with the steeping of the light curve beyond day suggest an early dust formation in the case of SN 2004et.
7 Progenitor star properties
The supernova outburst properties depend on three basic parameters: the mass of the envelope that is ejected, the radius of the star prior to the outburst and the energy of explosion. An analysis of supernova light curve combined with the spectroscopic evolution allows the derivation of these important parameters. With the help of hydrodynamic models of SNe IIP, Litvinova & Nadyozhin (1985) derived expressions for these parameters in terms of the observable parameters, namely, the length of the plateau , the absolute magnitude at the midpoint of the plateau and the velocity of photosphere at mid plateau.
The light curve of SN 2004et indicates the length of the plateau to be = 120 days. The absolute magnitude at mid plateau is mag. The weak iron lines indicate a mid plateau velocity km sec-1. Using these values and the relations given by Litvinova & Nadyozhin (1985) we estimate the explosion energy ergs.
The luminosity of [OI] doublet yr after the explosion is powered by the -ray deposition and by ultraviolet emission arising from the deposition of -rays in oxygen-poor material. The [OI] doublet luminosity is related to the mass of oxygen, the ‘excited’ mass in which the bulk of the radioactive energy is deposited and the efficieny of transformation of the energy deposited in oxygen into the [OI] luminosity. The [OI] luminosity in SN 1987A implies an oxygen mass in the range . The fact that derived [OI] luminosity for SN 2004et before dust formation is comparable to that of SN 1987A at similar epochs implies similar oxygen mass in SN 2004et also. The nucleosynthesis computations (Chugai 1994, Woosley & Weaver 1995) indicate that this oxygen mass corresponds to a main-sequence stellar mass of . An analysis of the radio light curve of SN 2004et by Chevalier, Fransson & Nymark (2006) indicates a mass loss rate for the progenitor that suggests a mass of , similar to the estimate based on a comparison of the [OI] luminosity with that of SN 1987A. However, Li et al. (2005) estimate the progenitor mass to be and also the progenitor to be a yellow supergiant.
8 Summary
We have presented photometric and spectroscopic data for SN 2004et from until days after the explosion. The shape of the light curve as well as the spectral evolution indicate that it is Type IIP supernova, which was caught young, soon after the shock breakout. SN 2004et reached maximum in band on JD 2453280.90, days after the explosion. The luminosity at maximum indicates SN 2004et to be at the brighter end of SNe IIP. The late phase photometry indicates that the decline rate of light curve during d was similar to the 56Co to 56Fe radioactive decay, while it was significantly faster beyond d.
The spectra of SN 2004et in early phase shows an H profile that is emission dominated with P-Cygni profile that is shallower than other SNe IIP. The velocity evolution of SN 2004et determined using the weak iron lines is similar to other well studied SNe IIP, although the photospheric velocity in SN 2004et was higher than other SNe IIP at all epochs. The H line indicates the presence of a high velocity component in the early phases, with the velocity of this component being km sec-1 higher than the normal component.
The mass of 56Ni synthesized during the explosion is estimated to be .
The H and [OI] 6300, 6364 Å line profile evolution beyond day 320, and the steepening of the light curve at the same epoch is interpreted as an effect of an early dust formation.
The brightness of the plateau, its duration and the expansion velocity of the supernova at the middle of the plateau is used to estimate the explosion energy ergs. The main-sequence mass of the progenitor based on [OI] luminosity is estimated to be .
Acknowledgements
We thank the anonymous referee for useful comments, which helped in improving the manuscript. We thank all the observers of the 2-m HCT who kindly provided part of their observing time for the supernova observations. We also thank Jessy Jose and S. Ramya for their help during observations. This work has made use of the NASA Astrophysics Data System and the NASA/IPAC Extragalactic Database (NED) which is operated by Jet Propulsion Laboratory, California Institute of Technology, under contract with the National Aeronautics and Space Administration.
References
- Barbon et al. (1990) Barbon R., Benetti S., Rosino L., Cappellaro E., Turatto M., A&A, 237, 79.
- Baron, Ciatti & Rosino (1979) Baron R., Ciatti F., Rosino L., 1979, A&A, 72, 287.
- Baron et al. (2000) Baron E., Branch D., Hauschildt P.H., Filippenko A.V., Kirshner R.P., Challis P.M., Jha S., Chevalier R.Fransson C. et al., 2000, ApJ, 545, 444.
- (4) Benetti S., Cappellaro E., Turatto M., Della Valle M., Mazzali P., Gouiffes C., 1994, A&A 285, 147.
- (5) Benetti S., Turatto M., Balberg S., Zampieri L., Shapiro S.L., Cappellaro E., Nomoto K., Nakamura T., Mazzali P., Patat F., 2001, MNRAS, 322, 361.
- Bessell (1990) Bessell M.S., 1990, PASP, 102, 1181.
- Bessell, Castelli & Plez (1998) Bessell M.S., Castelli F., Plez B., 1998, A&A, 333, 231.
- Cardelli, Clayton & Mathis (1989) Cardelli J.A., Clayton G.C., Mathis J.S., 1989, ApJ, 345, 245.
- Chevalier, Fransson & Nymark (2006) Chevalier R.A., Fransson C., Nymark T.K., 2006, ApJ, 641, 1029.
- Chugai (1990) Chugai N.N., 1990, SvAL, 16, 457.
- Chugai (1994) Chugai N.N., 1994, ApJ, 428, L17.
- Danziger et al. (1991) Danziger I.J., Lucy L.B., Bouchet P., Gouiffes C., 1991 in Supernovae, eds. Woosley S.E., New York, Springer, p69.
- (13) Elmhamdi A., Chugai N.N., Danziger I.J., 2003, A&A 404, 1077
- (14) Elmhamdi A., Danziger I.J., Chugai N., Pastorello A., Turatto M., Cappellaro E., Altavilla G., Benetti S., Patat F., Salvo M., 2003, MNRAS, 338, 939.
- Filippenko et al. (2004) Filippenko A.V., Foley, R.J., Treu, T., Malkan, M. A., 2004, IAU Circ. 8414.
- (16) Hamuy M., 2003, ApJ, 582, 905.
- (17) Hamuy M., Pinto P.A., 2002, ApJL, 566, L63.
- (18) Hamuy M., Suntzeff N.B., Gonzalez R. Martin G., 1988, AJ, 95, 63.
- (19) Hamuy M., Pinto P.A., Maza J., Suntzeff N.B., Phillips M.M., Smith R.C., Corbally C.J., Burstein D., Li Y., 2001, ApJ, 558, 615.
- Hendry et al. (2005) Hendry M.A., Smart S.J., Maund J.R., Pastorello A., Zampieri L., Benetti S., Turatto M., Cappellaro E, Meikle W.P.S. et al., 2005, MNRAS, 359, 906.
- Landolt (1992) Landolt A.U., 1992, AJ, 104, 340
- Leonard et al. (2002a) Leonard D.C., Filippenko A.V., Gates E.L., Li W., Eastman R.G., Barth A.J., Bus S.J., Chornock R., et al. 2002a, PASP, 114, 35.
- Leonard et al. (2002b) Leonard D.C., Filippenko A.V., Li W., Matheson T., Kirshner R.P., Chornoch R., Van Dyk S.D., Berlind P., et al., 2002b, AJ, 124, 2490.
- Leonard et al. (2003) Leonard D.C., Kanbur S.M., Ngeow C.C., Tanvir N.R., 2003, ApJ, 594, 247.
- Li, Filippenko & Van Dyk (2005) Li Weidong, Filippenko, A.V., and Van Dyk S.D., 2005, Astronomer’s Telegram (ATel) 492
- Li et al. (2005) Li Weidong, Van Dyk S.D., Filippenko, A.V., and Cuillandre Jean-Charles, 2005, PASP, 117, 121.
- Li et al. (2006) Li Weidong, Van Dyk S.D., Filippenko A.V., Cuillandre J., Jha S., Bloom J.S., Riess A.G., Livio M., 2006, ApJ, 641, 1060.
- Litvinova & Nadyozhin (1985) Litvinova Y., Nadyozhin D.K., 1985, Sov. Astron. Lett, 11, 45.
- Lucy et al. (1991) Lucy L.B., Danziger I.J., Gouiffes C., Bouchet P., 1991 in SANTA CRUZ, p82.
- Nugent et al. (2006) Nugent P., Sullivan M., Ellis R., Gal-Yam A., Leonard D.C., Howell D.A., Astier P., Carlberg R.G., 2006, astro-ph/0603535.
- Patat et al. (1994) Patat F., Baron R., Cappallaro E., Turatto M., 1994, A&A, 282, 731
- (32) Pierce M.J., 1994, ApJ, 430, 53
- (33) Sandage A., Tammann G.A., 1981, Revised Shapley-Ames Catalog of Bright Galaxies
- Schlegel, Finkbeiner & Davis (1998) Schlegel D.J., Finkbeiner D.P., Davis M., 1998, ApJ, 500, 525
- Schmidt, Krishner & Eastman (1992) Schmidt B.P., Krishner R.P., Eastman R.G., 1992, ApJ, 395, 366.
- Schmidt et al. (1993) Schmidt B.P., Krishner R.P., Schild R., Leibundgut B., Jeffery D., Willner S.P., Peletier R., Zabludoff A.I. et al., 1993, AJ, 105, 2236
- Schmidt et al. (1994) Schmidt B.P., Krishner R.P., Eastman R.G., Phillips M.M., Suntzeff N.B., Hamuy M., Maza J., Aviles R., 1994, ApJ, 432, 42.
- Schoniger & Sofue (1994) Schoniger F., Sofue Y., 1994, A&A, 283, 21.
- Smartt et al. (2004) Smartt S.J., Maund J.R., Hendry M.A., Tout C.A., Gilmore G.F., Mattila S., Benn C.R., 2004, Sci., 303, 499.
- Stockdale et al. (2004) Stockdale C.J., Weiler, K.W., Van Dyk, S.D., Sramek, R.A., Panagia, N., and Marcaide, J.M., 2004, IAU Circ., 8415.
- Suntzeff & Bouchet (1990) Suntzeff N.B., Bouchet P., 1990, AJ, 99, 650.
- Turatto et al. (1998 and references therein) Turatto M., Mazzali P. A., Young T. R., Nomoto K., Iwamoto K., Benetti S., Cappallaro E., Danziger I. J. et al., 1998, ApJL, 498, L129.
- Van Dyk et al. (2003) Van Dyk S.D., Li W., Filippenko A.V., 2003 PASP, 115, 1289.
- Woosley & Weaver (1995) Woosley S.E., Weaver T.A., 1995, ApJS, 101, 181
- Zwitter, Munari & Moretti (2004) Zwitter T., Munari U., Moretti S., 2004, IAU Circ. 8413, 1.