“The Perfect Slope”: A new robust low-scatter X-ray mass
indicator
for clusters of galaxies
This presentation is a Moriond version of our recent paper (Kravtsov, Vikhlinin & Nagai ) where we discussed X-ray proxies for the total cluster mass, including the spectral temperature (), gas mass measured within (), and the new proxy, , which is a simple product of and . We use mock Chandra images constructed for a sample of clusters simulated with high resolution in the concordance CDM cosmology. The simulated clusters exhibit tight correlations between the considered observables and total mass. The normalizations of the , , and relations agree to better than with the current observational measurements of these relations. Our results show that is the best mass proxy with a remarkably low scatter of only in for a fixed , at both low and high redshifts and regardless of whether clusters are relaxed or not. In addition, we show that redshift evolution of the relation is close to the self-similar prediction, which makes a very attractive mass indicator for measurements of the cluster mass function from X-ray selected samples.
1 Introduction
The evolution of the cluster abundance is one of the most sensitive probes of cosmology. The potential and importance of this method have motivated efforts to construct several large surveys of high-redshift clusters during the next several years. However, in order to realize the full statistical power of the upcoming cluster surveys, it is paramount that the relation between cluster mass and observables and any potential biases are well known.
Several cluster observables based on the galaxy velocities, optical light, X-ray observables such as luminosity, temperature, mass of the intracluster medium (ICM), and Sunyaev-Zel’dovich flux have been proposed as proxies of the total cluster mass (see a recent review by Voit ). In this study we focus on the mass indicators derived from cluster X-ray observables.
X-ray luminosity is the most straightforward mass indicator to measure observationally. However, is also the least accurate (internally) of all proposed X-ray proxies for with a large scatter and deviations of the slope of the relation from the self-similar prediction . The most common choice of mass proxy in the cluster cosmological studies has been the X-ray temperature of the intracluster gas . The scatter in the relation is smaller compared to that in the relation (the upper limit from observations is in for fixed for relaxed clusters ). In general, existence of a tight relation such as indicates that clusters are regular population of objects with their global properties tightly related to total mass, and scatter caused by secondary effects such as substructure in the ICM, non-gravitational processes, and mergers . More recently, gas mass was used as a proxy for . The practical advantage of over is that it can be measured from the X-ray imaging alone. Also, can be expected to be less sensitive to mergers which should translate into smaller scatter in the relation. The caveat is that trend of gas mass with cluster mass and evolution with redshift are not yet fully understood.
The use of clusters as efficient probes for precision cosmology puts stringent requirements on observable cluster mass proxies: 1) tight, low-scatter correlation between the proxy and mass, with the scatter insensitive to mergers etc., and 2) simple power-law relation and evolution which can be described by a small number of parameters and be as close as possible to the prediction of the self-similar model. The last point is crucial to ensure that the self-calibration strategies for analyses of large cluster surveys are successful. This is because self-calibration is powerful when cluster scaling relations and their evolution have a simple form which can be parameterized with a small number of parameters.
In general, a mass proxy does not have to be a single cluster property, such as , or . Any physically-motivated combination of these variables that is expected to be tightly related to cluster mass can be used to construct a valid mass indicator. A hint for a better X-ray mass proxy is provided by recent studies based on cosmological simulations of cluster formation , which show that integrated SZ flux, is a good, robust mass indicator with low scatter in the relation, regardless of the dynamical state of the cluster. In addition, the relation exhibits a simple, nearly self-similar evolution with redshift . The physical reason for the robustness of the SZ flux is straightforward: is directly related to the total thermal energy of the ICM and thus to the depth of the cluster potential well.
Here we show that a similar robust, low-scatter mass indicator can be constructed using X-ray observables. The indicator, which is simply the product of the X-ray derived gas mass and average temperature, , correlates strongly with cluster mass with only intrinsic scatter. The relation is robust to mergers, in the sense that even for disturbed unrelaxed systems it gives unbiased estimates of mass with the statistical uncertainty similar to that for relaxed systems. In addition, we show that evolution of the slope and normalization of the relation is nearly self-similar. These properties make particularly useful for measurements of cluster mass function using X-ray surveys.
2 Mass Proxies
Physical properties of virialized systems, such as clusters, are expected to correlate with their total mass. For example, in the self-similar model the cluster gas mass is expected to be simply proportional to the total mass, , where masses are determined within a radius enclosing a certain overdensity with respect to the critical density of the universe at the epoch of observation, , and is a constant independent of cluster mass and redshift. The self-similar relation between cluster mass and temperature is Here the function for a flat cosmology with the cosmological constant assumed throughout this study is given by .
The SZ flux integrated within a certain radius, , is proportional to the total thermal energy of the ICM gas and thus to the overall cluster potential, which makes it relatively insensitive to the details of the ICM physics and merging. is proportional to the ICM mass and gas mass-weighted mean temperature, . The self-similar prediction for the relation is
| (1) |
Cosmological simulations show that is a good, low-scatter cluster mass proxy and that relation form and evolution are close to the self-similar prediction . Given the good qualities of as a mass proxy, it is interesting whether a similar indicator can be constructed from the X-ray observables, which could be used in studies of the X-ray cluster abundances. The simplest X-ray analog of is
| (2) |
where is the gas mass derived from the X-ray imaging data (it is measured within a radius enclosing overdensity ), and is the mean X-ray spectral temperature. is measured excluding the central cluster region, which can be achieved with moderate angular resolution X-ray telescopes ( FWHM). To excise the central regions is desirable because the observed cluster temperature profiles show a greater degree of similarity outside the core , and also because this makes the spectral temperature closer to the gas mass averaged .
3 Mock Chandra Images and Analyses of Simulated Clusters
To test the quality of , , and as the total mass proxies, we take the following approach. We use the output of the high-resolution cosmological simulations of clusters in a wide mass range to predict their X-ray emission maps. These maps are convolved with the response of the Chandra telescope to create realistic mock “observations” of these clusters. The mock data are used as an input to the actual X-ray data analysis pipeline and measure the proxies (, , and ) as they would be derived by observers.
The simulations and analysis procedure is fully described in Kravtsov et al. The cosmological simulations accurately follow the cluster growth from inital conditions using Adaptive Refinement Tree (ART) -bodygasdynamics code , a Eulerian code that reaches the high dynamic range required to resolve cores of mass halos. The peak formal resolution achieved in these simulations, kpc, is sufficient to resolve halos of individual galaxies and to follow not only dissipationless dynamics of dark matter and gasdynamics of the ICM, but also star formation, metal enrichment and thermal feedback due to the supernovae type II and type Ia, self-consistent advection of metals, metallicity dependent radiative cooling and UV heating due to cosmological ionizing background.
Generation and analysis of the mock X-ray data reproduces all the effects associated with the Chandra response and reconstruction of the 3D ICM properties from the observed projected X-ray spectra. The only exception is that we ignore complications present in reduction of the real Chandra data related to background subtraction and spatial variations of the effective area (i.e., we assume that accurate corrections for these effects can be applied to the real data and any associated uncertainties are included in the reported measurement errors).
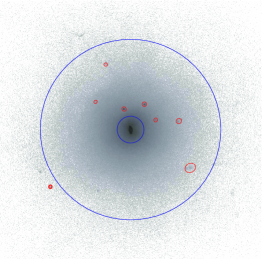
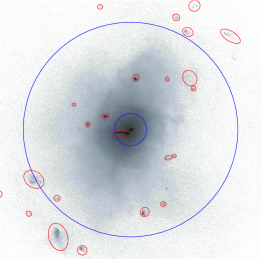
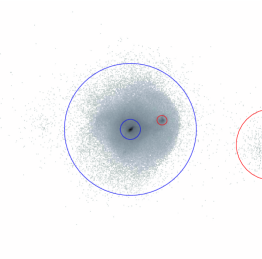
Our simulations include clusters in a wide range of mass and dynamical state. We use simulation outputs at redshifts and to test the evolution in the mass vs. proxy relations. Examples of the mock Chandra images are shown in Fig.1.
4 Comparison of Mass Indicators
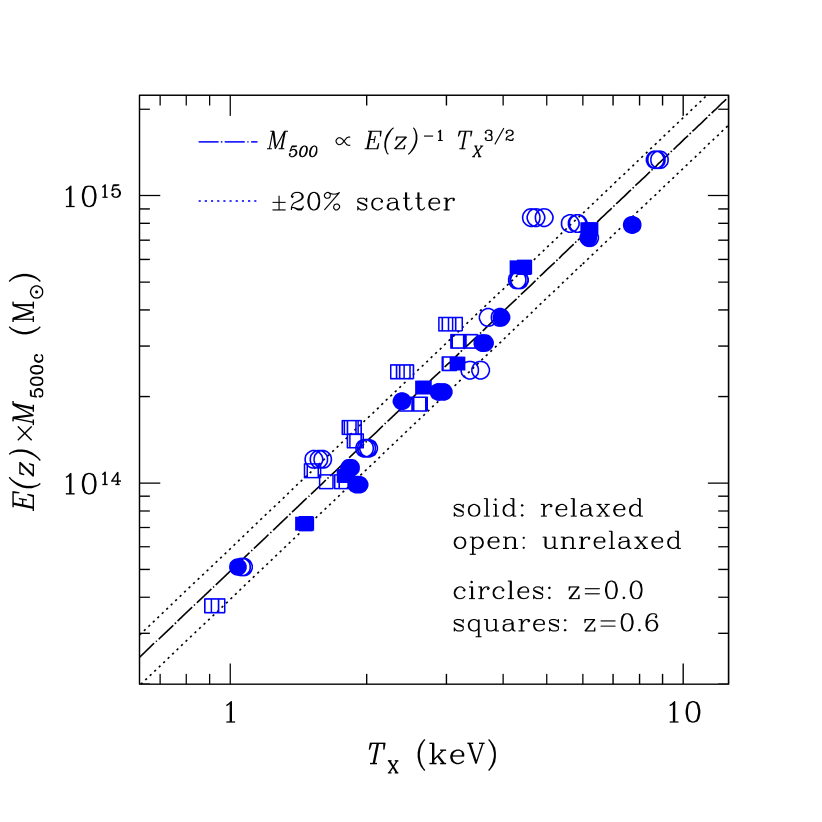
Figure 3 shows that the slope and evolution of the relationaaaHereafter, is the total mass within the sphere corresponding to the mean overdensity of 500 relative to the critical density at the cluster redshift. are quite close to the self-similar model. There is a scatter in around the mean relation and much of the scatter is due to unrelaxed clusters. Note also that the normalizations of the relation for relaxed and unrelaxed systems are somewhat different: unrelaxed clusters have lower temperatures for a given mass. This may seem counter-intuitive at first, given that one can expect that shocks can boost the ICM temperature during mergers. However, in practice the effect of shocks is relatively small . The main source of the bias is that during advanced mergers the mass of the system already increased but only a fraction of the kinetic energy of merging systems is converted into the thermal energy of the ICM .
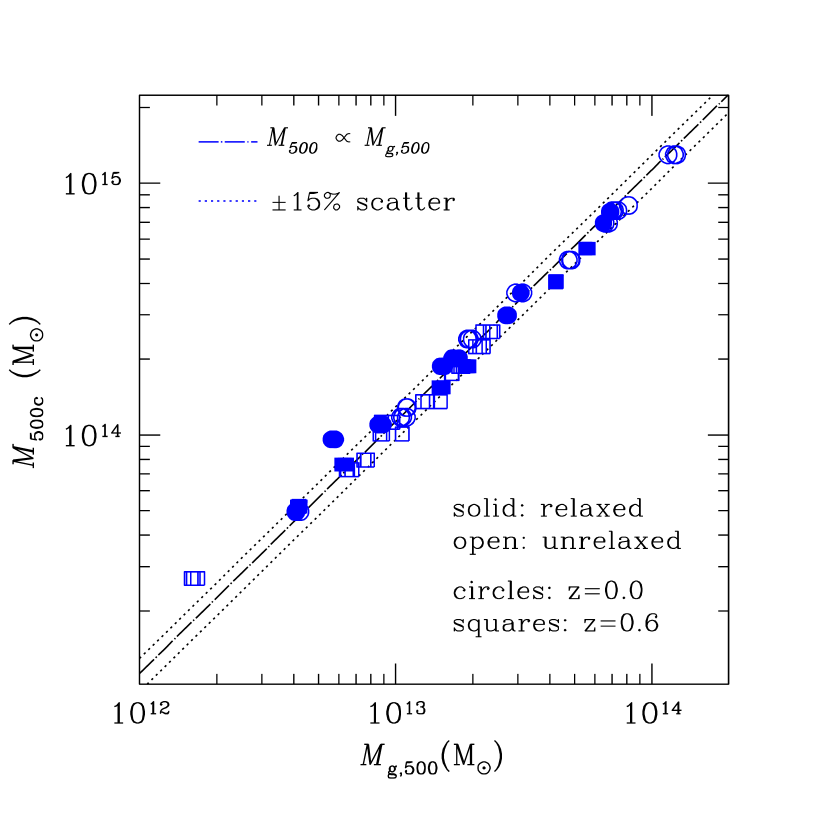
The relation (Fig. 3) has a somewhat smaller scatter () around the best fit power law relation than the , but its slope is significantly different from the self-similar prediction — we find compared to the expected . This is due to the trend of gas fraction with cluster mass, present for both the simulated clusters in our sample and for the observed clusters . The normalization of the relation evolves only weakly between and (yet, the evolution is statistically significant and it reflects slow evolution of the gas fraction with time ).
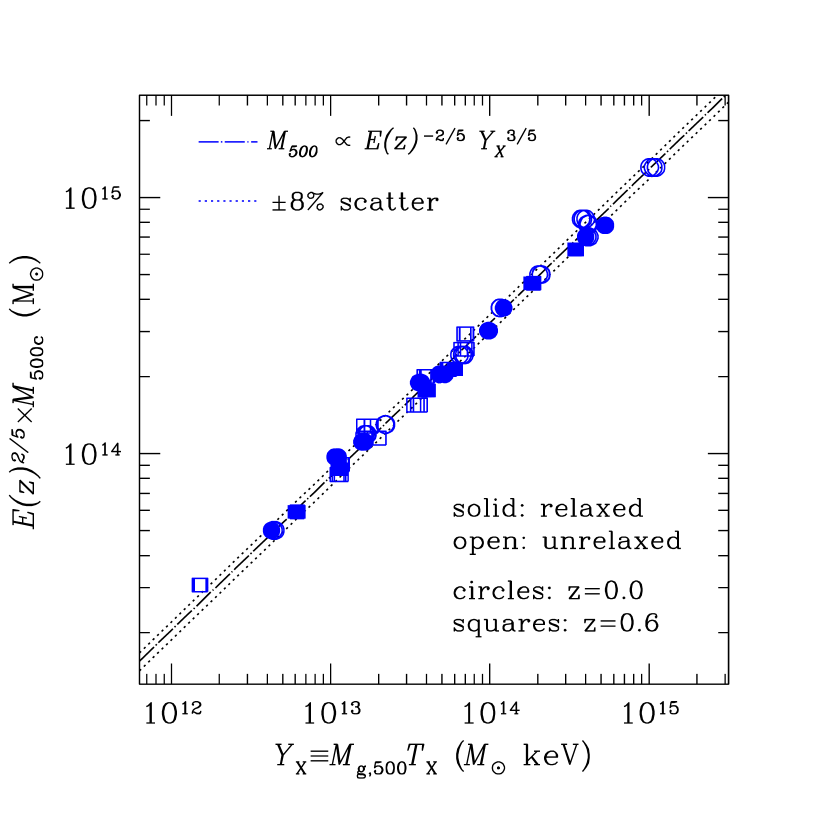
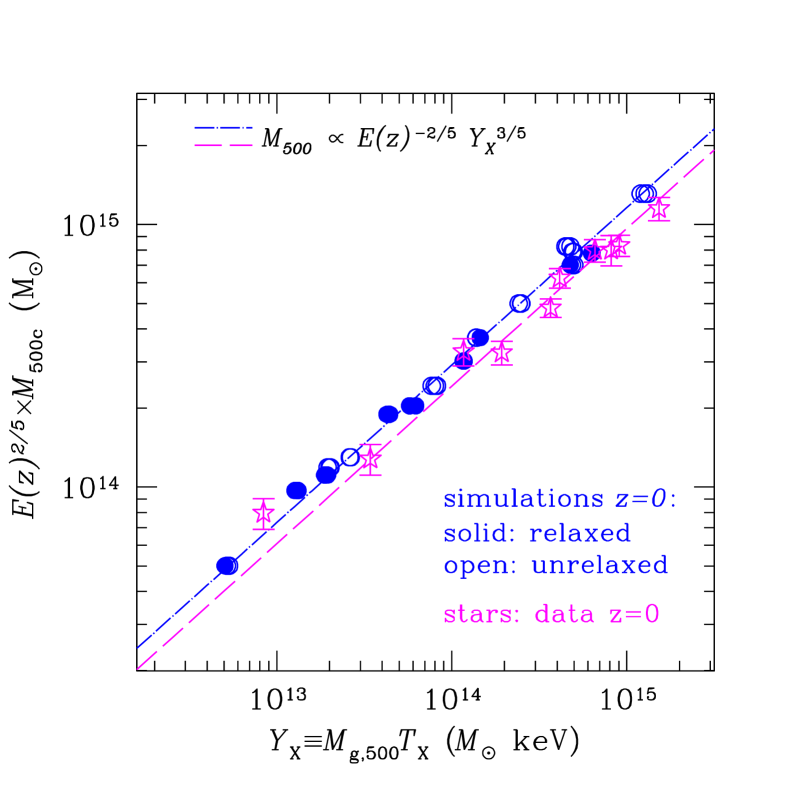
The relation (Fig. 5) has the smallest scatter of only . Note that this value of scatter includes clusters at both low and high-redshifts and both relaxed and unrelaxed systems. In fact, the scatter in for relaxed and unrelaxed systems is indistinguishable within the errors. Note also that the figures include points corresponding to the three projections of each cluster. Figure 5 shows that the dispersion in the projected values of for each given cluster is very small, which means that is not very sensitive to the asphericity of clusters. Remarkably, the scatter of the relation, which involves direct X-ray observables, is as small as that in the relation ( for our sample).
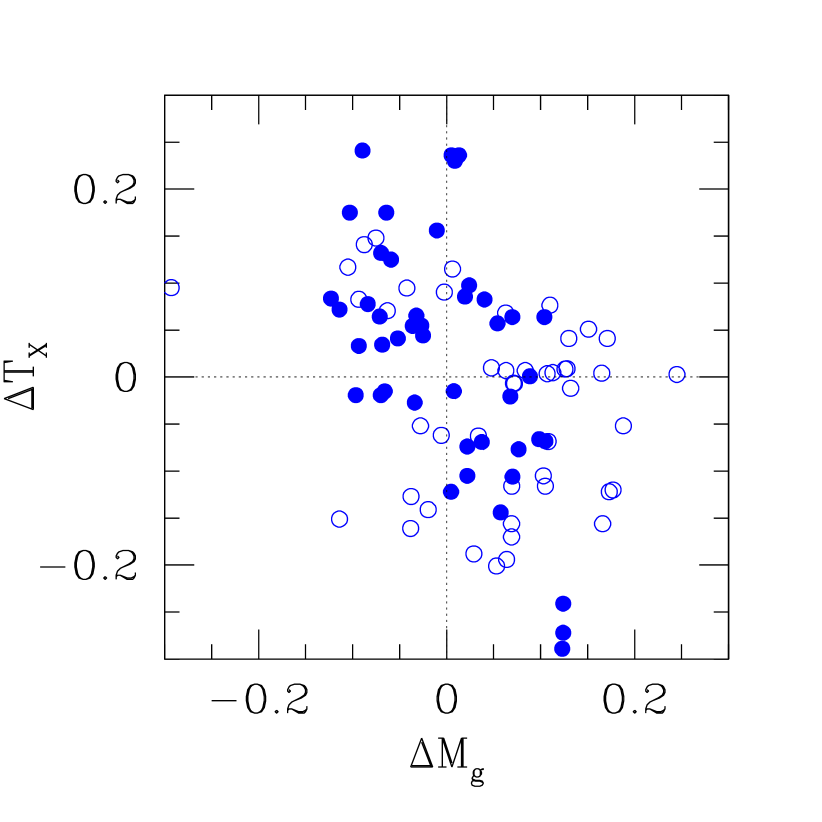
The comparison of the mass proxies, clearly shows that , the product of gas mass and X-ray spectral temperature, is more robust and self-similar mass indicator than either of these X-ray observables. Why is the product better than its parts? The answer is obvious from Figure 5 where we show the residuals of temperature and gas mass from their respective relations with total mass. Figure 5 shows that the clusters with temperatures lower than the mean temperature for a given total mass tend to have gas mass higher than the mean, and vice versa. Note also that there is some redshift evolution between and — more clusters have negative deviations of temperature and positive deviations of measured gas mass at compared to . This redshift evolution is thus in the opposite direction for the gas mass and temperature deviation. The measured systematically increases at higher for a fixed total mass because high- clusters are less relaxed on average. For unrelaxed clusters, the ICM density distribution is non-uniform which results in overestimation of from the X-ray data . Some of the decrease of at lower may be due to continuing cooling of the ICM which decreases the mass of hot, X-ray emitting gas. The anti-correlation of residuals and opposite evolution with redshift for gas mass and temperature is the reason why the behavior of their product, on average, has smaller scatter and is closer to the self-similar expectation in both the slope and evolution.
5 Discussion and Conclusions
We presented comparison of several X-ray proxies for the cluster mass — the spectral temperature and gas mass derived from the X-ray data within , and the new proxy, , defined as a simple product of and . Analogously to the integrated Sunyaev-Zel’dovich flux, is related to the total thermal energy of the ICM. To test these mass proxies, we use mock Chandra “observations” of a sample of clusters simulated in the concordance CDM cosmology.
The main result of this study is that is a robust mass indicator with remarkably low scatter of only in for fixed , regardless of whether the clusters are relaxed or not. In addition, the redshift evolution of the relation is close to the self-similar prediction given by equation 1, which makes this indicator a very attractive observable for studies of cluster mass function with the X-ray selected samples.
The relation has the largest scatter (), most of which is due to unrelaxed clusters. The unrelaxed clusters have temperatures biased low for a given mass because a certain fraction of the kinetic energy of merging systems is still in the form of bulk motions of the ICM. The relation shows an intermediate level of scatter, . This relation does not appear to be sensitive to mergers. It does, however, exhibit significant deviations from self-similarity in its slope, which is due to the dependence of gas fraction within on the cluster mass (a similar dependence exists for the observed clusters ).
Generally, all the observable–mass relations we tested demonstrate a remarkable degree of regularity of galaxy clusters as a population. , , and all exhibit correlations with which are close to the expectation of the self-similar model, both in their slope and evolution with time, within the uncertainties provided by our sample. The only exception is the slope of the relation.
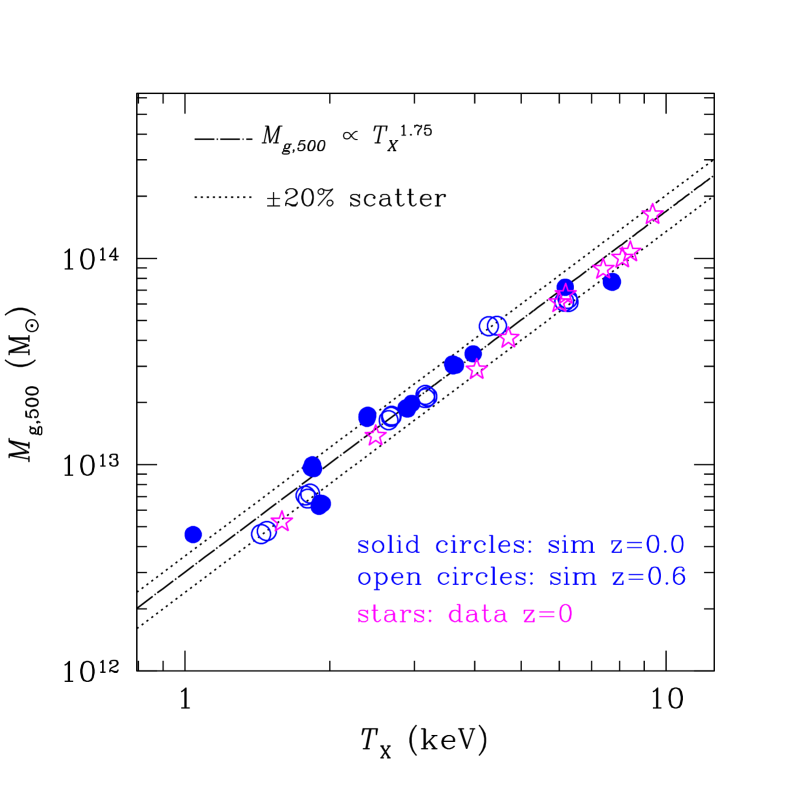
Given that our analysis relies on cosmological simulations, it is reasonable to ask whether the simulated clusters are realistic. Although simulations certainly do not reproduce all of the observed properties of clusters, especially in their core regions, the ICM properties outside the core in simulations and observations agree quite well. We illustrate this in Fig. 7, which shows that the relations for simulated and observed clusters . Clearly, both simulated and observed clusters exhibit tight correlations between and which agree remarkably in their slope () and normalization. The normalizations derived from simulated and real clusters agree to , while slopes are indistiguishable and both deviate significantly from the expected self-similar value of . This is a consequence of significant trends in the gas fraction with cluster mass, for both simulated and observed clusters . The deviations from the self-similar model also manifest themselves in the absence of any noticeable evolution with redshiftbbbNote that in Fig.7 is not multiplied by the factor unlike the total mass in Fig.3 and 5.. Interestingly, the real clusters show a similarly weak evolution in the relation . Figure 5 shows that the likely explanation is that the clusters at tend to be colder for the fixed but have higher estimated then their counterparts at because they are less relaxed.
A similar level of agreement between the simulations and latest Chandra measurements exists also for the total mass vs. temperature relation, . In fact, the normalization for our simulated sample agrees with the observational results to . This is a considerable improvement over the situation of just several years ago when there was discrepancy between observational measurements and cosmological simulations . The normalization was revised both in simulations and observations due to (1) inclusion of more realistic physics in cosmological simulations (e.g., radiative cooling and star formation, , (2) improved analyses of observed clusters using more realistic gas density profiles , (3) more reliable measurements of the cluster temperature profiles , and (4) the use of uniform definition of in observations and in simulations analyses . The remaining systematic difference observed at present is likely caused by non-thermal pressure support from bulk gas motions , which is unaccounted for by the X-ray hydrostatic mass estimates. In Figure 7 we compare the relation for the simulated clusters and for the Chandra sample. The observed clusters show a tight correlation with the slope close to the self-similar value. There is difference in normalization, likely explained also by neglecting the turbulent pressure support in the Chandra hydrostatic mass estimates. The excellent agreement of simulations and observations in terms of the relation between the two X-ray observables used to compute () and a relatively good agreement in the and relations, gives us confidence that the results presented here are sufficiently realistic.
Our results show that is clearly most robust and most self-similar X-ray cluster mass indicator. The biases existing in mass estimates based on and anti-correlate both for a given redshift and in terms of evolutionary trends (see Figure 5). This explains why their product, , is a better mass indicator than and individually. The quality of compares well to that for the actual three-dimension integral of the ICM thermal energy (proportional to ) in terms of its low scatter and self-similarity. may prove to be an even better mass proxy than , given that we use ideal 3D measurement of the latter while reproducing the actual data analysis for the former. Note also that is more sensitive to the outskirts of clusters, because it involves gas mass-weighted temperature (as opposed to the spectral temperature more sensitive to the inner regions), and thus should be more prone to projection effects.
Note that is also an attractive mass proxy from the data analysis point of view. First, it reduces observational statistical noise by combining the two independently measured quantities, and , into a single quantity. For example, a measurement uncertainty in translates into a mass uncertainty through the relation and only uncertainty through the relation. is also less sensitive to any errors in the absolute calibration of the X-ray telescope because the biases in the derived and tend to anticorrelate.
The robustness and low scatter make an excellent mass indicator for observational measurements of cluster mass function at both and higher redshifts. The necessary data — an X-ray brightness profile and a wide-beam spectrum excluding the core — are easily obtained with sufficiently deep observations with Chandra, XMM-Newton, and Suzaku (for low-redshift clusters). The small scatter and simple, nearly self-similar evolution of the relation hold promise for the self-calibration strategies for future large X-ray cluster surveys.
This project was supported by the NSF under grants No. AST-0206216 and AST-0239759, and by NASA through grants NAG5-13274 & NAG5-9217 and contract NAS8-39073. D.N. is supported by a Sherman Fairchild postdoctoral fellowship at Caltech. Last but not least, we would like to thank the organizers of the XLIst Rencontres du Moriond.
References
- [1] A. V. Kravtsov, A. Vikhlinin, and D. Nagai. ApJ, in press (astro-ph/0603205).
- [2] G. M. Voit. Reviews of Modern Physics, 77:207, 2005.
- [3] L. David, A. Slyz, C. Jones, W. Forman, S.. Vrtilek, and K. Arnaud. ApJ, 412:479, 1993.
- [4] R. Stanek, A. E. Evrard, H. Böhringer, P. Schuecker, and B. Nord. ApJ submitted (astro-ph/0602324), 2006.
- [5] S. W. Allen, R. W. Schmidt, A. C. Fabian, and H. Ebeling. MNRAS, 342:287, 2003.
- [6] J. P. Henry and K. A. Arnaud. ApJ, 372:410, 1991.
- [7] J. Oukbir and A. Blanchard. A&A, 262:L21, 1992.
- [8] M. Markevitch. ApJ, 504:27, 1998.
- [9] Y. Ikebe, T. Reiprich, H. Böhringer, Y. Tanaka, and T. Kitayama. A&A, 383:773, 2002.
- [10] A. Vikhlinin, A.V. Kravtsov, W. Forman, C. Jones, M. Markevitch, S.S. Murray, and L. Van Speybroeck. ApJ, 640:691, 2006.
- [11] T. B. O’Hara, J. J. Mohr, J. J. Bialek, and A. E. Evrard. ApJ, 639:64, 2006.
- [12] A. Vikhlinin et al. ApJ, 590:15, 2003.
- [13] A. Voevodkin and A. Vikhlinin. ApJ, 601:610, 2004.
- [14] E. S. Levine, A. E. Schulz, and M. White. ApJ, 577:569, 2002.
- [15] W. Hu. Phys. Rev. D, 67(8):081304, 2003.
- [16] S. Majumdar and J. J. Mohr. ApJ, 585:603, 2003.
- [17] M. Lima and W. Hu. Phys. Rev. D, 72(4):043006, 2005.
- [18] S. Wang, J. Khoury, Z. Haiman, and M. May. Phys. Rev. D, 70(12):123008, 2004.
- [19] P. M. Motl, E. J. Hallman, J. O. Burns, and M. L. Norman. ApJ, 623:L63, 2005.
- [20] D. Nagai. ApJ submitted (astro-ph/0512208), 2006.
- [21] A. C. da Silva, S. T. Kay, A. R. Liddle, and P. A. Thomas. MNRAS, 348:1401, 2004.
- [22] N. Kaiser. MNRAS, 222:323, 1986.
- [23] E. J. Hallman, P. M. Motl, J. O. Burns, and M. L. Norman. ApJ submitted (astro-ph/0509460), 2006.
- [24] A. V. Kravtsov, A. Klypin, and Y. Hoffman. ApJ, 571:563, 2002.
- [25] B. F. Mathiesen and A. E. Evrard. ApJ, 546:100, 2001.
- [26] A. V. Kravtsov, D. Nagai, and A. A. Vikhlinin. ApJ, 625:588, 2005.
- [27] B. Mathiesen, A. E. Evrard, and J. J. Mohr. ApJ, 520:L21, 1999.
- [28] A. Vikhlinin, L. VanSpeybroeck, M. Markevitch, W. R. Forman, and L. Grego. ApJ, 578:L107, 2002.
- [29] A. Finoguenov, T. H. Reiprich, and H. Böhringer. A&A, 368:749, 2001.
- [30] E. Pierpaoli, S. Borgani, D. Scott, and M. White. MNRAS, 342:163, 2003.
- [31] R. Davé, N. Katz, and D. H. Weinberg. ApJ, 579:23, 2002.
- [32] O. Muanwong, P. A. Thomas, S. T. Kay, and F. R. Pearce. MNRAS, 336:527, 2002.
- [33] S. Borgani et al. MNRAS, 348:1078–1096, 2004.
- [34] M. Markevitch, W. R. Forman, C. L. Sarazin, and A. Vikhlinin. ApJ, 503:77, 1998.
- [35] M. Arnaud, E. Pointecouteau, and G. W. Pratt. A&A, 441:893, 2005.
- [36] P. Mazzotta, E. Rasia, L. Moscardini, and G. Tormen. MNRAS, 354:10, 2004.
- [37] E. Rasia, P. Mazzotta, S. Borgani, L. Moscardini, K. Dolag, G. Tormen, A. Diaferio, and G. Murante. ApJ, 618:L1, 2005.
- [38] A. Vikhlinin. ApJ, 640:710, 2006.
- [39] A. Faltenbacher, A. V. Kravtsov, D. Nagai, and S. Gottlöber. MNRAS, 358:139, 2005.
- [40] E. Rasia et al. astro-ph/0602434, 2006.
- [41] E. Lau, A. V. Kravtsov, and D. Nagai. ApJ in preparation, 2006.