11email: [gbihain,rrl,zvezda,jap,amt]@ll.iac.es,victor.bejar@gtc.iac.es 22institutetext: Consejo Superior de Investigaciones Científicas, Spain 33institutetext: GTC Project, Instituto de Astrofísica de Canarias 44institutetext: Max-Planck-Institut für Astronomie, Königstuhl 17, 69117 Heidelberg, Germany
44email: [calj,mundt]@mpia-hd.mpg.de
Pleiades low-mass brown dwarfs: the cluster L dwarf sequence
Abstract
Aims. We present a search for low-mass brown dwarfs in the Pleiades open cluster. The identification of Pleiades members fainter and cooler than those currently known allows us to constrain evolutionary models for L dwarfs and to extend the study of the cluster mass function to lower masses.
Methods. We conducted a 1.8 deg near-infrared -band survey at the 3.5 m Calar Alto Telescope, with completeness 19.0. The detected sources were correlated with those of previously available optical -band images ( 22). Using a versus colour–magnitude diagram, we identified 18 faint red L-type candidates, with magnitudes 19.7 and colours 3.2. If Pleiades members, their masses would span 0.040–0.020 . We performed follow-up -band imaging to further confirm their cluster membership by photometry and proper motion.
Results. Out of 11 candidates with proper motion measurements, we find six cluster members, two non-members and three whose membership is uncertain and depends on the intrinsic velocity dispersion of Pleiades brown dwarfs. This dispersion (4 mas yr) is at least four times that of cluster stars with masses 1 . Five of the seven other candidates are discarded because their colours are bluer than those of confirmed members. Our least massive proper motion members are BRB~28 and 29 (25 ). The versus sequence of the L-type candidates at is not as red as theoretical models predict; it rather follows the field L-dwarf sequence translated to the cluster distance. This sequence overlapping, also observed in the versus and diagrams, suggests that Pleiades and field L dwarfs may have similar spectral energy distributions and luminosities, and thus possibly similar radii. Also, we find for a power-law approximation of the survey mass spectrum in the mass range 0.5–0.026 . This value is similar to that of much younger clusters, indicating no significant differential evaporation of low-mass Pleiades members relative to more massive ones.
Key Words.:
stars: brown dwarfs – stars: mass function – open cluster and associations: individual: Pleiades1 Introduction
As a result of progressive cooling, brown dwarfs are expected to evolve from late M spectral type at very early stages (age 10 Myr) to L-type ( in the range 2 400 to 1 400 K; dahn2002), and at sufficiently old ages (a few Gyr), to T-type and beyond ( 1 400 K). The mass-spectral type and mass-luminosity relationships at different ages remain to be derived from observations of cool dwarfs, which also permit the calibration of the theory of substellar evolution (e.g. chabrier2000a). In comparison to the spectra of M dwarfs, L dwarfs are characterized in the optical by the weakening of the metal-oxide TiO and VO bands due to the condensation of the metals Ti and V in dust grains that may significantly affect the atmospheric structure and the emergent spectrum (e.g. the DUSTY models from chabrier2000b). Bands of metal-hydrides CrH, FeH and CaH and bands of water become more intense especially in the near-infrared (IR), whereas the neutral alkali metals Na, K, Rb, Cs and Li become stronger in the optical (chabrier2000a; basri2000). The emergence in the near-IR of CH bands characterizes the beginning of the T dwarf sequence. Field L dwarfs have and colours redder than 3.3 and 1.3 mag, respectively, increasing from early to later spectral subclasses (martin1999). For the L4–L8 spectral subclasses the near-IR and colours appear to saturate at 1.2 and 2.0 mag (kirkpatrick2000; burgasser2002), respectively, whereas for T dwarfs these colours become bluer, with values decreasing to below zero (knapp2004). From L0 to T8 spectral types the colour is increasing to 5.8 mag (dahn2002). Associated with the other colours it can give a rough indication of the spectral type.
The Pleiades open cluster (120 Myr, 130 pc) served for decades as a reference stellar laboratory where models were contrasted with observations. Since the discovery of Pleiades brown dwarfs (rebolo1995; rebolo1996), subsequent studies have provided numerous fainter substellar candidates with spectral types down to late M (zapateroosorio1997a; zapateroosorio1997b; bouvier1998, hereafterB98; festin1998a; zapateroosorio1999Pl), from which a fraction is confirmed by lithium detection (stauffer1998a; martin2000) or by proper motion (moraux2001, hereafter M01). Very large area proper motion surveys (hambly1999; deacon2004) have obtained on the other hand a significant census of the stellar-substellar boundary population of the cluster. The coolest object for which a spectral type has been obtained is the L0 brown dwarf candidate Roque~25 (martin1998b), with an estimated theoretical mass of 0.035 M. A dozen fainter objects than Roque~25 have been identified in deep surveys (festin1998a; bejar2000; dobbie2002; nagashima2003; moraux2003; schwartz2005), and some were confirmed by proper motion (bouy2006).
The mass spectrum of the Pleiades cluster, where stands for the number of objects in the mass range , is best fitted by a lognormal function (moraux2003; deacon2004), and its approximation by a power law in the low mass range 0.6–0.03 provides a spectral index 0.6–0.8 (dobbie2002; moraux2003). Similar values are found in other much younger open clusters, as for example $σ$ Orionis (2–4 Myr), where for (bejar2001), and IC~348 (3 Myr), where for (tej2002). It is important to determine the behaviour of the index in the lower mass domain because it can help to discriminate among brown dwarf formation mechanisms. For instance, for the formation of gravitationally unstable cores by turbulent fragmentation (padoan2004), the mass spectrum is predicted to be log-normal, with a peak that appears at smaller masses when the sonic Mach number and the mean density of the cores are greater.
In this paper we present a 1.8 deg deep -band survey of the Pleiades open cluster aimed to find lower-mass brown dwarfs (0.035 ), by comparison with a new analysis of -band data obtained by bouvier1998. Our goal is to identify L dwarf cluster candidates and study the location of the L dwarf sequence in the colour–magnitude diagram. Preliminary results have been reported in bihain2005. Because the cluster has a well known age, the properties of Pleiades L-type brown dwarfs could provide useful constraints to models predicting the evolution of substellar objects. Additionally, we can estimate the cluster mass spectrum of the surveyed area at lower masses.
2 Observations and data reduction
2.1 -band survey
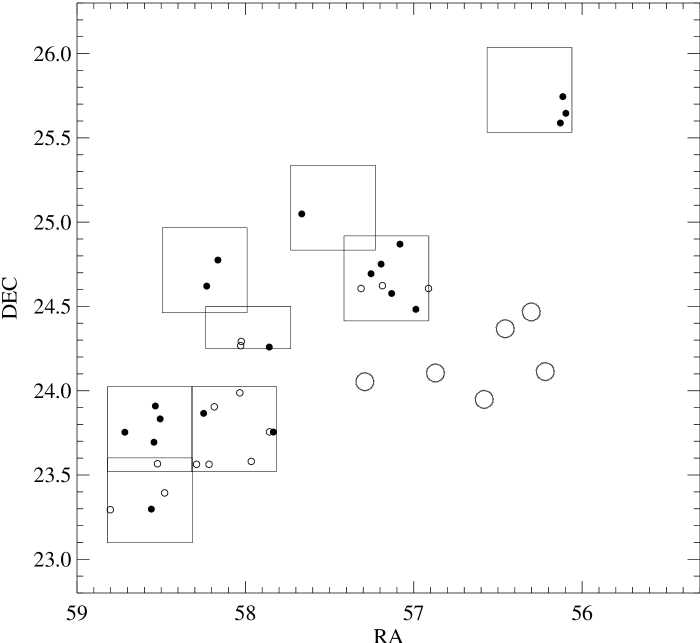
We obtained -band images on 1998 October 27–28 with the Omega-Prime () instrument at the 3.5 m Telescope of the Centro Astronómico Hispano Alemán (CAHA; Calar Alto, Spain). The fields were specifically chosen to cover the optical -band survey from bouvier1998 obtained with the 3.6 m Canada-France-Hawaii Telescope (CFHT)/UH8K survey. We observed the fields CFHT 2, 5 (north half), 6, 7, 8, 10, 11 and 13 (see their spatial distribution in Fig. 1). They correspond to an area of the cluster of 1.8 square degrees. The camera has a 10241024 HgCdTe Hawaii detector with a pixel scale of 0.40 and a field of view of . To cover each of the UH8K fields (hereafter CFHT fields, as designed in bouvier1998) a connecting observation macro was used. The exposure times and repetitions in each pointing were , except for CFHT7 and CFHT8 (), and CFHT6 (). Because the offset between successive macro pointings corresponded to one third of an field of view, each area was repeated in total 6–9 times (96–144 s), depending of the CFHT field. The individual images were sky-subtracted, flat-fielded using dome flats, combined and aligned in horizontal strips of , using standard scripts and routines within the IRAF111IRAF is distributed by the National Optical Astronomy Observatories, which are operated by the Association of Universities for Research in Astronomy, Inc., under cooperative agreement with the National Science Foundation. environment. These were later analyzed for aperture and PSF photometry using DAOPHOT. The PSF photometry was calibrated with measurements from the Two Micron All Sky Survey (2MASS) Point Source Catalog (cutri2003) and which had errors of less than 0.1 mag. On average, about five 2MASS calibrators were used per horizontal strip. The -band completeness (limiting) magnitude was estimated at the maximum (fainter half maximum) of the histogram of object counts per magnitude. We found values of 19.0 and 19.5 mag, respectively.
The optical survey in the bands from bouvier1998 was obtained with the UH8K instrument at the CFHT (Mauna Kea, Hawai’i) on 1996 December 9–13. The UH8K camera comprises eight Loral 20484096 CCD detectors with a pixel scale of 0.21. These data were used initially for a study of brown dwarfs and low-mass stars by bouvier1998. In the present paper we use an independent data analysis by bejar2000. The photometric calibration of the CFHT fields was performed by comparing our photometry to the Cousins photometry of their candidates and applying an average offset; for the fields CFHT6 and CFHT8 however, different offsets were applied because they were observed through thin cirrus. The completeness and limiting magnitudes were 23.5 and 25.0 mag in the band, and 22.5 and 23.5 mag in the band, respectively.
| Name | Names reported | RA (J2000) Dec. (J2000) | ||||
|---|---|---|---|---|---|---|
| () () | ||||||
| BRB 1 | CFHT-Pl-1, BPL 242, MBSC 91, (*) | 1.76 0.13 | 16.10 0.07 | 14.41 0.03 | 1.69 | 03 51 51.6 +23 34 50.2 |
| BRB 2 | CFHT-Pl-2, BPL 267, DH 765, (*) | 2.00 0.10 | 16.57 0.07 | 14.66 0.06 | 1.91 | 03 52 44.3 +23 54 15.2 |
| BRB 3 | CFHT-Pl-6, (*) | 2.38 0.10 | 17.13 0.07 | 14.71 0.05 | 2.41 | 03 52 07.9 +23 59 14.6 |
| BRB 4 | (*) | 2.38 0.10 | 17.03 0.07 | 14.73 0.04 | 2.30 | 03 44 23.2 +25 38 44.7 |
| BRB 5 | CFHT-Pl-3, HHJ 22, BPL 272, MBSC 99, (*) | 1.94 0.10 | 16.66 0.07 | 14.81 0.06 | 1.85 | 03 52 51.8 +23 33 48.9 |
| BRB 6 | CFHT-Pl-4, BPL 280, MBSC 101, (*) | 1.92 0.10 | 16.85 0.07 | 14.96 0.06 | 1.89 | 03 53 09.6 +23 33 48.3 |
| BRB 7 | CFHT-Pl-5, DH 590, (*) | 2.11 0.10 | 16.99 0.07 | 14.98 0.06 | 2.01 | 03 48 44.7 +24 37 22.7 |
| BRB 8 | CFHT-Pl-7, BPL 253, MBSC 108, (*) | 1.84 0.13 | 17.48 0.07 | 15.16 0.07 | 2.32 | 03 52 05.8 +24 17 31.7 |
| BRB 9 | CFHT-Pl-12, BPL 294, CFHT-PLIZ-6, (*) | 2.55 0.10 | 18.00 0.07 | 15.20 0.03 | 2.80 | 03 53 55.1 +23 23 37.4 |
| BRB 10 | CFHT-Pl-9, BPL 202, MHOBD 6, (*) | 2.17 0.10 | 17.78 0.07 | 15.46 0.07 | 2.32 | 03 49 15.1 +24 36 22.4 |
| BRB 11 | CFHT-Pl-13, Teide 2, BPL 254, CFHT-PLIZ-3, (*) | 2.11 0.13 | 18.14 0.07 | 15.50 0.07 | 2.64 | 03 52 06.7 +24 16 01.4 |
| BRB 12 | CFHT-Pl-11, Roque 16, BPL 152, (*) | 2.25 0.10 | 17.92 0.07 | 15.64 0.07 | 2.28 | 03 47 39.0 +24 36 22.1 |
| BRB 13 | CFHT-Pl-15, (*) | 2.44 0.10 | 18.65 0.07 | 15.99 0.07 | 2.66 | 03 55 12.5 +23 17 38.0 |
| BRB 14 | CFHT-Pl-21, Calar 3, BPL 235, CFHT-PLIZ-12, (*) | 2.49 0.11 | 18.93 0.07 | 16.13 0.05 | 2.80 | 03 51 25.6 +23 45 20.6 |
| BRB 15 | CFHT-Pl-25, BPL 303, CFHT-PLIZ-20, (*) | 2.70 0.13 | 19.68 0.07 | 16.71 0.04 | 2.98 | 03 54 05.3 +23 34 00.2 |
| BRB 16 | PIZ 1 | – | 20.10 0.12 | 16.84 0.07 | 3.26 | 03 48 31.4 +24 34 37.7 |
| BRB 17 | (**) | – | 20.92 0.07 | 17.42 0.06 | 3.50 | 03 54 08.31 +23 54 33.4 |
| BRB 18 | CFHT-PLIZ-28, (**) | 2.37 0.17 | 21.20 0.07 | 17.61 0.07 | 3.59 | 03 54 14.08 +23 17 52.2 |
| BRB 19 | – | 2.25 0.14 | 20.95 0.09 | 17.79 0.05 | 3.16 | 03 54 51.49 +23 45 12.2 |
| BRB 20 | CFHT-PLIZ-35, (*), (**) | 2.55 0.23 | 21.47 0.06 | 18.06 0.07 | 3.40 | 03 52 39.16 +24 46 29.7 |
| BRB 21 | (**) | 2.34 0.21 | 21.68 0.08 | 18.14 0.05 | 3.54 | 03 54 10.27 +23 41 40.3 |
| BRB 22 | CFHT-PLIZ 2141 | 2.14 0.20 | 21.97 0.08 | 18.31 0.05 | 3.65 | 03 44 31.27 +25 35 15.1 |
| BRB 23 | (**) | 2.13 0.27 | 22.03 0.10 | 18.55 0.10 | 3.49 | 03 50 39.53 +25 02 54.5 |
| BRB 24 | (*) | 2.95 0.51 | 22.01 0.09 | 18.71 0.08 | 3.30 | 03 48 19.65 +24 52 09.5 |
| BRB 25 | – | – | 22.24 0.09 | 18.74 0.07 | 3.50 | 03 52 59.73 +23 51 56.0 |
| BRB 26 | – | 1.93 0.30 | 22.07 0.08 | 18.76 0.10 | 3.31 | 03 48 56.17 +25 09 43.1 |
| BRB 27 | CFHT-PLIZ 1262, (**) | 2.30 0.32 | 22.64 0.11 | 18.89 0.09 | 3.74 | 03 44 27.24 +25 44 41.9 |
| BRB 28 | (*), (**) | 2.64 0.45 | 22.36 0.08 | 19.02 0.10 | 3.33 | 03 52 54.92 +24 37 18.6 |
| BRB 29 | – | – | 22.84 0.10 | 19.05 0.07 | 3.79 | 03 54 01.43 +23 49 58.1 |
| BRB 30 | – | 1.98 0.23 | 22.48 0.10 | 19.17 0.07 | 3.31 | 03 47 56.96 +24 28 58.4 |
| BRB 31 | – | 2.50 0.25 | 23.05 0.10 | 19.29 0.10 | 3.76 | 03 51 25.93 +24 15 32.2 |
| BRB 32 | – | – | 22.72 0.12 | 19.36 0.09 | 3.36 | 03 49 00.86 +24 41 38.5 |
| BRB 33 | – | – | 23.31 0.20 | 19.63 0.09 | 3.68 | 03 51 20.15 +23 45 18.4 |
| BRB 34 | – | – | 23.01 0.16 | 19.64 0.09 | 3.37 | 03 48 46.55 +24 45 03.2 |
With follow-up observation for proper motion measurement (see Table 2).
(*) (bejar2000), CFHT-Pl (bouvier1998), BPL (pinfield2000), MBSC and CFHT-PLIZ (moraux2003), (**) (bihain2005), DH (deacon2004), CFHT-PLIZ (bouy2006), HHJ 22 (hambly1993), MHOBD~6 (stauffer1998b), Teide~2 (martin1998a), Roque~16 (zapateroosorio1997b), Calar~3 (martin1996), PIZ~1 (cossburn1997). In Fig. 1 we overplotted the 14 CFHT-Pl objects (open circles) and the 20 other objects (filled circles).
Coordinates of CFHT-Pl, CFHT-PLIZ, PIZ~1 and the other objects are from bouvier1998, moraux2003, cossburn1997 and the present study, respectively.
-band estimate from martin2000 because our estimate is bad pixel-contaminated.
-band estimate corrected for a mag reddening due to a close star and ray light traces; the offset was obtained by comparing to objects of similar counts in clean sky areas of the image. Converting the Kitt Peak filter measurement from cossburn1997 to Cousins with the transform equation given by jameson2002, we find .
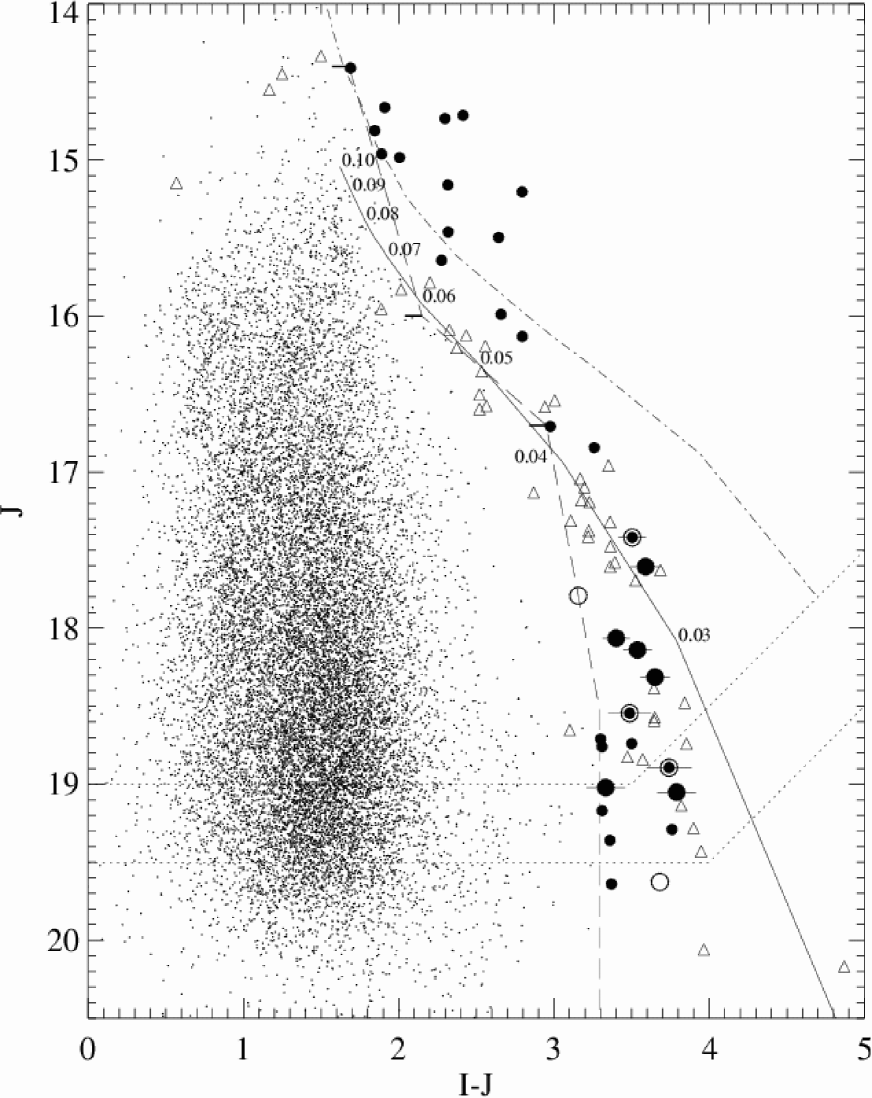
To identify fainter and redder objects than those found by bouvier1998 and bejar2000, we used as reference the detected -band sources and searched for their optical counterparts in the -band images using a FORTRAN correlation program, CORREL, kindly provided by M. R. Zapatero Osorio. The correlated objects were plotted in a versus diagram (see Fig. 2) and contrasted with the 120 Myr DUSTY isochrone from chabrier2000b, shifted to the cluster distance of 133.83.0 pc (percival2005). As most of our faint objects were bluer than the theoretical isochrone in the versus diagram, we decided to establish our selection of candidates based on an empirical criterion. We considered a bluer envelope to cluster candidates (dashed line in Fig. 2), defined by the bluest lithium or proper motion Pleiades objects reported (martin2000; moraux2001): CFHT-Pl-1, Calar~1 and CFHT-Pl-25 (horizontal thick marks in Fig. 2). The envelope was extended to faint magnitudes at a fixed colour of 3.3, to avoid most of the M8–9 dwarf contaminants which have bluer colours. As potential cluster members we have selected 34 objects (named “BRB”) with and colours 3.8 (Table 1). We checked that these objects had colours . Some fainter candidates had unreliable or too faint -band magnitudes and no value is given in Table 1. We discarded as contaminants the previously identified non-proper motion candidates CFHT-Pl-8 (moraux2001) and CFHT-PLIZ-25 (moraux2003).
Of the 34 BRB candidates, 22 were identified already by previous surveys (e.g. bejar2000, bouvier1998; see footnote of Table 1 for all the references). In the magnitude range of the brightest objects we identify an additional candidate, BRB~4, which is also in the 2MASS catalog. This object is not mentioned by bouvier1998 and is not in the list of proper motion and -band photometric candidates from deacon2004. The latter survey overlaps the CFHT survey and its -band limiting magnitude is greater than the magnitude of BRB~4, . Therefore this object should have been detected. Possibly it was blended or it is not a proper motion cluster member.
The magnitude errors of the BRB candidates are 0.06 mag for and 0.08 mag for . Comparing our -band magnitudes with those available in the literature (martin2000; pinfield2003), i.e. those in the range , we find:
-
1.
= , for the objects in common CFHT-Pl-2, 3, 4, 5, 6, 7, 9, 11, 12, 15, 21 and 25. CFHT-Pl-6 and CFHT-Pl-7 present the greatest differences, 0.18 and 0.26 mag, respectively. Both objects lack of H emission (martin2000), but CFHT-Pl-7 has a proper motion consistent with that of the cluster. In one of our individual -band images, the radial profile of CFHT-Pl-7 peaks at relatively higher counts and is not well centred, probably due to a cosmic ray; this might explain the greater brightness (it is also supported by the difference with 2MASS, = ). For CFHT-Pl-6, as discussed by moraux2001, if this is an equal mass binary as suggested by its position well above the cluster sequence in the colour–magnitude diagram (bouvier1998; see also Fig. 2), the binarity might affect the determination of its short term proper motion and therefore explain its deviance from the cluster peculiar motion. The binarity could also explain some of the magnitude difference observed.
-
2.
= , for CFHT-Pl-2, 3, 4, 7, 9, 11, 12, 13, 21 and 25. CFHT-Pl-4 and CFHT-Pl-11 present the greatest differences, 0.19 mag and 0.15 mag, respectively. These are also found for 2MASS: = 0.11 and 0.19, respectively. But CFHT-Pl-4 and CFHT-Pl-11 have no deviant proper motions or anomalous positions in the colour–magnitude diagram.
Our -band magnitudes rely on an approximate offset to the magnitudes from bouvier1998 and have an error of 0.1 mag. The -band magnitude from bouvier1998 is obtained after transformation onto the standard Cousins system, with observation of red Landolt standards. Due to the lack of very red standard stars, the transformation is linearly extrapolated for the red and faint objects and could produce systematic errors. Comparing our magnitudes to those in the Cousins system from moraux2003, for the candidates in common and 1–2 mag fainter than CFHT-Pl-25 (one of the faintest objects from bouvier1998), we observe a difference , which is quite small in comparison with the threshold that we applied to select the faint candidates.
Finally, from the 34 BRB Pleiades candidates, the 18 faintest have and , the magnitudes and colours expected for L-type dwarfs.
2.2 Follow-up observations
2.2.1 -band imaging
Follow-up -band imaging with CAIN-II at the 1.55 m Telescopio Carlos Sánchez (TCS; Teide Observatory, Tenerife) was performed for all 18 -band photometric substellar candidates (see the observation log in Table 2). The CAIN-II camera has a 256256 HgCdTe Nicmos3 detector with a pixel scale of 1.00 in wide field configuration, providing a field of view. The observation macro consisted in 6 s exposures 10 repetitions 10 dither positions. Total exposure times spanned a range of 10–90 min, depending on the expected brightness of the candidates and the seeing. Data were sky-subtracted, flat-fielded (using sky flats instead of dome flats), aligned and combined in a similar way as for the -band data (Sect. 2.1). We also performed the photometry and estimated the completeness and limiting magnitudes as described for the -band. On average, about six 2MASS calibrators were used per field. Average completeness and limiting magnitudes during the different nights are indicated in Table 2.
| Telescope/instrument | Filter(s) | Date | Object(s) | , |
|---|---|---|---|---|
| TCS/ | 2004 Dec 7 | BRB 17, 18, 21, 23, 26 | 17.6, 18.2 | |
| TCS/ | 2004 Dec 8 | BRB 20, 28 | 18.1, 18.6 | |
| WHT/ | 2005 Jan 23 | BRB 17, 23 | 19.5, 20.0 | |
| WHT/ | 2005 Jan 24 | BRB 20, 28 | 19.0, 19.5 | |
| 3.5 m Calar/ | 2005 Feb 1 | BRB 17, 18, 21, Teide 1 | 18.5, 19.3 | |
| TCS/ | 2005 Mar 6 | BRB 25 | 16.5, 17.0 | |
| WHT/ | 2005 Mar 25 | BRB 27, Teide 1 | 18.8, 19.3 | |
| TCS/ | 2005 Oct 17 | BRB 19 | 17.5, 18.5 | |
| TCS/ | 2005 Oct 18 | BRB 22 | 18.0, 19.0 | |
| 3.5 m Calar/ | 2005 Oct 21 | BRB 19 | 19.0, 19.5 | |
| TCS/ | 2005 Oct 21 | BRB 24, 34 | 17.8, 18.8 | |
| 3.5 m Calar/ | 2005 Oct 22 | BRB 22 | 19.0, 19.5 | |
| TCS/ | 2005 Oct 22 | BRB 29 | 18.0, 19.0 | |
| 3.5 m Calar/ | 2005 Oct 23 | BRB 29 | 18.5, 19.0 | |
| TCS/ | 2005 Oct 23 | BRB 31, 33 | 18.8, 19.5 | |
| 3.5 m Calar/ | 2005 Oct 24 | BRB 33 | 19.0, 19.5 | |
| 3.5 m Calar/ | 2005 Oct 25 | BRB 33 | 19.0, 19.5 | |
| TCS/ | 2005 Oct 28 | BRB 30, 32 | 18.0, 19.0 |
Average completeness and limiting magnitudes.
2.2.2 -band imaging for astrometry
For the proper motion determination of the candidates, we obtained subarcsecond - and -band images with the Long-slit Intermediate Resolution Infrared Spectrograph (LIRIS) at the 4.2 m William Hershel Telescope (WHT; Roque de los Muchachos Observatory, La Palma) and -band images with at the 3.5 m Telescope of CAHA (see Table 2).
We decided also to observe the Pleiades brown dwarf Teide~1 (rebolo1995) with both LIRIS and to improve its proper motion measurement and to check if there are any systematic errors in the proper motion measurements using different instruments. Our first epoch image was a reduced image, obtained with the TEK3 CCD detector (0.7) at the prime focus of the 2.5 m Isaac Newton Telescope (INT; Roque de los Muchachos Observatory, La Palma) on 1995 December 19 (Zapatero Osorio 2005, private communication).
The LIRIS camera has a 10241024 HgCdTe Hawaii detector with a pixel scale of 0.25 and a field of view, whereas the camera has a 20482048 HgCdTe Hawaii2 detector with a pixel scale of 0.45 and a field of view of . The observation macros consisted of: 5 s exposures 18 repetitions 5 dithers (LIRIS night 2005 January 23), 5 s exposures 12 repetitions 5 dithers (LIRIS; January 24), 3 s 20 coadds 7 dithers (; February 1), 20 s 6 repetitions 5 dithers (LIRIS; March 25), 2 s 20 coadds 15 dithers (; October 21, 22 and 23), 2 s 15 coadds 20 dithers (; October 24) and 3 s 15 coadds 20 dithers (; October 25). The total exposure times were chosen to achieve enough S/N (20 in the peak) for precise measurement of the position of the candidates. They ranged between 5 and 40 minutes, depending on the expected brightness of the candidates and the seeing.
The raw images were first bad-pixel corrected using a bad-pixel mask and the IRAF routine PROTO.FIXPIX. The mask was obtained from the flat (sky-flat for LIRIS and dome-flat for ) using NOAO.IMRED.CCDRED.CCDMASK. The images were then sky-subtracted – sky images were obtained by combining 5–20 consecutive images of similar sky counts – and divided by the flat.
The resulting images were distortion corrected, aligned using 10–20 reference stars and combined. For LIRIS these last three steps were performed with the LDEDITHER task within the package IRAF.LIRIS.LIMAGE developed by J. A. Acosta-Pulido. For , the images were distortion corrected by projecting them on the celestial coordinate grid with MSCIMAGE. The grid was obtained by astrometry with the USNO-A2 catalog and the script myasrtrom.cl from E. Puddu. This script invokes CCFIND, that correlates the catalog sources with those in the image, and CCMAP, which computes the plate solution. Usually, 50–100 stars were accepted by a Legendre order-4 transformation fit and a rejection threshold of 1.5 sigma, providing a projection transformation with standard deviation 0.12 in both right ascension and declination. The distortion corrected images of were then aligned and combined using the INTALIGN task within the LIRIS package.
The -band photometry was obtained similarly as for the -band data. On average, six and eleven 2MASS calibrators were used per LIRIS and field, respectively. The average completeness and limiting magnitudes during the different nights are indicated in Table 2.
2.3 Proper motion analysis
The proper motion measurements were obtained as follows. First we selected non-saturated and well defined ( ) single objects among all those that appeared within 3 of a brown dwarf candidate. We measured their centres in the first- and the second-epoch images with the IRAF task CENTER (DIGIPHOT.DAOPHOT package), with a precision of 0.01–0.1 pixels in both image dimensions. For BRB~22 and 33 we used the -band images as second-epoch images, because they provided greater for the candidates than the -band images. Then we computed the transformation from second-epoch image to first-epoch image with GEOMAP. For the image of Teide~1, we performed a transformation from first- to second-epoch (i.e. from TEK3 to ), because the destination image had a wider field and a smaller pixel scale and therefore provided more accurate equatorial astrometry with the USNO-A2 catalog. With GEOMAP we selected the objects whose positions minimized the transformation error and could thus be considered as reference objects. A Legendre function of order 3 was used when more than 12 objects were available, and of order 2 for fewer objects. The error, related to the scatter of these objects, ranged over 0.03–0.15 pixels. For the candidate BRB~23 the error in the dimension was as high as 0.6 pixels, because of vertical smearing affecting the object positions in the -band image (field CFHT 6). With GEOXYTRAN we used the transformation to predict the candidate position in a first-epoch image, and compared it with the measured one, , obtaining the pixel shifts . The plate solution of a first-epoch (or destination) image was obtained with the USNO-A2 catalog and the myasrtrom.cl script, in a similar way as explained above. Then using WCSCTRAN we converted the shifts in pixels to shifts in equatorial coordinates. Due to the precision of the equatorial astrometry (), its error contribution to the proper motion was negligible. But for the LIRIS proper motion measurement of Teide~1, the best first epoch TEK3 fit had a relatively high standard deviation () and the corresponding proper motion value differed by almost 1 mas yr with those derived from less precise fits; thus we added 1 mas yr to the proper motion error in this case. In general, we assumed that the proper motion error was :
| (1) |
where are the errors of the pixel positions in the first- (1) and second-epoch (2) images, the error of the transformation between these images, the transformation from to (RA, DEC) coordinates, and the time in Julian years between the two epochs of observation.
3 Proper motion Pleiades low-mass brown dwarfs
3.1 Photometry and proper motion results
The magnitudes for the red and faint brown dwarf candidates that we have followed-up are given in Table 3. The -band magnitude of BRB~17 is the error-weighted average from the values obtained with and LIRIS, and the -band magnitudes of BRB~22 and 33 are the error-weighted averages from the values obtained with and TCS. Our 18 follow-up objects have magnitudes 23.3, 19.6, and colours 3.8, and 2.2. Most of them remain good L dwarf candidates, what supports our selection criterion. But BRB~24, 26, 30, 31 and 34 present much bluer colours than cluster proper motion members with similar -band magnitude (see Fig. 5). Moreover, if they were late L or T dwarfs, they would certainly present much redder colours (4–5 mag). We will assume that these are non-cluster members. Finally BRB~32, with its red and relatively blue colours, remains a possible cluster member.
| Name | ||||||
|---|---|---|---|---|---|---|
| BRB 17 | 17.42 | 3.500.09 | 16.750.02 | 0.670.06 | 16.200.06 | 1.220.08 |
| BRB 18 | 17.61 | 3.590.10 | 16.740.06 | 0.870.09 | 16.080.07 | 1.530.09 |
| BRB 19 | 17.79 | 3.160.10 | 16.990.05 | 0.800.07 | 16.670.05 | 1.120.07 |
| BRB 20 | 18.06 | 3.400.09 | 17.330.05 | 0.730.08 | 16.560.07 | 1.500.10 |
| BRB 21 | 18.14 | 3.540.09 | 17.050.07 | 1.090.09 | 16.390.07 | 1.750.09 |
| BRB 22 | 18.31 | 3.650.09 | 17.380.04 | 0.940.06 | 16.690.04 | 1.620.06 |
| BRB 23 | 18.55 | 3.490.14 | 17.470.06 | 1.080.11 | 16.650.06 | 1.900.11 |
| BRB 24 | 18.71 | 3.300.12 | – | – | 17.490.07 | 1.220.11 |
| BRB 25 | 18.74 | 3.500.12 | – | – | 16.910.24 | 1.830.25 |
| BRB 26 | 18.76 | 3.310.13 | – | – | 17.810.10 | 0.950.14 |
| BRB 27 | 18.89 | 3.740.14 | – | – | 17.160.09 | 1.740.12 |
| BRB 28 | 19.02 | 3.330.12 | 17.890.05 | 1.130.11 | 17.000.08 | 2.020.13 |
| BRB 29 | 19.05 | 3.790.12 | 17.760.05 | 1.290.09 | 16.880.08 | 2.170.11 |
| BRB 30 | 19.17 | 3.310.12 | – | – | 17.650.09 | 1.520.11 |
| BRB 31 | 19.29 | 3.760.14 | – | – | 18.200.15 | 1.090.18 |
| BRB 32 | 19.36 | 3.360.15 | – | – | 17.420.20 | 1.940.22 |
| BRB 33 | 19.63 | 3.680.22 | 18.710.07 | 0.920.11 | 17.870.06 | 1.760.11 |
| BRB 34 | 19.64 | 3.370.18 | – | – | 18.80.5 | 0.90.5 |
With proper motion measurement.
| Name | Instrument | ||
|---|---|---|---|
| (mas yr) | (mas yr) | ||
| Teide 1 | LIRIS | 22.53.6 | 40.54.0 |
| Teide 1 | 19.22.5 | 45.53.4 | |
| Calar 3 | 24.52.2 | 32.62.2 | |
| BRB 17 | LIRIS | 20.91.5 | 22.82.4 |
| BRB 17 | 17.72.9 | 20.73.1 | |
| BRB 18 | 28.42.7 | 37.42.7 | |
| BRB 19 | 75.71.0 | 143.97.7 | |
| BRB 20 | LIRIS | 21.83.0 | 48.12.0 |
| BRB 21 | 18.13.4 | 49.14.1 | |
| BRB 22 | 18.83.5 | 51.92.9 | |
| BRB 23 | LIRIS | 29.23.0 | 25.614.7 |
| BRB 27 | LIRIS | 35.33.7 | 48.82.0 |
| BRB 28 | LIRIS | 15.13.1 | 37.42.1 |
| BRB 29 | 26.43.3 | 48.82.9 | |
| BRB 33 | 4.13.0 | 5.23.7 |

The proper motion results obtained for 11 of the brown dwarf candidates and two lithium brown dwarfs (Teide~1 and Calar~3) are listed in Table 4 and are represented by small circles in the vector point diagram of Figure 3. Because Calar~3 (martin1996; rebolo1996) is at a few arcminutes from BRB~33, we could also measure its proper motion and found a very good agreement with the measurement of moraux2001. We note that the double-check measurements of Teide~1 and BRB~17 are fully consistent within the statistic errors. In Fig. 3 are represented also: () the reference objects used to estimate the proper motions (asterisks), () the circle of radius three times the greatest component of the average proper motion error derived from Table 4 (( , ) = (3.0, 4.3) mas yr). This circle is centred on the cluster average proper motion, = (19.15 0.23, 45.72 0.18) mas yr (robichon1999), and we will assume that the objects within are cluster members.
The L dwarf candidates BRB 17, 23 and 27 lie outside the circle in Fig. 3 and their membership is considered uncertain. The proper motion dispersion of the seven objects within this circle is (5.2, 5.9) mas yr. Subtracted quadratically by the average proper motion error, it yields (4.3, 4.1) mas yr, as an estimate222At the cluster distance, it corresponds to a tangential velocity of 2.5 km s. of the intrinsic velocity dispersion of Pleiades brown dwarfs. This velocity dispersion is at least four times that of Pleiades stars with masses 1 (jones1970; pinfield1998) and appears consistent with the linear relationship of equipartition of energy, between the velocity dispersion and the inverse square root of the mass for cluster members, as expected in an nearly relaxed cluster (pinfield1998 and Fig. 4 therein).
We cannot rule out that some of the candidates located close to the region surrounding the circle in Fig. 3 are in fact cluster members (although field contaminants are neither excluded, see Sect. 4.1 and Table 5). This is actually the case of the Pleiades lithium brown dwarf Calar~3, suggesting that the intrinsic velocity dispersion of brown dwarfs could be even greater than our previous estimate. We need further data (for instance from lithium observations) to study the membership of the peculiar candidates. Note also the case of CFHT-Pl-15 (bouvier1998), which has a proper motion of (66.5 8.1, 54.1 8.1) mas yr (moraux2001), thus located far from the cluster point in the proper motion diagram, although it presents a radial velocity consistent with that of the cluster, Li absorption, H emission and a red colour (stauffer1998a; martin2000).
However, BRB~19 and BRB~33 appear clearly to be non-proper motion members; BRB~19 has an especially high proper motion. Finally, our error-weighted average estimate for Teide~1 is (20.3 2.1, 2.6) mas yr, very close to the cluster proper motion. It also agrees with the measurement obtained by rebolo1995, the only previous estimate (16 9, 16) mas yr, but with large conservative errors. These measurements, together with the clear lithium detection (rebolo1996), thus fully confirm Teide~1 as a Pleiades brown dwarf. Also, the photometry obtained with and LIRIS, = and = , respectively, agrees with that of jameson2002, = and = .
3.2 Pleiades L dwarf sequence
In the versus colour–magnitude diagram (Fig. 2), the six cluster proper motion members (large filled circles) define the Pleiades L dwarf sequence. Note that the three possible members with relatively high proper motion (circled filled circles) share the same sequence (as well as in the near-IR colour–magnitude diagrams, Figs. 4 and 5).


In Fig. 2 we also present theoretical predictions for the and bandpasses. The solid line corresponds to the DUSTY isochrone and the dash-dotted line corresponds to the NextGen isochrone from baraffe1998 for an age 125 Myr. Masses in solar units are shown for the first isochrone. The NextGen model provides a good fit for 16.0–16.5 and the DUSTY model provides a good fit for 18. Both models fail to reproduce the photometric sequence at fainter magnitudes; the former does not account for the onset of dust formation in cooler atmospheres, whereas the latter overestimates the colour.
Also in Fig. 2 we show the sequence of field dwarfs (triangles) with parallactic distances, translated to the distance of the Pleiades cluster. These nearby cool dwarfs are compiled from the literature by caballero2006. Their - and -band photometry are from dahn2002 (dahn2000, 2002) and the 2MASS Point Source Catalog, respectively. For the M dwarfs, the parallaxes are from dahn2002 (dahn2000, 2002) and the spectral types are from golimowski2004, leggett2000; leggett2002 and dahn2002. For the L and T dwarfs, the parallaxes are from perryman1997, dahn2002 and vrba2004, and the spectral types are mostly from vrba2004, else from leggett2002 and geballe2001. In Fig. 2 the spectral types range over M3–T2 from top to bottom. At magnitudes 17 the field dwarfs are bluer than the cluster brown dwarfs, but at 17 the field sequence begins to intercept that of the cluster and to follow it slightly towards redder colours.
In the versus and diagrams (Figs. 4 and 5), we show the Pleiades very low-mass stars and brown dwarf candidates having lithium in their atmospheres or proper motions consistent with membership in the cluster (filled circles). The circular symbols (), lines and triangles are defined as in Figure 2. The DUSTY and NextGen isochrones provide relatively good colour predictions for and , respectively, in both diagrams. The fact that the DUSTY model agrees with the observations in the versus and diagrams but not in the versus diagram supports the possible underestimation of the far red flux ( band) relative to the near-IR flux (-, - and bands). In Fig. 4, the M9 Pleiades brown dwarf NPL~40 (festin1998a; festin1998b) has a very blue colour, as noted by pinfield2003. In Fig. 5, the brown dwarf CFHT-Pl-7, with its magnitude probably enhanced by a cosmic ray, is positioned at the left of the upper sequence, and the five very blue candidates at 18.5 (empty circles) are probable contaminants.
In these near-IR colour–magnitude diagrams, where field dwarfs are also represented (M3–L6), similar sequence overlaps appear at 17 as in the versus diagram. Thus the sequence of the L brown dwarf candidates of the Pleiades is nearly indistinguishable from that of the field dwarfs shifted to the cluster distance. Note that the average errors in the distances of the sample field dwarfs are pc (M5–M9) and 1.0 pc (L0–L7), and the average errors in their translated -band magnitudes, including the photometric errors and the distance error of 3 pc for the Pleiades cluster, is of only 0.08 and 0.12 mag, respectively. The average error in their colours is 0.03 mag (M5–M9) and 0.06 mag (L0–L7). These magnitude and colour errors are small in comparison to the (field and cluster) trends observed.
From the versus , and diagrams it appears that, opposite to the Pleiades late M dwarfs, many of the Pleiades L dwarf candidates have the same colours and absolute magnitudes as their field counterparts. This suggests that they may have the same spectral energy distributions and luminosities. If the effective temperatures estimated from the spectral energy distribution do not depend much on the gravity (as indicated by spectral synthesis), then, they may have also the same effective temperatures. These objects would therefore have the same radii. From allen2005, the mean age of field L dwarfs is in the range 3–4 Gyr and the mean mass is in the range 0.06–0.07 , which according to the DUSTY models imply radii of 0.09 . These objects have almost reached the end of the contraction. We note however, that according to the same models (and using the luminosity estimates from Sect. LABEL:subMF), the radii of the Pleiades L brown dwarf candidates are of 0.125 , a value inconsistent with the previous one. Either the predicted evolution of radii with time may have to be revisited by the models, so the Pleiades L dwarfs reach radii of 0.09 in about 120 Myr or, the estimated masses and ages of the field L dwarfs may require a revision toward higher masses or smaller ages. A determination of the radii from the luminosities and the effective temperatures require precise spectroscopic observations which are beyond the scope of the present study.
4 Substellar luminosity function
The -band luminosity function, the number of objects versus bin of -band magnitude, is represented in Fig. 6 for BRB 1–34, our Pleiades very low-mass star and brown dwarf -band candidates (: solid line, : dotted line). The error bars are Poissonian errors, i.e. the square root of the number of candidates per bin. The vertical dotted line delimits the completeness of the survey, at 18.75. For this and fainter magnitudes, the present luminosity function is incomplete (dotted line).

4.1 Contaminants
The number of field M and L dwarfs that may contaminate our sample is obtained as follows. First we subdivide the region in the versus diagram occupied by the 34 objects of Table 1 in small rectangular sections. These sections have heights of half -band magnitude and widths delimited by the bluer envelope (dashed line in Fig. 2) and the reddest object.
Then, we consider the typical colours of M- and L-type dwarfs as a function of the spectral type, based on the same sample of nearby cool dwarfs as mentioned in Section 3.2. Contaminants in our survey are essentially M5–L4 dwarfs. Using the relation from dahn2002 between the spectral type of M7–L8 dwarfs and the maximum distance at which they can be observed for a given -band magnitude (a relation that we assume also valid for M5 and M6 dwarfs), we compute for any spectral type contaminating a given rectangular section the pair of distances associated to the -band magnitude boundaries of the section. Each pair of distances defines a volume towards the Pleiades, e.g. a truncated right pyramid with a square base, with top and base surfaces subtended by the survey angular area, 1.8 deg. This volume is located at the average of the pair of distances ().
We use the densities of dwarfs in the solar neighbourhood provided by kirkpatrick1994 for M5 and M6 spectral types, and by cruz2003 for M7–L4 at 20 pc. We take into account the completeness and sky coverage of these surveys. chen2001 studied the star counts of the Sloan Digital Sky Survey for several hundred thousands stars at high latitudes north and south of the Galactic plane. They obtain an exponential scale height of the old thin disk of 3 pc (late-type stars) and a Sun’s distance from the plane of 4 pc. We assume that this scale height applies also for early L dwarfs. To compute the numerical density of a given spectral type dwarf at an average distance from the Sun, we multiply the solar neighbourhood density by an exponential , where is the scale height, the Sun’s distance to the Galactic plane, the Pleiades cluster’s galactic latitude.
Finally we multiply the volumes by the corresponding densities and obtain the statistical numbers of contaminants. Each section in the versus diagram is thus contaminated by field dwarfs of different spectral types at different distances and with different densities. In Table 5, we summarize our estimate of contaminants. In the first column we indicate the -mag range, in Col. “”, the number of candidates (including CFHT-PLIZ-25 and CFHT-PLIZ-25) and in Col. “Confirmed”, the BRB numbers of the proper motion and lithium Pleiades members. In the next three columns, we give the estimated numbers of contaminants for the spectral type ranges M5–M7, M8–M9 and L0–L4. In column “total”, the total number of contaminants is provided for the entire spectral type range M5–L4. Nine contaminants are already found (Col. “Contaminants found”): (i) CFHT-Pl-8 (moraux2001), CFHT-PLIZ-25 (moraux2003), BRB~19 and BRB~33, (ii) BRB~24, 26, 30 31 and 34. The first set of objects is found by proper motion measurements and the second set by photometry (Col. “Measurement”). The numbers of contaminants found in each spectral type range are indicated in parenthesis. Subtracting these from the total number of contaminants, we obtain the number of remaining contaminants that we may find among our survey candidates (Col. “”).
| range | Confirmed | Estimated numbers of contaminants | Contaminants | Measurement | |||||
|---|---|---|---|---|---|---|---|---|---|
| (Li or pm) | M5–M7 | M8–M9 | L0–L4 | total | found | ||||
| 14.5–15.0 | 7 | 1, 2, 3, 5, 6, 7 | 0.3 | – | – | 0.3 | – | – | 0 |
| 15.0–16.0 | 7 | 8, 9, 10, 11, 12, 13 | 1.6(1) | – | – | 1.7 | CFHT-Pl-18 | prop. mot. | 1 |
| 16.0–17.0 | 3 | 14, 15 | 0.8 | 0.3 | 0.1 | 1.2 | – | – | 1 |
| 17.0–18.0 | 4 | 17, 18 | – | 1.3(2) | 0.3 | 1.6 | CFHT-PLIZ-25,BRB 19 | prop. mot. | 0 |
| 18.0–19.0 | 8 | 20, 21, 22, 23, 27 | – | 1.7(2) | 1.3 | 3.0 | BRB 24, 26 | 1 | |
| (19.0–20.0) | 7 | 28, 29 | – | 2.0(2) | 3.8(2) | 5.9 | BRB 30, 31, 33, 34 | , prop. mot. | 2 |
Including CFHT-Pl-18 and CFHT-PLIZ-25.
BRB number.
We assume only 0 and 1 contaminants that remain to be found in the ranges 15.0–16.0 and 19.0–20.0, respectively, when deriving the effective luminosity and mass functions (see text, Sect. 4.1).
Including BRB 1 which has .