Hydrogen-like nitrogen radio line from hot interstellar and warm-hot intergalactic gas
Abstract
Hyperfine structure lines of highly-charged ions may open a new window in observations of hot rarefied astrophysical plasmas. In this paper we discuss spectral lines of isotopes and ions abundant at temperatures K, characteristic for warm-hot intergalactic medium, hot interstellar medium, starburst galaxies, their superwinds and young supernova remnants. Observations of these lines will allow to study bulk and turbulent motions of the observed target and will broaden the information about the gas ionization state, chemical and isotopic composition.
The most prospective is the line of the major nitrogen isotope having wavelength mm (Sunyaev & Churazov, 1984). Wavelength of this line is well-suited for observation of objects at when it is redshifted to mm spectral band widely-used in ground-based radio observations, and, for example, for , when the line can be observed in 1.3 cm band and at lower frequencies. Modern and future radio telescopes and interferometers are able to observe the absorption by 14N VII in the warm-hot intergalactic medium at redshifts above in spectra of brightest mm-band sources. Sub-millimeter emission lines of several most abundant isotopes having hyperfine splitting might also be detected in spectra of young supernova remnants.
PACS: 32.10.Fn, 98.62.Ra, 98.38.-j, 98.58.-w, 32.30.Bv
Keywords: hyperfine structure, intergalactic gas, supernova remnants, radio lines
2007000001[010]
1 Introduction
In the temperature range K the most abundant ion having hyperfine splitting of the ground state is the H-like ion of the major nitrogen isotope 14N VII with line in radio range at around 5.64 mm (Sunyaev & Churazov, 1984). This wavelength of transition between its hyperfine structure (HFS) components has been estimated with high precision to be mm (Shabaev et al., 1995). Wavelength of this line is well suited for observation of objects at when it is redshifted to mm spectral band widely-used in ground-based radio observations, and, for example, for , when the line can be observed in 1.3 cm band and at lower frequencies. Unfortunately, for our Galaxy and its vicinity with it is difficult to observe this line due to atmospheric absorption. Possibly, this is the main reason why there have been no attempts to observe it from the ground after this line was reported by Sunyaev & Churazov (1984) as a promising candidate for detection of hot rarefied plasmas. Till now astrophysical plasma at such temperatures has been studied only by rocket-based instruments and space ultraviolet and soft X-ray missions such as ROSAT, FUSE, Suzaku, Chandra and XMM-Newton.
One of important and interesting predictions of large-scale structure simulations using hydrodynamical approach is the existence of rarefied intergalactic gas heated to temperatures K. This warm-hot intergalactic medium (WHIM, e.g., Cen & Ostriker (1999) and Croft et al. (2001); Davé et al. (2001)) contains dominant fraction of barions in the present Universe (according to the cosmic census of barions made by Fukugita & Peebles (2004)), but is practically unobserved till now. Computations by Hellsten et al. (1998); Cen & Ostriker (1999) show that heavy element abundances in it rise sharply in regions of higher temperature and density reaching values close to the solar ones.
There were many attempts to observe the WHIM at , but till now only far-ultraviolet absorption lines of lithium-like oxygen ( Å) have been detected by Hubble Space Telescope for and by FUSE spacecraft for (e.g., Danforth & Shull (2005)). Despite many attempts using Chandra and Suzaku (Takei et al., 2006) orbital telescopes, O VII and O VIII soft X-ray lines for are evading detection till now (for example, reported case of detection in Nicastro et al. (2005) was recently criticized by Rasmussen et al. (2006) and Kaastra et al. (2006)). Realization of planned proposals considering the micro-calorimeter X-ray sky surveys (e.g., Sanders et al. (2003)) will certainly highly increase the probability to detect soft X-ray emission and absorption lines from the WHIM.
It is obvious that existence of ground-based methods of detection of this gas will bring a lot of additional strength in such efforts. We are proposing radio observations of hyperfine structure lines of highly-charged ions in sub-millimeter to centimeter bands as a way to get additional information about the velocity field, mass, temperature and chemical abundance distribution of the warm-hot intergalactic medium.
It is important to mention that spectral resolution of radio detectors is better than even that of micro-calorimeters. Therefore these lines might permit to look for turbulence and bulk motions in the objects of interest (Inogamov & Sunyaev, 2003). In addition, radio methods do not only probe the absorption lines in spectra of brightest radio sources in millimeter spectral band, but also the corresponding emission of the gas.
None of the lines we are discussing was detected so far neither in astrophysical objects, nor in physical laboratory conditions. Simplest estimates using well-known relativistic corrections and approximations (Sobelman, 1979) give precision of the HFS line wavelength on the order of few percents. The list of hyperfine structure lines of interest for study of hot plasmas, published by Sunyaev & Churazov (1984), attracted attention of atomic physicists. Zhang & Sampson (1997, 2000) made computations of electronic excitation of HFS levels in plasmas using relativistic distorted-wave method, accounting for resonance effects. Shabaev et al. (1995, 1997) calculated more precise transition wavelengths using a combination of configuration interaction Hartree-Fock method and the perturbation theory.
Observations of supernova remnants brightest in soft X-ray band (according to ROSAT All-Sky Survey (Voges et al., 1999) and recent XMM-Newton studies) indicate the most prospective objects to search for HFS line emission. Knowledge of the studied object radial velocity from optical observations will allow to measure wavelengths of the lines with precision of at least 10 km/s (corresponding to wavelength uncertainty of 30 ppm) that is better than the theoretical estimate precision (200 ppm or more). Knowledge of exact wavelengths will also be very important for study and identification of absorption lines from WHIM filaments. Additionally, one must not forget that such theoretical computations should always be confirmed by experimental measurements.
Among such brightest targets we made estimates of brightness of particular HFS lines arising in Cygnus Loop, North Polar Spur, Vela XYZ, N157B and Cas A supernova remnants (SNR). Our estimates show that in all these objects (except for too hot Cas A) the line of 14N VII is the brightest. Unfortunately, it is subject to atmospheric obscuration.
At Chajnantor plain height ( m, where APEX telescope is operating and Atacama Cosmology Telescope and ALMA interferometer are being built) the air specific attenuation is already significantly less than on the sea level (0.2 vs. 1.1 dB/km at 53 GHz, Liebe et al. (1992)) and atmospheric transmission of 14N VII line may be as high as 30–50% (Schwab & Hogg, 1989). This opens a possibility of direct detection of nitrogen radio line from bright supernova remnants of the southern skies and the Cygnus Loop. High-altitude radio telescopes, naturally, are able to observe this line also at much lower redshifts than the instruments at the sea level.
There are many well-studied star-forming galaxies at redshifts which should have a lot of relatively young supernova remnants with gas in interesting range of temperatures. Such SNRs and galaxies as a whole would be extremely interesting objects to study by means of hyperfine structure lines using existing (such as Green Bank Telescope and VLA) and future (such as Square Kilometer Array and ALMA) radio telescopes and interferometers. Hyperfine lines might be bright also in strong outflows of the hot gas from star-forming galaxies (e.g., Martin (1999)). It is commonly believed that such galactic winds is one of the ways of the intergalactic medium heavy element enrichment.
Hyperfine line observations in principle permit to separate contributions of heliospheric charge-exchange emission and of the Local Hot Bubble, that is now constituting a hardly solvable problem for soft X-ray measurements (e.g., Smith et al. (2005)). This becomes possible due to HFS line emissivity dependence on the plasma density (see below), and the fact that the solar wind is much denser than the gas of the Local Bubble.
The Galaxy is essentially transparent in millimeter band. Therefore the HFS lines allow studying objects that are strongly obscured in visible and soft X-ray bands. Line emission will mostly probe young supernova remnants, but the total absorption column in HFS lines is a measure of hot ( K) interstellar gas in the Galaxy, thus being complimentary to H I 21 cm line probing neutral interstellar medium (ISM).
In case of observations of young supernova remnants where the bulk of emission is coming from the enriched material, it becomes possible to measure the isotopic composition by comparing the HFS line intensity (sensitive to just one isotope) with X-ray lines of the same element (produced by all isotopes).
The structure of the paper is the following. In the first part we are presenting wavelengths and other data on the most abundant isotopes in the temperature range K having hyperfine structure lines in sub-millimeter, millimeter and centimeter bands. We are discussing sub-millimeter lines in connection with ALMA array being able to observe in this spectral band. We are also computing the HFS level population as a function of electron density and radiation temperature for different transitions. In the second part we are presenting the results of the emission line differential brightness temperature computations from some of the brightest objects in our Galaxy and its surroundings. In the last Section we are presenting our estimates of HFS absorption line optical depth arising in WHIM and hot ISM.
2 Hyperfine structure transitions
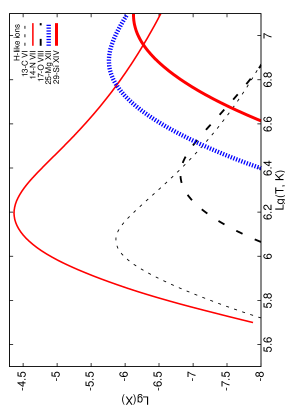
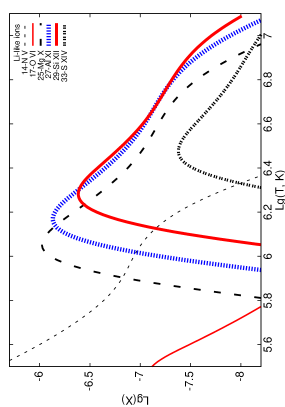
Isotopic abundances (a product of solar elemental abundances from Grevesse & Sauval (1998) and Earth-measured isotopic mole fractions by Coursey et al. (2005)) clearly show (see Table 1) that among isotopes having non-zero nuclear spin the 14N is the most abundant after hydrogen. Its hydrogen-like and lithium-like ions have a hyperfine splitting of the ground state and produce hyperfine structure (HFS) line in spectra of objects with temperatures appropriate for existence of such ions. We include these ions in our analysis, as well as several less abundant H-like and Li-like ions of 13C, 17O, 25Mg, 27Al, 29Si and 33S (see Figure 1).
| Isotope, ion | , nm | , mm | , s-1 | , cm2 | ||
|---|---|---|---|---|---|---|
| 13C VI | 1/2 | +0.7024118(14) | 3.8740(8) | |||
| 14N V | 1 | +0.40376100(6) | 70.72(4) | |||
| 14N VII | 1 | +0.40376100(6) | 5.6519(11) | |||
| 17O VI | 5/2 | -1.89379(9) | 11.813(7) | |||
| 17O VIII | 5/2 | -1.89379(9) | 1.0085(2) | |||
| 25Mg X | 5/2 | -0.85545(8) | 6.680(4) | |||
| 25Mg XII | 5/2 | -0.85545(8) | 0.65809(13) | |||
| 27Al XI | 5/2 | +3.6415069(7) | 1.2060(7) | |||
| 29Si XII | 1/2 | -0.55529(3) | 3.725(2) | |||
| 29Si XIV | 1/2 | -0.55529(3) | 0.38165(7) | |||
| 33S XIV | 3/2 | +0.6438212(14) | 3.123(2) |
Non-relativistic formula of hyperfine splitting energy (Sobelman, 1979) of one-electron ion in state is (in Rydbergs)
where is the nuclear magnetic moment, is the nuclear spin, is the fine structure splitting constant, is the nuclear charge, and are electron and proton mass and is the principal quantum number of the level. Sharp (cubic) dependence on the nuclear charge is seen. Radiation transition probability depends on even more sharply (proportional to , therefore to , see below), that makes HFS transitions in high- ions competitive to hydrogen 21 cm transition even despite their much smaller isotopic abundances.
More precise wavelengths of hyperfine structure transitions are taken from Shabaev et al. (1995, 1997), except for H-like ions 25Mg XII and 29Si XIV where formulas given in Shabaev (1994) were utilized directly. Transition rates are then computed using well-known formula (Sobelman et al., 1981) that in case of H-like and Li-like ions takes the form
| (1) |
where is the largest of the two sublevel total atomic angular momenta and is the transition wavelength expressed in mm. Note that in case of negative nuclear magnetic moment the sublevel with total angular momentum has energy larger than one of .
Absorption cross-section is (Sobolev, 1963):
| (2) |
where and are hyperfine sublevel weights, is a spectral line profile, normalized such that and is the spontaneous transition rate from the upper hyperfine sublevel to the lower .
Near the center of a spectral line , where the Doppler line width is arising due to thermal and turbulent motions of particles in plasma (thermal motion velocity of nitrogen ions at temperature K is about 34 km/s). Inserting this expression into equation (2), we obtain:
| (3) |
It is seen that the absorption cross-section is not dependent directly on the nuclear charge, as the radiative transition rate dependence on the wavelength is canceled by the factor.
In Table 1 we present parameters of HFS transitions, such as wavelengths, transition rates and absorption cross-sections. Abundances of ions (taken from Mazzotta et al. (1998)) of isotopes of interest as functions of temperature are shown on Figure 1.
HFS sublevel electron collisional excitation collision strength values for 13C VI and 14N VII are given by Zhang & Sampson (1997). For other H-like ions they were obtained by scaling along isoelectronic sequence (Beigman, private communication). Respective electron-impact fine-structure excitation cross-sections for lithium-like ions were taken from Fisher et al. (1997). Already Sunyaev & Churazov (1984) noticed that this is the main channel of the ground-state HFS excitation in Li-like ions.
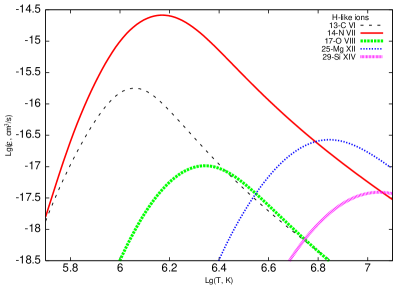
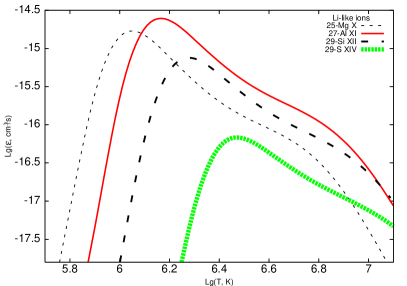
Spectral line emissivity was then computed as
where is the correction factor defined below, is ionic abundance (taken from Mazzotta et al. (1998)), is absolute isotopic abundance relative to hydrogen and is the excitation rate coefficient from level to level , obtained either from excitation cross-sections or from collision strengths. Resulting line emissivities as functions of temperature are shown on Figure 2.
2.1 Optical depth and emissivity corrections
Computing line emissivity as well as line optical depth, one has to account for change in the hyperfine sublevel population due to interaction with cosmic microwave background (CMB) radiation and collisional processes. Both these effects diminish spectral line emissivity and line optical depth (see below).
If we characterize external radiation fields with effective temperature at the frequency of transition (in the majority of cases it will be equal to the CMB temperature111In the vicinity of strong radio sources this effective temperature will be somewhat higher. For the specific sources we are considering, the highest effective temperature is in the Cas A supernova remnant additionally contributing at wavelength 6.5 mm about 1 K to the CMB (Baars et al., 1977). ), the stationary upper-to-lower hyperfine sublevel population ratio is expressed as (e.g., D’Cruz et al. (1998); Liang et al. (1997))
| (4) |
where denote the electron number density, and the photon occupation number is . Here
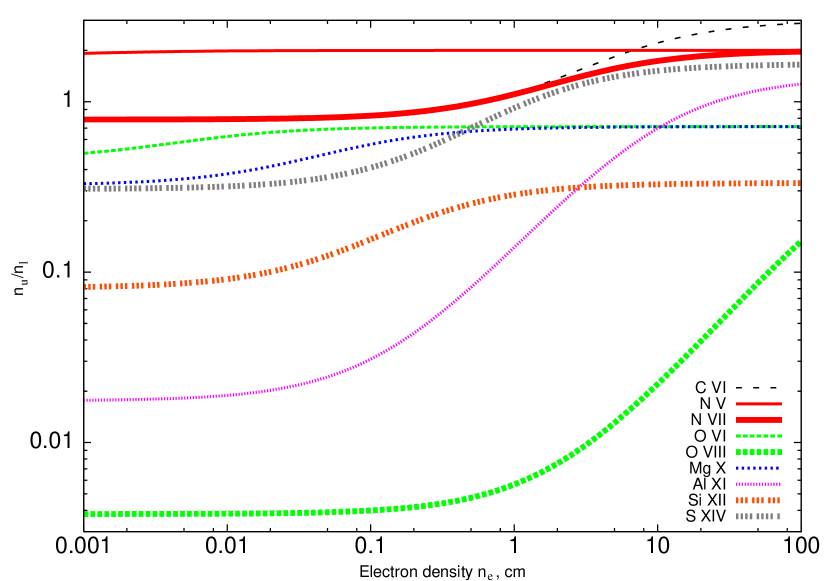
define critical electron number density. Its values for HFS transitions are given in Table 2 for isotopes with cm-3. HFS level population ratio as a function of electron number density is shown in Figure 3.
Then the intensity and optical depth multiplicative correction factor is
| (5) |
In case of this expression reduces to
| (6) |
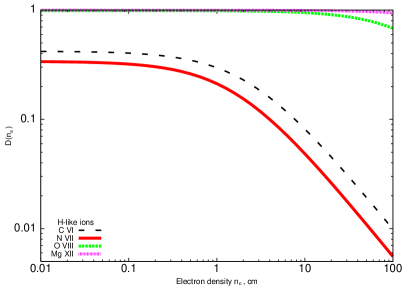
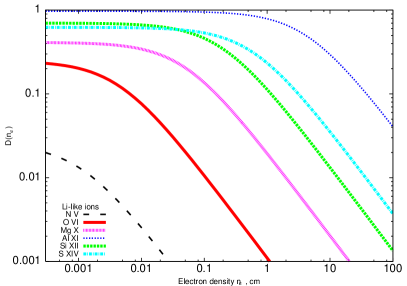
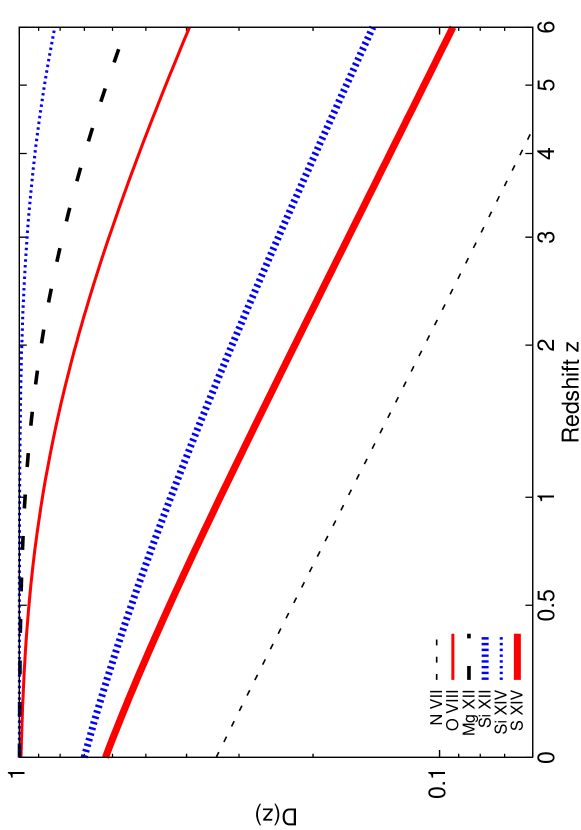
Correction coefficients for zero redshift are given in Table 2 and Figure 4, using K. We also present correction coefficient as a function of redshift for some of relevant transitions on Figure 5.
In the opposite case of
| (7) |
hence the absorption line optical depth depends only on the path length and not on the actual density value. This means that there is a lower limit on absorbing medium path length , that may give rise to a given optical depth . Its approximate values for are given in Table 2. To determine it, we assume solar elemental abundances and maximum ionization fractions (respectively, 0.3 for Li-like and 0.5 for H-like ions). From this Table it can be seen immediately that only larger objects, such as WHIM filaments or large amounts of hot ISM, are observable in absorption. We note that intensities of 14N V and 17O VI hyperfine lines are strongly diminished due to small critical densities of corresponding transitions.
The same effect will make the emission line intensity in high-density environments to be proportional not to emission measure , but to , thus relatively diminishing contribution from the denser regions. This allows one in principle to separate highly-charged ion line emission of the heliospheric and geocoronal charge-exchange reactions from the Galactic halo or Local Bubble emission, that is now virtually impossible for soft X-ray observatories (see also below).
Emissivity of HFS lines of Li-like ions, from the other side, can be enhanced by the resonance excitation by the fine structure lines of the same ions (Field, 1958; Sunyaev & Churazov, 1984) situated in the far ultraviolet and having large resonance scattering cross-sections.
| Isotope, ion | , cm-3 | , kpc | |
|---|---|---|---|
| 13C VI | 0.421 | 4.1 | 0.3 |
| 14N V | 0.0252 | 900 | |
| 14N VII | 0.340 | 1.7 | 0.03 |
| 17O VI | 0.247 | 0.0017 | 9000 |
| 17O VIII | 0.991 | 380 | 0.03 |
| 25Mg X | 0.413 | 0.034 | 50 |
| 27Al XI | 0.970 | 10.2 | 0.10 |
| 29Si XII | 0.701 | 0.18 | 25 |
| 33S XIV | 0.624 | 1.77 | 18 |
3 Emission lines from hot ISM and supernova remnants
3.1 Overview of the brightest objects
To be bright in hyperfine structure emission lines, the plasma should have high emission measure and appropriate temperature. Besides, among objects of equal emission measure the least dense will be the brightest due to diminishing of the with density, as described in the previous section.
Therefore the main types of objects with expected bright emission lines are young and middle-aged supernova remnants (SNR) and the hot interstellar medium (ISM) including galactic halos. As the same H-like ions that we are considering have spectral lines in the soft X-ray band, the objects with bright X-ray lines should also be bright in HFS lines.
According to these selection criteria, we have chosen several objects with parameters given in the Table 3. They include Vela XYZ (Lu & Aschenbach, 2000), Cygnus Loop (Decourchelle et al., 1997) and Cassiopeia A (Lazendic et al., 2006) Galactic supernova remnants, bright supernova remnant N157B (Chen et al., 2006) in Large Magellanic Cloud and hot interstellar gas in the Local Hot Bubble, cool Galactic halo and North Polar Spur (Willingale et al., 2003). All of the bright spots considered in these objects are diffuse (i.e., larger than or comparable to the radio telescope angular resolution), therefore we use the notion of differential brightness temperature in our analysis.
| LHB | CGH | NPS | Vela | N157B | CL | Cas A | HISM | |
| , kpc | — | 0.4 | 0.1 | 0.25 | 50 | 0.44 | 3.4 | — |
| 30’ | 30’ | 30’ | 1’ | 5’ | 5” | — | ||
| , cm-3 | 0.010 | 0.010 | 0.031 | 0.5 | 3.8 | 5.5 | 160 | 0.01 |
| , keV | 0.10 | 0.10 | 0.26 | 0.12 | 0.23 | 0.12 | 0.77 | 0.10 |
| , pc | 60 | 1000 | 160 | 8 | 14 | 1.2 | 0.08 | 3000 |
| RA, J2000 | 16h42m | 16h26m | 16h26m | 08h57m | 05h37m54s | 20h50m | 23h23m35s | — |
| Dec, J2000 | 02∘19’ | 03∘11’ | 03∘11’ | -45∘00’ | -69∘09’ 50” | 32∘11’ | 58∘50’05” | — |
| , cm-6 pc | 0.005 | 0.088 | 0.13 | 2.2 | 200 | 35 | 1000 | 0.3 |
Young supernova remnant Cassiopeia A (Cas A) stands separate in this list as its brightest regions contain material strongly enriched in the supernova explosion. In the considered regions R1, R3 and R4 from Lazendic et al. (2006) the oxygen ions are dominant (constituting more than % by mass), hence the abundances of oxygen, magnesium, silicon and sulphur isotopes of interest may be about three orders of magnitude higher than in other cases, if making rather natural assumption of Earth isotopic mole fractions. This is the main reason of high-intensity signal coming from Cas A (see Table 4). Detection of these isotopes will give important information about nuclear processes leading to formation of isotopes of -elements before and during a supernova explosion.
We use a simple model to estimate emission and absorption in the hot interstellar medium (HISM) of the Milky Way. For this we assume the same temperature and density as in the Local Hot Bubble (see Table 3), but take the path length of 3 kpc (from the total path through the Galaxy of 15 kpc and hot ISM filling fraction of 20%).
3.2 Emission line intensity estimates
From the beginning let us discuss the 14N VII emission line arising in distant () sources. First let us estimate a possibility of its detection from halo of a spiral galaxy. Assuming Milky Way parameters (see above), galactic halo volume emission measure is cm-3. HFS line emissivity for temperature K is cm3/s (see Figure 2). Assuming solar nitrogen abundance, the luminosity in the 14N VII spectral line is about erg/s.
Another sources of the 14N VII HFS emission are supernova remnants (this has been suggested already by Sunyaev & Churazov (1984)) at age between one and ten thousand years. As a numeric example, let us take bright SNR Puppis A (Hwang et al., 2005). Its studies indicate hot gas emission measure of cm-3. Accounting for some diminishing of the correction factor, the luminosity in the spectral line is about erg/s.
Observing the polar cap of nearby galaxy M82 having high star formation rate (3.6 solar masses per year) and apparently being in the process of merger, Suzaku and XMM-Newton orbital telescopes have discovered the gas in the temperature range K (Tsuru et al., 2006) optimal for the 14N VII line detection. It is argued that this gas is moving from the galaxy with hyperbolic velocity.
In a starburst galaxy the star formation rate may be as high as 500 solar masses per year or even higher. This corresponds to supernova rate of about ten per year, therefore the total number of supernova of age below years should be several tens of thousands. Note that a lot of gas reside in a starburst galaxy, hence supernovae will explode in dense medium forming a lot of bright high density supernova remnants. In such galaxy the total luminosity in line may be as high as erg/s.
At the redshift of luminosity in line of erg/s corresponds to signal of only about Jy in the line of about 40 km/s width, showing that the emission signal from this class of objects is difficult to detect using existing instruments. Though, the next generation instruments such as SKA should be able to observe it from high-redshift () star-forming galaxies.
As the zenith atmospheric transmission at 53 GHz at the height of Chajnantor plane reaches up to 50%, telescopes such as APEX and, later, ALMA will be able to conduct the first observations of the 14N VII line from supernova remnants such as N157B which is especially bright in this spectral line.
In case of observations from Chajnantor plane or in case of of emission lines in atmospheric transparency bands, it is preferable to observe first the brightest sources of our Galaxy. In this case the received flux will accordingly rise. Estimates of brightness temperature in hyperfine structure lines from mentioned objects of the Galaxy and its neighborhood are given in Table 4. Solar elemental abundances are assumed everywhere, except for O, Mg, Si and S ions in Cas A supernova remnant, where they are known from Lazendic et al. (2006). Differential brightness temperature of the same order of magnitude is expected as long as the observed object (for example, a galaxy) is larger than the angular resolution of the radio telescope.
We estimate in the 25Mg X HFS line arising in the Milky Way halo, Vela, N157B and Cygnus Loop supernova remnants to be about 5–15 K. As another example, in younger and hotter oxygen-rich Cas A supernova remnant the brightness temperature in mm-band 27Al XI, 29Si XII and 33S XIV hyperfine transition lines is estimated to constitute about 40–80 K. Accounting for resonance excitation due to significant optical depth in the Si XII and S XIV ionic fine structure transitions in the bright Cas A fragments, HFS lines of isotopes of these ions will be enhanced by factors of 1.5 and 2, respectively (in the Table 4 we give values accounting for this increase). For other described sources there is no strong enhancement of HFS line intensity (for example, in N157B the resonance excitation contributes additionally about 20%, assuming solar elemental abundances).
Sub-millimeter lines of 25Mg XII and 29Si XIV arising in Cas A are of the same order of brightness reaching about 50 K. Unfortunately, there is significant atmospheric obscuration on frequencies of these lines at zero redshift, that may give rise to difficulties in the ground-based detection. Simple estimates of ALMA sensitivity, taking its system temperature from sensitivity calculator222http://www.eso.org/projects/alma/science/bin/sensitivity.html to be 1600 K give 3- detection limit on the order of 0.4 mK at 658 m (wavelength of 25Mg XII line) that is about one order of magnitude above the predicted emission line intensities.
Estimates of emission line intensity from WHIM filaments, similar to discussed above, give differential brightness temperature significantly below 1 K due to their low emission measure.
Most of the bright spots we are discussing have angular sizes of the order of arcminute that is similar to the angular resolution of PSPC detector aboard ROSAT and of a 10-meter-class radio telescope. Computing total luminosity of a bright spot it is sometimes comfortable to use its flux that is connected with the brightness temperature from Rayleigh-Jeans formula as
where denote the brightest spot angular size.
| Isotope | , mm | LHB | CGH | NPS | Vela | N157B∗ | CL | Cas A | HISM |
|---|---|---|---|---|---|---|---|---|---|
| 13C VI | 3.8740(8) | 0.01 | 0.15 | — | 1.7 | 4 | 13 | — | 0.4 |
| 14N VII | 5.6519(11) | 0.2 | 3.5 | 1.0 | 70 | 700 | 400 | 7 | 20 |
| 17O VIII | 1.0085(2) | — | — | — | 0.01 | 0.8 | 0.08 | 8∗ | — |
| 25Mg X | 6.680(4) | 0.3 | 5.1 | 0.4 | 8.0 | 15 | 14 | 1.0∗ | 15 |
| 25Mg XII | 0.65809(13) | — | — | — | — | — | — | 40∗ | — |
| 27Al XI | 1.2060(7) | 0.01 | 0.1 | 0.06 | 4.2 | 50 | 40 | 1 | 0.8 |
| 29Si XII | 3.725(2) | — | 0.04 | 0.30 | 1.2 | 30 | 3.0 | 120∗ | 0.7 |
| 29Si XIV | 0.38165(7) | — | — | — | — | — | — | 40∗ | — |
| 33S XIV | 3.123(2) | — | — | 0.15 | — | 10 | — | 150∗ | — |
| ∗ elemental abundances are known from observations | |||||||||
3.3 Resonant scattering in the surroundings of quasar
Detection of emission lines arising in the process of the resonant scattering of the quasar radio emission in the hot and warm gas surrounding the quasar (Sazonov et al., 2004; Kallman & McCray, 1982) might be especially interesting. Discovery of a line formed by the resonantly scattered radiation may shed light upon the quasar radiation beam width, as for the narrow beam much less gas is irradiated (Cramphorn et al., 2004).
As in the quasar neighborhood the photon density might highly exceed one of the CMB radiation, the correction coefficient will decrease there (see Eq. 5). Despite this, arising line brightness is of the same order of magnitude as of the lines described above.
We show it on example of 3C 273 () quasar, having flux about 30 Jy on the wavelength of 14N VII ion line. The quasar radiation photon occupation number at the line frequency exceeds the one due to the CMB inside central 70 kpc. Even so, despite the very low average value of , the additional flux due to resonant scattering in the line center will constitute about 0.5 mJy (assuming gas cloud parameters similar to ones observed around elliptical galaxies). A large number of young supernova remnants is expected to exist in the central region of galaxy surrounding a quasar. Gas of these SNRs will resonantly scatter quasar radiation, additionally increasing the signal.
3.4 Disentangling Local Bubble and heliospheric emission
One of serious problems in studying the Local Bubble — the hot gas cavity around the Solar System — is difficulty of separation of its soft X-ray line radiation from foreground contribution arising in the solar wind and the Earth corona (respectively, heliospheric and geocoronal emission). The latter arise in charge-exchange collisions (Cox, 1998) that are so effective that intensity of e.g. O VIII line may significantly exceed one of the Local Bubble (Smith et al., 2005).
There is an intrinsic difficulty in disentangling these two spectral line contributions in soft X-rays, as both these sources are diffuse. Though, using simultaneous observations of soft X-ray and HFS lines it becomes possible to separate them, as the HFS line emissivity is dependent on density (see Figure 4) and for some ions the correction coefficient is significantly different in dilute Local Bubble gas ( cm-3), denser solar wind ( cm-3) and geocorona ( cm-3). In the last two cases we give the neutral hydrogen number density as it is the primary source of electrons participating in the charge-exchange collisions.
As a tool for such density diagnostics one may take 25Mg X line having critical density of about 0.03 cm-3, that is less than electron density in the Solar System. Hence its line emissivity will be suppressed by a factor of roughly , this factor being dependent on the distances to Sun and to Earth.
For estimates of separate source contributions we use simple models of neutral hydrogen distribution in heliosphere and geocorona and rates of charge-exchange reactions from Greenwood et al. (2001) and Cravens et al. (2001). It follows that the main part of heliospheric emission arises at distances larger than 1 a.u. where the solar wind densities fall down to about cm-3. Hence 25Mg X line emissivity in heliosphere is suppressed by a factor of several (about three) as compared to the Local Hot Bubble. Geocoronal emission mostly arises in regions where electron density is much more than cm-3. Therefore its 25Mg X line emission is suppressed much stronger (by factor of about 100) and is virtually unobservable.
The practical problem of this method, however, is an extremely low brightness temperature from each of these sources. As indicated in Table 4, expected from the Local Bubble is below 1 K; expected contribution from the Solar System is of the same order of magnitude.
4 Absorption lines in WHIM and hot ISM
4.1 Warm-hot intergalactic medium
The prospects of detection of highly-ionized oxygen O VII and O VIII ion absorption X-ray lines from the WHIM are being widely discussed now (e.g., Hellsten et al. (1998); Chen et al. (2003); Cen & Fang (2006)). We estimate below the feasibility of detection of the 14N VII ion HFS absorption line from this medium. Only this isotope is considered, as other HFS absorption lines (e.g., of 25Mg X, 29Si XII) will be at least one order of magnitude weaker due to smaller isotopic abundances (see Figure 1).
Absorption cross-sections of O VII and O VIII X-ray transitions around 20 Å are cm2, i.e. about three orders of magnitude larger than of HFS transitions. Moreover, optical depth of HFS transition is additionally diminished due to population of upper hyperfine sublevel in the field of the CMB radiation. Resulting rough estimate of 14N VII HFS line optical depth corresponding to O VII or O VIII soft X-ray line is only about .
Note that weak emission lines of comparable magnitude have already been detected on GBT. As an example, HCN molecular line with line width of km/s was observed by Vanden Bout et al. (2004) in emission from galaxy at at frequency 27.0 GHz with 1- flux uncertainty of 0.1 mJy. This flux corresponds to optical depth of only , if observed from the source with flux of 10 Jy.
To assess frequency of occurrence of 14N VII absorption lines in WHIM, we use the distribution function of O VIII X-ray absorption line equivalent width from Cen & Fang (2006) and correspondence between the equivalent width and ionic column density from Chen et al. (2003) cosmological simulations. As a first approximation, we also assume that in WHIM conditions the ionization equilibrium curve of O VIII atoms is the same as of N VII atoms333In collisional ionization equilibrium conditions, N VII is abundant at slightly lower temperatures than O VIII. But in the low-density environments ionic abundances change due to photo-ionization and, as a result, N VII abundance widens and becomes rather similar to one predicted for O VIII ion (Chen et al., 2003). and their relative abundance N/O is solar. Then on average in one sight line in the redshift intervals and there is expected one 14N VII HFS line with and , respectively. In case of reported N VII soft X-ray line detection by Nicastro et al. (2005) with ionic column density of cm-2 the optical depth in absorption HFS line would constitute about .
4.2 Hot interstellar medium
Another case of interest concerns absorption by the hot ISM of a spiral galaxy with strong radio source in it. For example, every several years exceptionally luminous radio sources (so-called microquasars) burst in the Milky Way. They retain their outstanding brightness for the time period of several weeks and are thus good candidates to study absorption lines in the hot ISM.
As a specific example of a luminous outburst, there has been observed a brightening of Cygnus X-3 with flux as high as 20 Jy at 10.5 GHz (Gregory et al., 1972) and spectral index estimate of . Cygnus X-3 lies in the galactic plane at a distance of about 9 kpc. Taking the Milky Way parameters as discussed above, the column density of hydrogen ions in hot ISM in the direction of Cygnus X-3 is about cm-2. Resulting HFS line optical depths and respective absorption line (negative) fluxes are given in Table 5.
| Isotope, ion | , mm | , mJy | |
|---|---|---|---|
| 13C VI | 3.8740(8) | 0.17 | |
| 14N VII | 5.6519(11) | 2.0 | |
| 25Mg X | 6.680(4) | 0.10 | |
| 27Al XI | 1.1060(7) | 0.04 |
4.3 Gamma-ray burst afterglows
Significant part of bright gamma-ray afterglows originates from the star-forming regions or star-forming galaxies. The lifetime of afterglow in radio band is longer than days or even weeks. This opens a unique possibility to measure absorption lines in their spectra connected with hot ISM of the parent galaxy, hot intracluster medium of the corresponding cluster of galaxies (if any) and the WHIM along the whole path of radio waves to the source.
The optical depth of the absorption features should not diminish significantly with redshift. Though, the flux from gamma-ray burst radio afterglows (several mJy) is weaker than of brightest high- quasars by about three orders of magnitude that makes the detection of HFS absorption lines a task for the next generation of interferometers such as SKA.
4.4 Estimates of HFS line detectability
Now let us estimate a modern telescope abilities on example of the Green Bank Telescope (GBT) observing absorption line from 3C 279 – one of the the strongest radio sources at 40 GHz with flux of about 15 Jy – with integration time 10 hours and frequency resolution of 1 MHz.
As an example, we assume line redshift of so that the observed 14N VII line is shifted from the atmospheric absorption region. The GBT telescope system temperature near 40 GHz is about 75 K, therefore during the integration time the 1- flux RMS is on the order of 0.1 mJy. Hence, neglecting systematic effects, the 3- detection limit of the optical depth will be of the order of which is of the same order as the N VII HFS line optical depth estimates in WHIM or galactic halo.
As another example, we estimate detection feasibility of the same line in the spectrum of high- quasar 2134+004 (). Its flux density on 18 GHz (redshifted frequency of 14N VII) line is about 5 Jy that allows to detect with similar observation parameters (10 hours integration time, velocity resolution 10 km/s) absorption lines of on 3- level.
From this we conclude that the 5.65 mm 14N VII hyperfine structure line in redshifted WHIM filaments might be detectable in absorption using existing ground-based instruments. Searching for it, it is natural to start from the extragalactic sources brightest in mm band and having redshift , such as 3C 273, 3C 279, 3C 345, 3C 454.3 and 2145+067.
Two more notes would be helpful here. First, from observations of one absorption spectral line it is difficult to both determine redshift and identify the line. Hence observations of known objects or combined with other wavelength data would be desired. Second, HFS absorption line with the same optical depth is easier to detect at higher redshifts, as observed line wavelength moves to lower frequencies where the illuminating background source flux is stronger and telescope sensitivity becomes higher. Opposing it is the factor that is decreasing optical depth in similar gas clouds with redshift for 14N VII line approximately as (see Figure 5).
5 Conclusions
We discuss the feasibility of the emission and absorption hyperfine structure line observations from astrophysical objects in temperature range of K. We find that thanks to 14N high isotopic abundance in interstellar and intergalactic gas the line of 14N VII is the most prospective to be observed in absorption in spectra of brightest mm-band extragalactic radio sources with . Typical optical depth predicted for WHIM filaments is about that is within the reach of the existing instruments. Other HFS lines in absorption will only be detectable with the next generation radio telescopes.
We estimate the 14N VII brightness temperature in emission from several Galactic supernova remnants to constitute up to 700 K. Brightness temperature in other lines of 25Mg, 27Al, 29Si and 33S reaches up to 100 K in oxygen-rich SNR Cas A, the level on the limit of sensitivity of the existing instruments and accessible to future observatories.
Observations of hyperfine structure lines might provide additional information on isotopic composition of supernova remnants, help to discover obscured Galactic SNRs, allow studying star-forming galaxies and superwinds, discriminating between heliospheric and Local Bubble contribution to diffuse soft X-ray background. They might also allow to measure hyperfine splitting experimentally with high precision, thus letting to choose between theoretical highly-charged heavy ion hyperfine splitting computation models and to precise isotopic nuclear magnetic moments.
ACKNOWLEDGEMENTS
Authors are grateful to I.L. Beigman, L.A. Vainshtein and E.M. Churazov for their useful remarks and to B. Aschenbach, T. Dotani, R. Mushotsky and R. Smith for information about the brightest objects of the soft X-ray sky.
References
- Baars et al. (1977) Baars, J. W. M., Genzel, R., Pauliny-Toth, I. I. K., & Witzel, A. 1977, Astron. Astrophys., 61, 99
- Cen & Fang (2006) Cen, R. & Fang, T. 2006, ArXiv Astrophysics e-prints, astro-ph/0601009
- Cen & Ostriker (1999) Cen, R. & Ostriker, J. P. 1999, Astrophys. J., 514, 1
- Chen et al. (2003) Chen, X., Weinberg, D. H., Katz, N., & Davé, R. 2003, Astrophys. J., 594, 42
- Chen et al. (2006) Chen, Y., Wang, Q. D., Gotthelf, E. V., et al. 2006, ArXiv Astrophysics e-prints, astro-ph/0603123
- Coursey et al. (2005) Coursey, J., Schwab, D., & Dragoset, R. 2005, National Institute of Standards and Technology, Gaithersburg, MD
- Cox (1998) Cox, D. P. 1998, Lecture Notes in Physics Vol. 506: IAU Colloq. 166: The Local Bubble and Beyond, 506, 121
- Cramphorn et al. (2004) Cramphorn, C. K., Sazonov, S. Y., & Sunyaev, R. A. 2004, Astron. Astrophys., 420, 33
- Cravens et al. (2001) Cravens, T. E., Robertson, I. P., & Snowden, S. L. 2001, J. Geophys. Res., 106, 24883
- Croft et al. (2001) Croft, R. A. C., Di Matteo, T., Davé, R., et al. 2001, Astrophys. J., 557, 67
- Danforth & Shull (2005) Danforth, C. W. & Shull, J. M. 2005, Astrophys. J., 624, 555
- Davé et al. (2001) Davé, R., Cen, R., Ostriker, J. P., et al. 2001, Astrophys. J., 552, 473
- D’Cruz et al. (1998) D’Cruz, N. L., Sarazin, C. L., & Dubau, J. 1998, Astrophys. J., 501, 414
- Decourchelle et al. (1997) Decourchelle, A., Sauvageot, J. L., Ballet, J., & Aschenbach, B. 1997, Astron. Astrophys., 326, 811
- Field (1958) Field, G. B. 1958, Proceedings of the Institute of Radio Engineers, 46, 240
- Fisher et al. (1997) Fisher, V. I., Ralchenko, Y. V., Bernshtam, V. A., et al. 1997, Phys. Rev. A, 56, 3726
- Fukugita & Peebles (2004) Fukugita, M. & Peebles, P. J. E. 2004, Astrophys. J., 616, 643
- Greenwood et al. (2001) Greenwood, J. B., Williams, I. D., Smith, S. J., & Chutjian, A. 2001, Phys. Rev. A, 63, 062707
- Gregory et al. (1972) Gregory, P. C., Kronberg, P. P., Seaquist, E. R., et al. 1972, Nature, 239, 440
- Grevesse & Sauval (1998) Grevesse, N. & Sauval, A. J. 1998, Space Science Reviews, 85, 161
- Hellsten et al. (1998) Hellsten, U., Gnedin, N. Y., & Miralda-Escudé, J. 1998, Astrophys. J., 509, 56
- Hwang et al. (2005) Hwang, U., Flanagan, K. A., & Petre, R. 2005, Astrophys. J., 635, 355
- Inogamov & Sunyaev (2003) Inogamov, N. A. & Sunyaev, R. A. 2003, Astronomy Letters, 29, 791
- Kaastra et al. (2006) Kaastra, J. S., Werner, N., den Herder, J. W. A., et al. 2006, ArXiv Astrophysics e-prints, astro-ph/0604519
- Kallman & McCray (1982) Kallman, T. R. & McCray, R. 1982, Astrophys. J. Suppl. Ser., 50, 263
- Lazendic et al. (2006) Lazendic, J. S., Dewey, D., Schulz, N. S., & Canizares, C. R. 2006, ArXiv Astrophysics e-prints, astro-ph/0605078
- Liang et al. (1997) Liang, H., Dickey, J. M., Moorey, G., & Ekers, R. D. 1997, Astron. Astrophys., 326, 108
- Liebe et al. (1992) Liebe, H. J., Rosenkranz, P. W., & Hufford, G. A. 1992, Journal of Quantitative Spectroscopy and Radiative Transfer, 48, 629
- Lu & Aschenbach (2000) Lu, F. J. & Aschenbach, B. 2000, Astron. Astrophys., 362, 1083
- Martin (1999) Martin, C. L. 1999, Astrophys. J., 513, 156
- Mazzotta et al. (1998) Mazzotta, P., Mazzitelli, G., Colafrancesco, S., & Vittorio, N. 1998, Astron. Astrophys. Suppl. Ser., 133, 403
- Nicastro et al. (2005) Nicastro, F., Mathur, S., Elvis, M., et al. 2005, Astrophys. J., 629, 700
- Rasmussen et al. (2006) Rasmussen, A. P., Kahn, S. M., Paerels, F., et al. 2006, ArXiv Astrophysics e-prints, astro-ph/0604515
- Sanders et al. (2003) Sanders, W. T., Henry, R. C., Bregman, J. N., et al. 2003, in X-Ray and Gamma-Ray Telescopes and Instruments for Astronomy. Edited by Joachim E. Truemper, Harvey D. Tananbaum. Proceedings of the SPIE, Volume 4851, pp. 388-395 (2003)., ed. J. E. Truemper & H. D. Tananbaum, 388–395
- Sazonov et al. (2004) Sazonov, S. Y., Ostriker, J. P., & Sunyaev, R. A. 2004, MNRAS, 347, 144
- Schwab & Hogg (1989) Schwab, F. R. & Hogg, D. E. 1989, Millimeter-Wave Atmospheric Opacity and Transparency Curves, Tech. rep., Millimeter Array Memo No. 58
- Shabaev (1994) Shabaev, V. M. 1994, Journal of Physics B Atomic Molecular Physics, 27, 5825
- Shabaev et al. (1995) Shabaev, V. M., Shabaeva, M. B., & Tupitsyn, I. I. 1995, Phys. Rev. A, 52, 3686
- Shabaev et al. (1997) Shabaev, V. M., Shabaeva, M. B., & Tupitsyn, I. I. 1997, Astronomical and Astrophysical Transactions, 12, 243
- Smith et al. (2005) Smith, R. K., Edgar, R. J., Plucinsky, P. P., et al. 2005, Astrophys. J., 623, 225
- Sobelman (1979) Sobelman, I. I. 1979, Atomic spectra and radiative transitions (Springer Series in Chemical Physics, Berlin: Springer, 1979)
- Sobelman et al. (1981) Sobelman, I. I., Vainshtein, L. A., & Yukov, E. A. 1981, Excitation of atoms and broadening of spectral lines (Springer Series in Chemical Physics 7, Berlin: Springer, 1981)
- Sobolev (1963) Sobolev, V. V. 1963, A treatise on radiative transfer. (Princeton, N.J., Van Nostrand [1963])
- Sunyaev & Churazov (1984) Sunyaev, R. A. & Churazov, E. M. 1984, Soviet Astronomy Letters, 10, 201
- Takei et al. (2006) Takei, Y., Ohashi, T., Henry, J. P., et al. 2006, ArXiv Astrophysics e-prints, astro-ph/0608072
- Tsuru et al. (2006) Tsuru, T. G., Ozawa, M., Hyodo, Y., et al. 2006, ArXiv Astrophysics e-prints, astro-ph/0609623
- Vanden Bout et al. (2004) Vanden Bout, P. A., Solomon, P. M., & Maddalena, R. J. 2004, Astrophys. J., 614, L97
- Voges et al. (1999) Voges, W., Aschenbach, B., Boller, T., et al. 1999, Astron. Astrophys., 349, 389
- Willingale et al. (2003) Willingale, R., Hands, A. D. P., Warwick, R. S., Snowden, S. L., & Burrows, D. N. 2003, MNRAS, 343, 995
- Zhang & Sampson (1997) Zhang, H. L. & Sampson, D. H. 1997, MNRAS, 292, 133
- Zhang & Sampson (2000) Zhang, H. L. & Sampson, D. H. 2000, Phys. Rev. A, 61, 022707