GALEX high time-resolution ultraviolet observations of dMe flare events
Abstract
Aims. We present near ultraviolet (NUV:1750 - 2800Å) and far ultraviolet (FUV: 1350 - 1750Å) light-curves for flares on 4 nearby dMe-type stars (GJ 3685A, CR Dra, AF Psc and SDSS J084425.9+513830.5) observed with the satellite.
Methods. Taking advantage of the time-tagged events recorded with the photon counting detectors, we present high temporal resolution ( 0.01 sec) analysis of these UV flare data.
Results. A statistical analysis of 700 seconds of pre-flare quiescence data for both CR Dra and SDSS J084425.9+513830.5 failed to reveal the presence of significant micro-flare activity in time bins of 0.2, 1 and 10 second intervals. Using an appropriate differential emission measure for both the quiescent and flaring state, it is possible to reproduce the observed FUV:NUV flux ratios. A major determinant in reproducing this flux ratio is found to be the value of plasma electron density during the flare. We also searched the count rate data recorded during each of the four flare events for periodicity associated with magneto-hydrodynamic oscillations in the active region coronal loops. Significant oscillations were detected during the flare events observed on all 4 stars, with periodicities found in the 30 to 40 second range. Flare oscillations with this periodicity can be explained as acoustic waves in a coronal loop of length of cm for an assumed plasma temperature of K. This suggests a loop length for these M-dwarf flares of less than of the stellar radii. We believe that this is the first detection of non-solar coronal loop flare oscillations observed at ultraviolet wavelengths.
Key Words.:
stars: ultraviolet: other — dMe: flares1 Introduction
Although flare stars were detected early in the last century, it was not until the late 1940’s that flare star research attracted wide-spread attention with the observation by Joy Humason (joy49 (1949)) of a four magnitude eruptive event. Since then there have been many hundreds of publications concerning these active stellar sources. The first coincidence between optical and radio activity was reported by Lovell Solomon (Lovell66 (1966)), with the first X-ray flare being observed by Heise et al. (Heise75 (1975)). Surveys show that low mass M-dwarf (dMe) stars account for more than 75% of the stellar population in the solar neighborhood and, due to the strong magnetic fields that cover most of their stellar disks, many of them exhibit significant levels of coronal activity. In a recent survey of 8000 late-type dwarfs contained in the Sloan Digital Sky Survey (SDSS) catalog, West et al. (west04 (2004)) have found that 50% of stars of spectral class M4 to M9 have high levels of magnetic activity, as inferred by the presence of the H emission line in their stellar spectra. The most easily observable manifestation of this activity is that of stellar flare eruptions, as typified by the star UV Ceti, which involves random outbursts in which the short-term stellar brightness increases significantly on time-scales of seconds to hours at X-ray, UV, visible and radio wavelengths (Schmitt et al. schmitt93 (1993); Phillips et al. phillips88 (1988); Stepanov et al. stepanov95 (1995)). Although the detailed physics associated with the formation of stellar flares is still uncertain (Haisch, Strong Redono haisch91 (1991)), it is clear that these eruptions are linked to the magnetic heating processes occurring in stellar coronae. We note that the soft X-ray emission from flares (which is indicative of gas with temperatures of 106K) is dominated by coronal line-emission, while the UV radiation during flare events originates in the chromosphere and transition region and is characterized by emission from a gas with a temperature of K. There is still much debate as to the relative contributions from emission line and/or UV continuum flux to the total heating budget in flare stars (Robinson et al. robinson01 (2001); Hawley et al.hawley03 (2003); Güdel et al.gudel03 (2003)).
| Star Name | R.A.(J2000) | Dec.(J2000) | Survey Mode | MAST Identifier | Exposure (sec) |
| GJ 3685A | 11:47:41 | +00:15:12 | MIS | MISDR1-13062-0283-0003 | 1244 |
| AF Psc | 23:31:44 | -02:45:12 | GI* | GI1-067026-PGC71626-0002 | 1705 |
| CR Dra | 16:17:05 | +55:16:09 | DIS | ELAISN1-07-0004 | 1650 |
| SDSS J084425 | 08:44:26 | +51:38:31 | MIS | MISDR1-03333-0447-0001 | 1669 |
| * pointed Guest Investigator observation | |||||
Recent EUV and X-ray observations suggest that flares statistically contribute a significant fraction of the overall (X-ray) heating of the coronae on all magnetically active stars (Güdel et al. gudel03 (2003); Arzner Güdel arzner04 (2004)). In particular, the recent satellite observations of dMe star flares by Mitra-Kraev et al. (2005a ) have noted a correlation between the observed ultraviolet (UV) flare energy and the corresponding increase in X-ray luminosity, with the UV flares temporally preceding the peaks in X-ray flux. These observations would seem to support the predictions for the Neupert Effect (Neupert neupert68 (1968)), as outlined in the chromospheric evaporation model for solar flares (Antonucci, Gabriel Dennis anton84 (1984)). In this picture, during the impulsive phase of a stellar flare, the UV/optical emission due to accelerated electrons that gyrate downward along the magnetic field lines and impact the chromosphere, should precede the more slowly evolving X-rays that are emitted by the heated plasma.
Although flare events have been routinely recorded on many M-dwarfs at radio(Jackson, Kundu White jackson89 (1989)), optical (Gunn et al. gunn94 (1994)), Ultra-violet (Robinson et al. robinson01 (2001)), Extreme Ultra-violet (Audard et al. audard00 (2000)) and X-ray (Marino, Micela Peres marino00 (2000)) wavelengths, such observations have generally suffered from both poor temporal-resolution and the inability to track a large event throughout the entire pre-flare to post-flare period. However, Beskin et al. (beskin88 (1988)) recorded emission structure on time-scales of 0.3 – 0.8 seconds in high-temporal (0.3 milli-second) U-band visible observations of flare events on several bright UV Ceti-type stars. Using the scale height of the atmosphere and the velocity of the shock led them to the conclusion that optical flares on M-dwarfs were due to thermal phenomena. We note that U-band observations of both solar and stellar flares have been widely used as a proxy for non-thermal hard X-ray flare emission (Neidig neidig89 (1989), Hawley et al. hawley95 (1995)).
High ( 1 sec) temporal resolution observations of ultraviolet flares can provide detailed information on microflaring activity and also determine whether wave activity is present. Both of these are thought to be important in the heating of coronae (Robinson, Carpenter Percival robinson99 (1999); Roberts roberts04 (2004)). Furthermore, the ability to record emission throughout an entire energetic flare event can provide insights into the nature of the pre-flare and post-flare quiescent phases and how their statistical small-scale flux variations may be related to the onset of a major flare event (Güdel et al. gudel04 (2004)). The NASA satellite (Martin et al. mar05 (2005)), launched in 2003, has recently been shown to be an excellent observational platform for the serendipitous detection and high time-resolved observation of stellar flares in two ultraviolet (UV) photometric bands. For example, an extremely large flare event was observed on the dM4e star GJ 3685A on April 20th, 2004 that revealed an increase in stellar brightness of 10 UV magnitudes in a period of 200 seconds (Robsinson et al. robinson05 (2005)). These UV observations provided compelling evidence for two distinct classes of flares during this eruption, each characterized by significantly different ratios of their measured near UV (NUV) and far UV (FUV) fluxes. In this Paper we re-visit those data (which were analyzed under the assumption of a blackbody energy distribution) and in addition, we report on three further flare events on the stars CR Dra, AF Psc and SDSS J084425.9+513830.5 (hereafter referred to as SDSS J084425) that were serendipitously recorded with a high time resolution of 0.01 sec by the satellite during its all-sky survey observations during the period 2004 - 2005.


2 Observations and Data Reduction
All of the flare events reported in Table 1 were serendipitously recorded within the 1.2∘ field of view of the telescope in the far UV (FUV: 1350 - 1750Å) and/or near UV (NUV: 1750 - 2800Å) photometric bands during imaging survey observations by the satellite (see Martin et al. mar05 (2005) for a detailed description of the instrument and its operational modes). These observations are listed as either Medium Imaging Survey (MIS) or Deep Imaging Survey (DIS) modes in Table 1, together with their total on-orbit exposure times and their data-file identifier as listed in the Multi-Mission Archive at the Space Telescope Science Institute (MAST). The detection of the flare on the star AF Psc was recorded during a pointed observation of a star-field selected for an observation of a galaxy under the auspices of NASA’s Guest Investigator (GI) program.
The FUV and/or NUV data for each flare were recorded as time-tagged events (with a time resolution of 0.01 sec) using the photon counting detectors (Jelinsky et al. jelinsky03 (2003)). These observations have been processed (as a non-standard data-product) using Version 4.0 of the Data Analysis Pipeline operated at the Caltech Science Operations Center (Pasadena, CA), which has been described in detail by Morrissey et al. (mor05 (2005)). The final data product is a flat-field corrected photometric time sequence of photons mapped in Right Ascension and Declination to the sky. Photon events associated with a stellar flare were summed within a 10 arcsec aperture centered at the expected position of the associated dMe star, while photons associated with the background emission were summed within an annulus extending from 15 to 20 arcsec from the central position of the source. We assumed that any (faint) astronomical sources contained within the background annulus remained constant during the bright flare events.
The photon count rates associated with each of the four flare events have been converted into UV fluxes of erg cm-2 s-1 Å-1 using the appropriate FUV and NUV-band calibrations listed in Morrissey et al. (mor05 (2005)). Using these flux corrected data we show the FUV and NUV light-curves as a function of elapsed time for the four flare events in Figure 1 (we note that only NUV data was recorded for the flares detected on CR Dra and SDSS J084425 due to the FUV detector being turned off for satellite operational reasons). In Figure 2 we also show the ratio of the measured FUV to NUV fluxes as a function of elapsed time for both AF Psc and GJ 3685A, which (as described later) can be used as a probe of the temperature variation throughout the duration of these flares.
A general comparison of the light-curves shown in Figure 1 reveals that in all cases there was a very steep and rapid rise in flux (in both the NUV and FUV bands) over a time-scale of 70 seconds. Following this flare peak intensity all the flares exhibit an exponential-like decay that lasts for several hundred seconds. In the case of GJ 3685A there are multiple, smaller intensity flares during this decay phase. The smaller FUV flare on GJ 3685A, which is the least energetic of the events we have detected, is somewhat anomalous in that it seems to be composed of several closely spaced (in time) small flares that gradually increase in intensity over a time-span of 40 seconds. The peak FUV flux then dies away very quickly to the pre-flare basal intensity in less than 50 seconds. Thus the character of the small flare on GJ 3685A exhibits an almost inverse behavior to the larger FUV and NUV flares recorded on the other stars, which generally consist of a very rapid increase in flux followed by an extended exponential-like flux decrease that is often associated with small flares prior to returning to the pre-flare background intensity. We also note that the NUV flare on CR Dra, which exhibits several small brightenings during its decay phase, does not exactly temporally track the FUV behavior, suggesting an origin in a slightly different temperature region.
3 Data Analysis
3.1 Micro-flare activity
Lu Hamilton (lu91 (1991)) suggested that solar flares consists of an avalanche of many very small reconnection events termed micro-flares (or nano-flares). These small-scale phenomena are also thought to be of fundamental importance in the heating of the solar (and stellar) coronae (Parker parker88 (1988); Doyle Butler Doyle85 (1985)). The statistical analysis of rapid time-sequence UV observations of flare activity on two dMe stars by Robinson et al. (robinson95 (1995); robinson99 (1999)) has shown that over a time-scale of a few hours most of the observed increase in integrated flux arises in a slowly varying stellar background whose short-term variability seems consistent with the presence of many overlapping micro-flare events. In the case of the very large flare observed by on GJ 3685A, the stellar UV flux increased by a factor of 5 in the pre-flare period prior to the main flare event (Robinson et al. robinson05 (2005)). However, a statistical analysis of the pre-flare activity of this energetic eruption failed to reveal compelling evidence for an increased level of micro-flaring events.
Due to the relatively short duration ( 1500 sec) of each flare observation by , the present time-tagged photon data are not ideally suited for a rigorous statistical investigation of micro-flare activity, which is best performed over far longer periods (Robinson et al. robinson95 (1995), robinson99 (1999)). However, for the 700 seconds of ‘quiescent’ pre-flare NUV data for CR Dra and SDSS J084425 we have performed a simple test of the statistical significance of the variability in the recorded photon flux (Robinson et al. robinson95 (1995)). Briefly, this method involves searching the pre-flare photon data for time periods during which the count rate deviates significantly above that expected from Poisson statistics. Large micro-flares reveal themselves if the data is binned into small time intervals ( 1 sec), whereas weak micro-flare events require binning over far longer periods ( 10 sec). A micro-flare is deemed a real event if it is detected with a probability 10-2 of it occurring by chance (i.e. the microflare event is 3 above the statistical mean of the data).
In Figure 3 we show 700 seconds of the pre-flare photon data for CR Dra and SDSS J0084425 binned into 0.2, 1.0 and 10.0 second intervals together with the statistical mean levels and their respective 3 limits. Unfortunately none of these plots reveal the presence of a significant flux contribution from any major micro-flare activity. However, due to the limited period of pre-flare observation our present findings do not preclude the presence of micro-flaring immediately prior to the beginning of our observations.
4 Results
4.1 The UV Flare Spectrum
The far ultra-violet band response extends from 1350Å to 1750Å while the near ultra-violet band extends from 1750Å to 2800Å. As already seen from , and spectra of active dMe stars, these spectral windows contain many emission lines. Based on data from the above science missions, the differential emission measure (DEM) distribution of dMe stars has been shown to be similar to the Sun. However, the lack of simultaneous observations over a sufficiently wide wavelength range has resulted in DEM distributions derived over limited temperature intervals (del Zanna et al. delzanna02 (2002), Osten et al. Osten05 (2005)). In the present work we use the volume emission measure of Osten et al. (Osten05 (2005)) as a starting point for the active dMe star EV Lac, and then convert it to the differential emission measure distribution (for a discussion of the different definitions see del Zanna et al. delzanna02 (2002)). Using the CHIANTI package (Landi et al. Landi06 (2005)) and the EV Lac DEM, we have derived the emission line spectrum over the wavelength interval 1200 to 3000 Å. Multiplying by the FUV and NUV response functions then gives us the emission lines contained within the two filters. We note that the continuum contribution from two–photon, bremsstrahlung and free-bound processes are included in these calculations. The FUV and NUV filter contributions were calculated for a range of electron pressures from to cm-3 K. For pressures around cm-3 K, the resulting FUV:NUV filter ratios were around 0.2, substantially less than the observed quiescent value of 0.6 for AF Psc and 1 for GJ 3685A.
As mentioned above, several temperature intervals within the DEM distribution are poorly constrained, e.g. the upper chromosphere/lower transition region. Reducing the EV Lac DEM by a factor of five in the interval log Te = 4.0 to 4.6 results in a FUV:NUV ratio of 0.5 to 1.0. Furthermore, reducing the coronal DEM contribution around K by a factor of 3–4 gives FUV:NUV ratios close to unity even at low electron pressures. In Table 2 we tabulate the FUV:NUV filter ratios for such an amended quiescent DEM distribution as shown in Figure 4.
For the flaring DEM distribution we increased the emission measure over all temperatures ranges, in particular in the region around 100,000 K where the important C iv line is formed. In the third column of Table 2 we list the FUV:NUV filter ratios, here we see values above 3 for the high electron pressure. This shows that in addition to changing the DEM distribution, the electron pressure plays an important role. In earlier work on this data, Robinson et al. (robinson05 (2005)) used blackbody radiation emission in an attempt to reproduce the observed measured FUV:NUV ratios, but found that an additional source of emission was required which he suggested was line emission. With a suitable DEM distribution we derive FUV:NUV ratios ranging from 0.59 to 0.93 for electron pressures of cm-3K in excellent agreement with the observed pre-flare values for AF Psc and GJ 3685A. Using the flare DEM and a higher electron pressure gives FUV:NUV ratios around 3, in good agreement with the AF Psc flare but a factor of two less than that observed in the GJ 3685A flare. Combining the above emission line contribution with a possible “white light” contribution resulting from a higher temperature than the star’s photosphere could lead to larger FUV:NUV for the more energetic flares. Whether this “white light” contribution is important in the far UV remains uncertain.
Regarding other emission contribution possibilities, previous studies of UV and X-ray emission in solar flares have shown an excellent temporal correlation (Cheng et al. cheng81 (1981)), indicating that they might both be a result of the same process of bombardment of the atmosphere by high energy particle beams. However, more recent data (Alexander & Coyner alex06 (2006)) caution against such a preconception. These authors found that the UV and hard X-ray sources were spatially separated, and although they showed a high temporal correlation there was evidence for a magnetic connection between the two regions. Whether this could enhance the UV continuum emission during dMe flares is unclear.
A more likely continuum enhancement mechanism is silicon reconnection. Phillips et al. (phillips92 (1992)) discussed the continuum observed in the far-ultraviolet region from IUE spectra of dMe stars in a flaring state compared with that observed in solar flares. They suggested that the excitation of this continuum was due to the ionization of neutral silicon atoms near the temperature minimum region irradiated by ultraviolet line radiation emitted by the upper chromosphere or transition region. This also appears to be the case for two flares on the RS CVn star (II Peg), and one on the spotted active binary BY Dra. The evidence is an observed proportionality of the continuum intensity with the intensities of strong transition region lines such as C iv 1548.51Å and C ii 1335.36Å. This process is not presently included in CHIANTI and will affect the FUV filter at wavelengths less than 1682Å.
Using our presently proposed flare DEM at an electron pressure of cm-3 K, the dominant emitter is C iv, contributing 35% of the FUV filter with Si iv contributing another 8%. The contribution from weaker lines and the continuum are not insignificant, e.g. between 1560 Å and 1750 Å, there is 27% contribution. In the NUV filter, the dominant line emitters (originating mostly in the upper chromosphere/lower transition region) are Mg ii, Fe ii, Al iii, C iii, etc. For example, Mg ii has 10% contribution, the region from 2320 to 2530 Å is 17% (mostly Fe ii), while the lines around 2290 20 Å supplies 14%. The remaining NUV flux contribution arises from the various continuum processes.
Several coronal lines are also present in both filters, e.g. Fe xxi 1354, Fe xi 1467, O vii 1623, Fe xxi 2298, Fe xx 2666 and Ca xvi 2731. The accumulated contribution of these coronal lines in the FUV filter is around 2%, rising to over 10% in the NUV filter.
These calculations therefore suggest that changing the DEM distribution can change the FUV:NUV flux ratio by a factor of 2–3. However, a major influence on the ratio concerns the increase in electron pressure during the flare. Obviously, with a different DEM these derived emission fractions will change. In Figure 5 we show the range of possible spectral lines present in the FUV and NUV bands during flares on dMe stars based on the DEM (F) distribution from Figure 4.
Very few M dwarfs have directly measured electron densities in the transition region or corona. Testa et al. (Testa04 (2004)), Ness et al. (Ness04 (2004)) and Osten et al. (Osten05 (2005)) give electron densities measurements for a few dMe stars including EV Lac. Using the O vii lines formed around K, Testa et al. (Testa04 (2004)) give Ne cm-3, rising to cm-3 from Mg xi formed around K. Values given by Osten et al. are slightly larger, while those given by Ness et al. are similar at K rising to just over cm-3 at K as derived from Ne ix. At lower temperatures, e.g. K, Osten et al. derived an electron density of cm-3 from O v. This suggests electron pressures ranging from 3 cm-3 K at K to 4 cm-3 K at K. It should however be noted that the derived density at these higher temperatures are a little uncertain due to line blending problems. As an alternative to the contact pressure assumption, we re-run the models for a constant electron density of cm-3 and cm-3. For the DEM (F) distribution, this gives an FUV:NUV flux ratio of around 2.5.


| electron pressure (cm-3 K) | FUV:NUV | FUV:NUV |
|---|---|---|
| DEM (Q) | DEM (F) | |
| 0.59 | 1.00 | |
| 0.93 | 1.66 | |
| 1.27 | 2.35 | |
| 1.46 | 2.54 | |
| 1.84 | 3.04 |
4.2 Oscillations
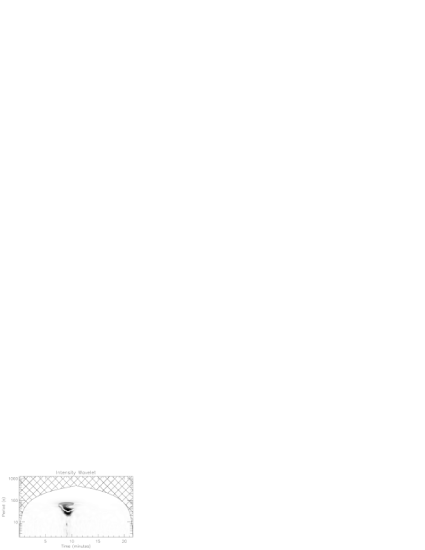
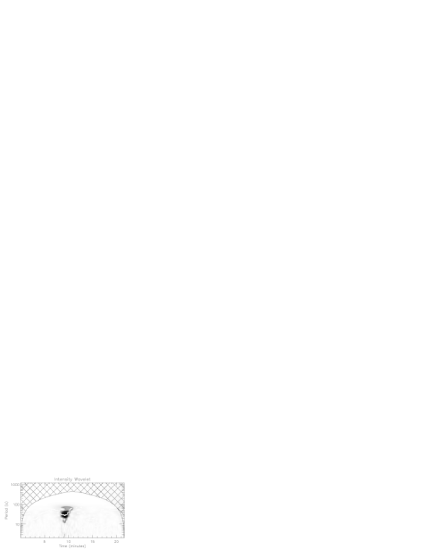
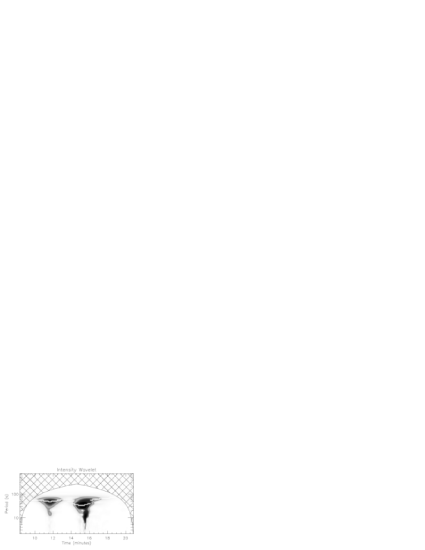
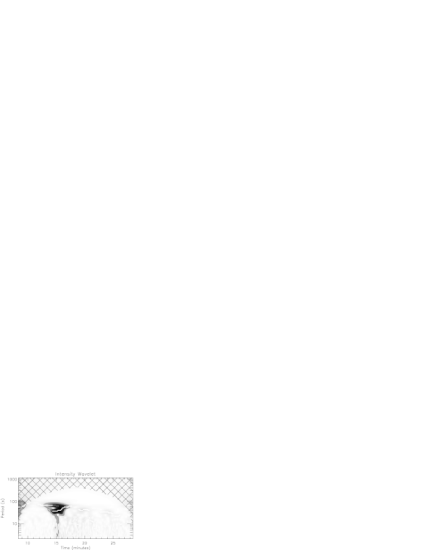
Magneto-hydrodynamic oscillations associated with coronal loops in active regions on the Sun have been widely reported (Aschwanden et al. asch99 (1999)), but only recently have such oscillations been observed during an X-ray flare on an active M-dwarf star (Mitra-Kraev et al. 2005b ). In this latter case evidence was found for a damped oscillation with a period of 750 s, from which a coronal loop length of 2.5 x 1010 cm was derived. Based on this recent success in finding oscillations in M-dwarf flare spectra, we have similarly searched for periodicities in the observed UV photon count-rates from the four flare events observed by using two different analytic tools: the wavelet and the Fourier transform methods. The wavelet transform is used here since it provides information on the location in time of where the oscillations occur, their temporal spread, and also the period of the oscillations. In this, the use of wavelets are an advantage over the more traditional Fourier power spectra method, which only gives information on the periods present within a time series, but no information on where in time that period occurs within the time series of data. Details on the wavelet analysis, which provides information on the temporal dependence of a signal, are described in Torrence Compo (TC98 (1998)) 111see http://atoc.colorado.edu/research/wavelets/. For the convolution of the time series in the wavelet transform we have chosen the Morlet function as defined in Torrence Compo (TC98 (1998)). We note that the wavelet transform “inspects” the time series at a number of temporal scales (periods). In effect, the wavelet transform is a bandpass filter (Torrence Compo TC98 (1998)), and so, by choosing an appropriate scale it is possible to filter the original time series. This is possible since the wavelet transform is a bandpass filter with a known response function and so it is possible to “reconstruct” the original time series using an inverse filter. In our case, we chose only those scales less than 60 sec and then reconstructed the time series containing only periods less than this. The results of applying this method can be seen in Figures 6 to 11. To determine whether or not any oscillations that were found were real, we implemented the Linnell Nemec Nemec (NN85 (1985)) randomization method that estimates the significance level of the main peak in the wavelet spectrum. The use of the randomization technique was performed according to O’Shea et al. (OShea01 (2001)). Only those periods with a significance level above 95% were considered real and used in this work. The use of a significance level of 95% underlines the reliability of the wavelet technique. To back up the use of the wavelets in detecting the oscillation periods, we also show estimates of periods obtained from power spectra measured using smoothed Fourier transforms. We used the Fourier transform method of Jenkins Watts (Jenkins68 (1968)) in a similar manner to that outlined in Doyle et al. (Doyle99 (1999)). Significance levels of 99.9% were used for the power spectra displayed in Figures 6 to 11, and shown as the dashed lines. The fact that the wavelet and Fourier results show the same periods is further evidence of the reliability of using wavelets to measure the periods of oscillation. We note that Figures 6–11 show the flare light-curve, the de-trended data eliminating all periods greater than 60 seconds, the wavelet probability level, the detected periods from the wavelet and Fourier results for all 4 stellar flares. The wavelet probability refers to the maximum power at each time period in the wavelet plot, and is indicated by the over-plotted white line.
Finally, we note that using the “post-mortem” technique of Schwazenberg-Czerny (Schwarz1991 (1991)) and the power spectra in Figures 6 to 11 we can estimate an error in the periods measured from the power spectra of approx. 3–5 sec, which in each case is much less than the typical periods of 30–40 sec being measured.
Evidence for short period oscillations (less than 60s) is found for all of the 4 flaring sources shown in Figure 1. In the NUV and FUV bands of AF Psc strong oscillations with a 30s period are seen in the wavelet plots. This is confirmed by the results from the accompanying power spectrum where broad peaks at 30 sec are seen. In these plots of power spectra the large amount of low period (high frequency) noise can be easily seen. Similarly, both the NUV and FUV bands of GJ 3685A show evidence for short oscillation periods of 40 sec. The main peaks in the power spectra (below 60 sec) for these two bands are at the same period of 40 sec. However the FUV band shows a more complicated structure with evidence of many more peaks present down to lower periods than that seen in the NUV band. For the NUV data of GJ 3685A, the wavelet analysis suggest periods of around 30 sec during the initial stages of the second flare, increasing to 40 sec during the decay phase. This is also seen in the Fourier results. Similarly, the power spectrum CR Dra NUV shows strong evidence for a period around 40 sec. In the wavelet spectrum plot for this source the oscillation is shown as a single peak at a period of 47 sec, lasting for only the time period between 13 and 16 minutes. The failure of the wavelet spectrum to resolve two peaks at 40 and 50 seconds is related to its relatively poorer temporal resolution compared to the Fourier power spectrum, i.e., the restricted number of scales that can be chosen. This is an inherent drawback of the wavelet method that is compensated by the information the wavelet gives us on where an oscillation is occurring in time during the observing period. For the source SDSS J084425, in the NUV we again find a period of 40 sec, measured from both the Fourier and wavelet methods.
Several authors have used radiative and conductive cooling times (e.g., Hawley et al. hawley95 (1995)) to estimate flare loop lengths. During the rise phase, strong evaporative heating is dominant while during the decay phase radiative cooling is dominant. At flare maximum, the above authors equated these two quantiles, giving the loop length as
| (1) |
where is the flare decay time, is the flare rise time, T the apex flare temperature, and , with the peak flare count rate and the count rate at the end of the flare. For the present flares, the typical rise time is 70 sec, the decay time 300 sec and 0.1. Unfortunately, we do not know the plasma temperature, but assuming a range of temperatures from K to K, implies loop lengths of cm. This temperature range is in broad agreement with the results from observations, e.g. in the modelling of X-ray data, Sciortino et al. (Sciortino99 (1999)) derived a maximum temperature of K for EV Lac and a much higher temperature of K for AD Leo. Several authors have also modelled the non-flare X-ray spectral data, e.g. Osten et al.(Osten05 (2005)) and Sciortino et al. (Sciortino99 (1999)) used two and even a three-component model to fit their data. The implied loop lengths from their work was 0.1R∗ for loop temperatures around a few millions degrees, with even smaller loops at the higher temperatures.
Based on the spectral analysis outlined in the previous section, the implied electron pressure during a flare may be close to cm-3 K, implying large electron densities, consistent with measurements. Emslie (Emslie81 (1981)) has suggested that quasi-periodic increases in the hard X-ray flux from solar flares may be the result of the local gas pressure attaining very large values, significantly larger than the values suggested in the previous section. However, the idea that transient increases in the electron density result in quasi-periodic increases in the line flux is never-the-less valid. The quasi-periodic increases in the line flux could be interpreted in terms of fundamental mode quasi-standing waves, these being the easiest to excite. Such interpretation has already been given by Mitra-Kraev et al. (2005b ) to flare oscillations on an active M-dwarf star. The interpretation in terms of propagating waves or higher harmonics is less plausible given the spatial resolution of the observations and the cancellation effect along the loop, i.e., any density increase on one side of the loop would be accompanied by a corresponding decrease one the other side. The theory of coronal loop oscillations was developed by Roberts et al. (roberts84 (1984)). The periods of the oscillations are given by the expression
| (2) |
where corresponds to either the fast kink mode, the fast sausage mode, or the slow sausage mode. The fast kink mode is almost incompressible and can therefore be discarded from further discussion. According to Roberts et al. (roberts84 (1984)), the wavenumbers required for the existence of the fast sausage wave are high under coronal conditions due to the cutoff property. In the case of a standing mode, the wavenumber is determined by the loop dimensions and is below the cutoff value. The remaining possibility is the slow sausage mode. The relationship between the period P, loop length L and temperature T for the fundamental mode slow standing wave is approximately given by
| (3) |
with being the ratio between the cusp speed and the sound speed . Comparing the above relationship with formula (1) we find a ratio for a period of s. In comparison, Mitra-Kraev et al. (2005b ) found a ratio . This means that the plasma inside the loop (i.e., the ratio between the thermal pressure and the magnetic pressure) is slightly higher in the present case.
Slow sausage (acoustic) fundamental mode standing waves have been recently detected on the Sun (Wang et al. wang03 (2003)). These waves are caused by the injection of hot chromospheric plasma at the footpoints of the loops. Taroyan et al. (taroyan05 (2005)) showed that such oscillations could be readily excited if the duration of the plasma injection at the loop footpoint matches the natural fundamental mode period of the loop. The closeness of these two quantities would result in quasi-standing acoustic oscillations. In the present case, the injection of plasma into the loop could be associated with the flare and should last approximately 40 s. Finally, on a precautionary note, we acknowledge that the sequential heating of evenly spaced loops at a constant rate (i.e. in an arcade) could also reproduce the oscillation signature that we have found in these data. We refer the reader to the excellent review of coronal oscillations by Roberts (roberts00 (2000)) for further details of this, and other possible oscillation mechanisms.
5 Conclusion
We have presented near and far ultraviolet light-curves for stellar flares observed with the NASA satellite on the four nearby dMe-type stars GJ 3685A, CR Dra, AF Psc and SDSS J084425. These data were recorded as time-tagged UV photon events with a temporal resolution of 0.01 seconds, thus enabling a detailed time-analysis of both their quiescent and flaring states. During 700 seconds of quiescence, prior to the flare outbursts on both CR Dra and SDSS J084425, no statistical evidence was found for micro-flare outbursts in the NUV with data binned in 0.2, 1.0 and 10.0 second time-intervals.
We have used a modified differential emission model (DEM) curve of the flare star EV Lac in conjunction with the CHIANTI atomic database to produce theoretical DEM curves for a typical dMe star in both quiescence and a flaring state. From the quiescent DEM distribution we were able to reproduce FUV:NUV flux ratios greater than unity, consistent with the measurements during the flares. A critical input parameter in determining the FUV:NUV ratio is the value of plasma electron density during the flare event. It was also found that the major single emitter in the FUV filter is C iv, although weaker emission lines and the continuum provide 50% of the flux. In the NUV filter, a significant contribution comes from upper chromosphere/lower transition region emission lines, in addition to continuum emission. Several coronal lines are present in both filters, with 10% contribution in the NUV filter, whose main contributer is from continuum processes.
We have also searched for periodicities in the observed UV count-rate data recorded during the four flare events to search for coronal loop oscillations. Using both the wavelet and Fourier transform analysis methods on these flare data, we have found compelling statistically significant evidence for oscillations in both of the NUV and FUV data for flares on AF Psc and GJ 3685A, and in the NUV data for the flares on CR Dra and SDSS J084425 with periodicities in 30-40 second range. Assuming typical values of electron pressure during a flare, these periodicities may be due to acoustic waves in coronal loops of length cm for a plasma with a temperature range of K. These values suggest a loop length of less than of the M-dwarf stellar radii. Finally we note that although oscillations have been previously observed on the Sun and in X-ray observations of the M-type dwarf AT Mic, we believe that this is the first detection of non-solar coronal loop flare oscillations at ultraviolet wavelengths.
Acknowledgements.
We gratefully acknowledge NASA’s support for construction, operation, and science analysis for the GALEX mission, developed in cooperation with the Centre National d’Etudes Spatiales of France and the Korean Ministry of Science and Technology. We acknowledge the dedicated team of engineers, technicians, and administrative staff from JPL/Caltech, Orbital Sciences Corporation, University of California, Berkeley, Laboratoire d’Astrophysique de Marseille, and the other institutions who made this mission possible. Financial support for this research was provided by the NASA Guest Investigator program, administered by the Goddard Spaceflight Center in Greenbelt, Maryland. This publication makes use of data products from the SIMBAD database, operated at CDS, Strasbourg, France. CHIANTI is a collaborative project involving NRL (USA), RAL (UK) and the University of Florence (Italy) and the University of Cambridge (UK).References
- (1) Alexander, D. Coyner, A.J., 2006, ApJ, 640, 505
- (2) Antonucci, E., Gabriel, A. & Dennis, B., 1984, ApJ, 287, 917
- (3) Arzner, K. & Güdel, M., 2004, ApJ, 602, 363
- (4) Aschwanden, M., Fletcher, L., Schrijver, C. & Alexander, D., 1999, ApJ, 520, 880
- (5) Audard, M., Güdel, M., Darke, J. & Kashyap, V., 2000, ApJ, 541, 396
- (6) Beskin, G.M., Chekh, S.A., Gershberg, R.E. et al., 1988, Soviet Ast. Letters, 14 65
- (7) Cheng, C.-C., Tandberg-Hanssen, E., Bruner, E.C. et al., 1981, ApJ, 248, 39
- (8) del Zanna, G., Landini, M. & Mason, H.E., 2002, A&A 385, 968
- (9) Doyle, J.G., van den Oord, G.H.J., O’Shea, E. & Banerjee, D., 1999, A&A 347, 335
- (10) Doyle, J.G. & Butler, C.J., 1985, Nat 313, 378
- (11) Emslie, A.G., 1981, Astrophys Lett 22, 41
- (12) Güdel, M., Audard, M., Kashyap, V., Drake, J. & Guinan, E., 2003, ApJ, 582, 423
- (13) Güdel, M., Audard, M., Reale, F. et al., 2004, A A, 416, 713
- (14) Gunn, A., Doyle, J., Mathioudakis, M. & Avgoloupis, S., 1994, A A, 285, 157
- (15) Haisch, B, Strong, K. & Rodono, M., 1991, ARAA, 29, 275
- (16) Hawley, S., Fisher, G., Simon, T. et al., 1995, ApJ, 453, 464
- (17) Hawley, S., Allred, J., Johns-Krull, C. et al., 2003,ApJ, 597, 535
- (18) Heise, J., Brinkman, A.C., Schrijver, J., Mewe, R., Gronenschild, E.H.B.M., den Boggende, A.J.F. & Grindlay, J., 1975, ApJ 202, L 73
- (19) Jackson, P., Kundu, P. & White, S., 1989, A A, 210, 284
- (20) Jenkins, G.M. Ŵatts, D.G, 1968, “Spectral analysis and its applications”, Holden-Day, San Francisco
- (21) Jelinsky, P., Morrissey, P., Malloy, J. et al., 2003, Proc. SPIE, 4854, 233
- (22) Joy, A. & Humason, M., 1949, PASP, 61, 133
- (23) Landi, E., Del Zanna, G., Young, P.R., Dere, K.P., Mason, H.E. & Landini, M., 2005, ApJS, 162, 261
- (24) Linnell Nemec, A.F. & Nemec, J.M., 1985, AJ, 90, 2317
- (25) Lovell, B. & Solomon, L.H., 1966, The Observatory 86, 16
- (26) Lu, E. & Hamilton, R., 1991, ApJ, 380, L89
- (27) Marino, A., Micela, G. & Peres, G., 2000, A A, 353, 177
- (28) Martin, D.C., Fanson, J., Schiminovich, D., et al. 2005, ApJ, 619, L1
- (29) Mitra-Kraev, U., Harra, L., Gudel, M. et al., 2005a, A A, 431, 679
- (30) Mitra-Kraev, U., Harra, L., Williams, D. & Kraev, E., 2005b, A A, 436, 1041
- (31) Morrissey, P., Schiminovich, D., Barlow, T.A. et al. 2005, ApJ, 619, L7
- (32) Neidig, D.F., 1989, SoPh, 121, 261
- (33) Ness, J.-U., Güdel, M., Schmitt, J.H.M.M., Audard, M. & Telleschi, A., 2004, A&A 427, 667
- (34) Neupert, W.M., 1968, ApJ, 153, L59
- (35) O’Shea, E., Banerjee, D., Doyle, J.G., Fleck, B. & Murtagh, F., 2001, A&A 368, 1095
- (36) Osten, R.A., Hawley, S.L., Allred, J., Johns-Krull, et al. 2005, ApJ, 621, 398
- (37) Parker, E., 1988, ApJ, 330, 474
- (38) Phillips, K., Bromage, G., Dufton, P. et al., 1988, MNRAS, 235, 573
- (39) Phillips, K., Bromage, G. and Doyle, J.G., 1992, ApJ, 385, 731
- (40) Roberts, B., 2000, SoPh, 193, 139
- (41) Roberts, B., 2004, ESA SP-547: SOHO 13
- (42) Roberts, B., Edwin, P.M, Benz, A.O., 1984, ApJ279, 857
- (43) Robinson, R., Carpenter, K., Percival, J. & Bookbinder, J., 1995, ApJ, 451, 795
- (44) Robinson, R., Carpenter, K. & Percival, J., 1999, ApJ, 516, 916
- (45) Robinson, R., Linsky, J., Woodgate, B. & Timothy, J., 2001, ApJ, 554, 368
- (46) Robinson, R., Wheatley, J., Welsh, B.Y. et al., 2005, ApJ, 633, 447
- (47) Schmitt, J., Haisch, B. & Barwig, H., 1993, ApJ, 419, L81
- (48) Schwarzenberg-Czerny, 1991, MNRAS, 253, 198
- (49) Sciortino, S., Maggio, A., Favata, F., Orlando, S., 1999, A&A 342, 502
- (50) Stepanov, A., Fuerst, E., Krueger, A. et al., 1995, A A, 299, 739
- (51) Taroyan, Y. Erdélyi, R., Doyle, J.G. & Bradshaw, S.J., 2005, A&A 438, 713
- (52) Testa, P., Drake, J.J. & Peres, G., 2004, ApJ 617, 508
- (53) Torrence, C. & Compo, G.P., 1998, Bull. of the American Meteorological Soc., 79, 61
- (54) Wang, T.J., Solanki, S.K., Innes, D.E., Curdt, W. & Marsch, E., 2003, A&A 402, L17
- (55) West, A., Hawley, S., Walkowicz, L. et al. 2004, AJ, 128, 426