Multi-Wavelength Observations of GRB 050820A: An Exceptionally Energetic Event Followed from Start to Finish
Abstract
We present observations of the unusually bright and long -ray burst GRB 050820A, one of the best-sampled broadband data sets in the Swift era. The -ray light curve is marked by a soft precursor pulse some 200 s before the main event; the lack of any intervening emission suggests that it is due to a physical mechanism distinct from the GRB itself. The large time lag between the precursor and the main emission enabled simultaneous observations in the -ray, X-ray, and optical band-passes, something only achieved for a handful of events to date. While the contemporaneous X-rays are the low-energy tail of the prompt emission, the optical does not directly track the -ray flux. Instead, the early-time optical data appear mostly consistent with the forward shock synchrotron peak passing through the optical, and are therefore likely the beginning of the afterglow. On hour time scales after the burst, the X-ray and optical light curves are inconsistent with an adiabatic expansion of the shock into the surrounding region, but rather indicate that there is a period of energy injection. Observations at late times allow us to constrain the collimation angle of the relativistic outflow to . Our estimates of both the kinetic energy of the afterglow ( ergs) and the prompt -ray energy release ( ergs) make GRB 050820A one of the most energetic events for which such values could be determined.
Subject headings:
gamma rays: bursts — X-rays: individual (GRB 050820A)1. Introduction
With the discovery of the cosmological nature of -ray bursts (GRBs) in 1997 (Metzger et al., 1997), astronomers were suddenly forced to explain the enormous isotropic energy release of these distant explosions. Some of the most energetic events, such as GRB 990123, seemingly released enough energy in the prompt -rays ( ergs; Briggs et al. 1999) to rival the rest mass of a neutron star. Furthermore, broadband modeling of the best sampled events has shown that a comparable amount of energy remains in the shock, powering the long-lived X-ray, optical, and radio afterglow (see e.g. Panaitescu & Kumar 2001; Yost et al. 2003).
The hypothesis that GRBs are a-spherical explosions (Rhoads, 1999), supported by the appearance of achromatic “jet” breaks in a large number of afterglow light curves (Sari et al., 1999), proved to be a turning point. With typical opening angles of a few degrees, the true energy release from most GRBs is ergs, on par with that of a supernova (SN). This realization enabled the discovery of a standard energy reservoir for the collimation-corrected prompt energy (Frail et al., 2001) and kinetic energy of the afterglow (Berger et al., 2003a). GRBs are now considered promising standard candle candidates, with the hope of Hubble diagrams out to offering complementary constraints to Type Ia SNe on the cosmology of our universe (Firmani et al. 2006; Dai et al. 2004; c.f. Friedman & Bloom 2005).
Launched in November 2004, the Swift Gamma-Ray Burst Explorer (Gehrels et al., 2004) was designed to position GRBs, disseminate accurate coordinates to ground-based observatories in real-time, and follow the UV and X-ray afterglows from minutes to days after the event. In only a year of full operation, Swift has brought about a number of fundamental advances in the GRB field, including the discovery of the first X-ray (GRB 050509b; Gehrels et al. 2005) and near-infrared (GRB 050724; Berger et al. 2005) afterglows of a short-hard burst, the detection of the high-redshift () GRB 050904 (Haislip et al., 2006; Cusumano et al., 2006), and the ability to measure broadband light curves starting shortly after, and in a few cases even during the -ray event itself.
Despite these advances, measuring the bolometric fluences of Swift events has proved challenging, for a number of reasons. First, the limited energy range of the Swift Burst Alert Telescope (BAT; Barthelmy et al. 2005) means that Swift can accurately characterize only the softest GRB spectra. Second, few Swift events have shown conclusive signs of a jet break, leaving geometric corrections highly uncertain. Finally, the X-ray light curves of Swift afterglows have shown both bright flares (Burrows et al., 2005b) and slow decays (Nousek et al., 2006). Both behaviors have been attributed to late-time () energy injection, and at times have rivaled the energy release of the prompt -ray emission (see e.g. Falcone et al. 2006).
On 20 August 2005 UT, the BAT detected and localized the unusually bright and long GRB 050820A, a truly rare burst in the Swift sample. The -ray light curve is marked by a soft pulse of emission preceding the main event by over 200 s. The main emission was bright enough to be detected by the Konus-Wind instrument, providing a -ray spectrum extending beyond 1 MeV as well as continuous coverage over the entire 600 s burst duration.
Since Swift triggered on the precursor, both space- and ground-based facilities were able to image the transient during the bulk of the prompt emission. Such contemporaneous multi-wavelength observations have only been achieved for a handful of bursts to date. The bright X-ray ( mJy) and optical ( mag) afterglows made it possible to study the evolution of the afterglow for weeks after the burst, providing one of the most detailed broadband light curves in the Swift era. Finally, late-time Hubble Space Telescope observations allowed us to constrain the jet-break time, and hence the geometry of the outflow. Even after applying the collimation correction, we find GRB 050820A is an exceptionally energetic event.
Our work proceeds as follows: in §2, we outline our broadband observations of the GRB 050820A, beginning with the high-energy prompt emission and followed by the X-ray, optical, and radio afterglow. We find the afterglow data are incompatible with the standard model of synchrotron radiation from a single, highly-relativistic shock expanding adiabatically into the surrounding medium (Sari et al., 1998). Instead in §3 we use power-law fits () to model the afterglow, dividing the burst into segments based on noticeable temporal breaks in the X-ray and optical light curves. This analysis allows us to investigate the early broadband light curve (§4.1 and 4.2), late-time () energy injection in the forward shock (§4.3), the structure of the circum-burst medium (§4.4), and the geometry and energetics of the event (§4.5).
Throughout this work we adopt a standard cosmology with km s-1 Mpc-1, , and . We also make use of the notation .
2. Observations and Data Reduction
In this section, we present our broadband observations of GRB 050820A, which span the spectral range from -rays to radio frequencies and extend in time out to 61 days after the burst. We include an independent analysis of the Swift BAT data set, as well as the complete light curve and spectrum from the Konus-Wind instrument (Aptekar et al., 1995), which, unlike the BAT, was able to observe GRB 050820A over its entire duration (§2.1). In §2.2 we provide an analysis of the Swift X-Ray Telescope (XRT; Burrows et al. 2005a) data, with afterglow detections out to two weeks after the event. We present contemporaneous optical data from the automated Palomar 60-inch telescope (P60; Cenko et al. 2006, in preparation) and the Swift Ultra-Violet Optical Telescope (UVOT; Roming et al. 2005), supplemented by late-time images taken with the 9.2-m Hobby-Eberly Telescope (HET) and the Hubble Space Telescope (HST) (§2.3). Finally, we monitored GRB 050820A in the radio with the Very Large Array beginning only hours after the burst and continuing for approximately two months (§2.4).
2.1. Gamma-ray Observations
2.1.1 Swift Burst Alert Telescope
At 06:34:53 on 20 August 2005 UT111It is customary to refer to the burst trigger time as , for it is assumed to coincide with the beginning of the prompt emission. Given the unique nature of the high-energy emission from GRB 050820A, we undertake a more detailed study to determine exactly when the prompt emission began (i.e. ) in §4.1. Times measured with reference to the Swift trigger time will be referred to as throughout the remainder of this work., the BAT triggered and located GRB 050820A (Swift trigger 151207, Page et al. 2005b). The initial location calculated on-board was a 4′ error circle centered at , (J2000.0). Cummings et al. (2005a) describe a multi-peaked light curve ( s) with clear spectral evolution (hard-to-soft) within each peak.
Following the report of additional high-energy emission from the Konus-Wind instrument (Pal’shin & Frederiks 2005; see §2.1.2), the BAT team re-analyzed their full light curve and found evidence of a much stronger, harder episode of emission from GRB 050820A (Cummings et al., 2005b). Unfortunately the satellite entered the South Atlantic Anomaly (SAA) approximately 240 seconds after the burst trigger, and thus estimates of the properties of this second phase are highly uncertain.
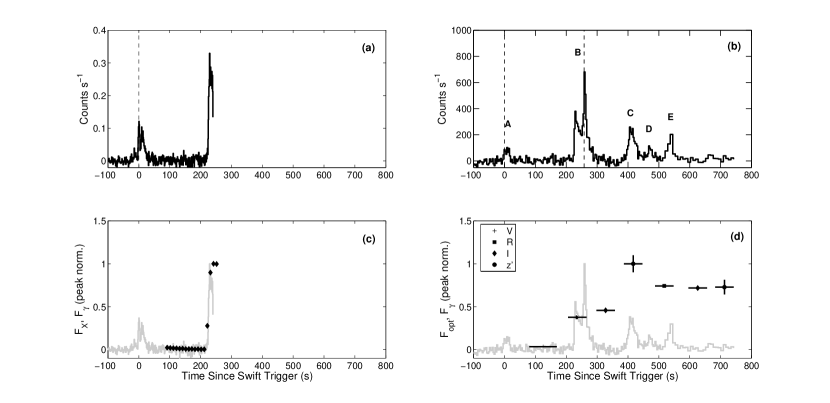
Here we have independently analyzed the BAT data from GRB 050820A. We have extracted the keV light curve in 1 s timing bins using software tools from the Swift data analysis package222Part of NASA’s High Energy Astrophysics Software package, see http://heasarc.gsfc.nasa.gov/docs/software/lheasoft.. The result is shown in Figure 1a. In addition, we have extracted spectra for the two periods of high energy emission covered by the BAT data (peaks and , see §2.1.2). We then fit these spectra to a power-law distribution of energies (). We find evidence for strong spectral evolution between these two intervals, as the second peak is significantly harder than the first. The results of this analysis are shown in Table 1.
| Time Interval | / d.o.f. | |
|---|---|---|
| (, s) | ||
| – | 1.07 / 75 | |
| – | 0.95 / 76 |
Note. — Spectra were fit to a power-law model of the form . Errors reported are 90% confidence limits.
2.1.2 Konus-Wind
The main part of GRB 050820A triggered Konus-Wind at = 06:39:14.512 UT, 257.948 s after the BAT trigger (taking into account the 3.564 s propagation delay from Swift to Wind). It was detected by the S2 detector which observes the north ecliptic hemisphere; the incident angle was 632. Count rates are continuously recorded by Konus-Wind in three energy bands: G1(18–70 keV), G2(70–300 keV), and G3(300–1150 keV). Data collected in this “waiting mode” are acquired in 2.944 s timing bins. The time history recorded in the three energy ranges can be considered a continuous three-channel spectrum.
Immediately following the Konus-Wind trigger, the instrument began simultaneously collecting data in “trigger” mode, as well. From to s, 64 spectra, each composed of 101 energy channels ranging from 18 keV – 14 MeV, were accumulated. The time resolution of these “trigger mode” spectra varies from 64 ms – 8.192 s and is determined by an automated on-board algorithm based on count rate. Data were then processed using standard Konus-Wind analysis tools and spectra were fit with XSPEC.
At least five pulses are evident in the Konus-Wind light curve (labeled , see Fig. 1b and Table 2). Peak , which generated the BAT trigger, appears to be a weak precursor. Figure 2 shows the three-channel light curve of GRB 050820A, as well as the hardness ratios. With the exception of the precursor (peak ), the burst shows an overall hard-to-soft evolution over the entire burst duration, as well as within some of the individual peaks ( and ).
The spectra of individual pulses are well fit by a cut-off power-law model: ; here is the photon index and is the peak energy of the spectrum (see e.g. §4.2). Fitting the overall Konus-Wind “trigger” mode spectrum, accumulated from ()333After this time only a weak tail is seen in the G1 band up to s; this tail contains less than 5% of the total burst fluence. in the 18–2000 keV range yields , and a peak energy keV (90% c.l.; for 62 d.o.f.).
However, in examining the full Konus-Wind light curve (Fig. 1b), it is clear the above time interval does not include a sizable fraction of the -ray emission. To derive the spectral parameters of the time-integrated spectrum over the main part of the GRB (peaks –), we simultaneously fit the three-channel Konus-Wind spectrum accumulated from and the overall multichannel spectrum. We find and a peak energy keV (90% c.l.; for 64 d.o.f.). Not surprisingly the peak energy increased significantly, as the beginning of Peak was the hardest portion of the entire burst. We consider this fit the most accurate estimate of the spectral properties of GRB 050820A.
The fluence and peak flux for each individual episode are shown in Table 2. The total fluence received from GRB 050820A from 20–1000 keV (observer frame) was ergs cm-2 (90% confidence limit).

| Peak ID | Time Interval | FluenceaaThe fluence was extracted from the 20–1000 keV energy range (observer frame) assuming a cut-off power-law spectrum of the form . Errors reported are 90% confidence limits (see §2.1.2 for further details). | Peak Flux |
|---|---|---|---|
| (, s) | ( erg cm-2) | ( erg cm-2 s-1) | |
| – | |||
| – | |||
| – | |||
| – | |||
| – | |||
| Total | – |
2.2. X-ray Observations
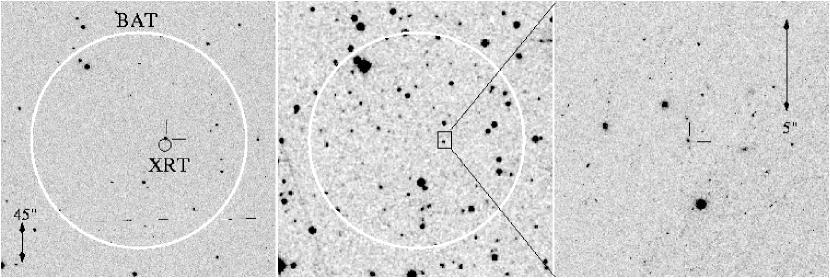
The Swift XRT began observations of GRB 050820A 88 s after the burst trigger. A bright, fading X-ray source was detected by the automated on-board processing routine at , (7″ error radius) and reported in real-time (Page et al., 2005b). Data was taken in Window Timing mode until hr after the burst, when, due to the decreased count rate, Photon Counting mode was automatically initiated.
Here we have independently processed and reduced the XRT data from GRB 050820A (for a previous analysis of the early-time X-ray data, see O’Brien et al. 2006). To reduce the X-ray data, we used the software tools available from the Swift Data Center. We followed standard reduction steps, except for taking measures to mitigate the effects of pulse pileup in our spectral analysis. During the steep rise in the X-ray light curve at s, the XRT countrate exceeds the 200 counts s-1 at which pileup can affect the detector response (Romano et al., 2006). For this segment, we removed the central two pixels from the point source image. At the beginning of Photon Counting mode, we removed the central four pixels of the photon counting mode image for our spectral analysis, again in order to mitigate the effect of pulse pileup (Vaughan et al., 2006).
We fit the X-ray spectrum for Phases 1a, 1b, and 2 separately (see §3 for a full discussion of the division of the X-ray light curve into phases). We used an absorbed powerlaw model, and fit both with the column fixed to the Galactic value ( cm-2; Dickey & Lockman 1990), as well as with the column floating. For Phase 1a, the best fit column is consistent with , and there is little difference between fits with the column floating and fixed. For both Phases 1b and 2 we find acceptable fits with fixed column, however the best fit columns are cm-2 and cm-2 respectively. Therefore we find marginal evidence for absorption in excess of the Galactic value (c.f. Page et al. 2005a).
The results of our analysis of the X-ray light curve of GRB 050820A are shown in Table 7. For the discussion below we adopt the spectral fits in Table 3. These were used to scale the binned count rates to fluxes and flux density at a nominal energy of 5 keV.
| Phase | / d.o.f. | / d.o.f. | ||||
|---|---|---|---|---|---|---|
| (s) | (s) | |||||
| 1a | 0 | 217 | 2.2 0.3 | 1.18 / 11 | 0.63 / 349 | |
| 1b | 217 | 257 | 1.02 / 749 | |||
| 2 | 1.14 / 29 | 1.00 / 770 | ||||
| 3 |
Note. — We separately fit the X-ray light curves and spectra to power-law models of the form and , respectively. The temporal decay in Phases 2 and 3 were fit jointly as a broken power-law, with the break time as a free parameter. In Phase 3, we could not meaningfully constrain the spectral index due to the low count rate. All errors quoted are 90% confidence limits.
2.3. Optical Observations
2.3.1 Palomar 60-inch Telescope
The automated P60 responded to GRB 050820A and began a pre-programmed sequence of observations starting 3.43 minutes after the Swift trigger. The system is equipped with an optical CCD with a pixel scale of 0.378″ / pixel. Images were taken in the Kron and and Gunn and filters. All P60 images are processed with standard IRAF (Tody, 1986) routines by an automated reduction pipeline in real-time. Manual inspection of the first images revealed a bright variable source inside the XRT error circle at , (see Figure 3). This position was promptly reported as the afterglow of GRB 050820A (Fox & Cenko, 2005), allowing others to obtain high-resolution spectroscopy of the afterglow (Prochaska et al., 2005). We continued to monitor the afterglow of GRB 050820A with P60 for the following 7 nights, until it was too faint for quantitative photometry.
Optical photometry of the afterglow was complicated by the presence of two nearby objects: one mag star located ″ south-west of the afterglow, and a fainter mag object located only ″ north-east of the afterglow (see Figure 3, right panel). On some nights of poor seeing, the full-width at half-maximum of our point-spread function (PSF) was larger than . We have therefore performed PSF-matched image subtraction using the CPM technique of Gal-Yam et al. (2004) on our optical data. Errors were estimated by placing 5 artificial stars with flux equivalent to the afterglow in locations with similar background contamination. In addition, we have also used aperture photometry (DAOPHOT) to extract the afterglow flux. On the first night, the afterglow was bright enough to be well-detected either in single images or short co-additions ( s). For these images, both nearby sources were below our detection limit. Results from aperture photometry and image subtraction were therefore consistent. We quote our aperture photometry results for these data, as image defects from imperfect PSF-subtraction seemed to artificially inflate these errors. However, on subsequent nights the afterglow flux was either near or below the level of these nearby objects, and we therefore report results from our image subtraction technique.
Photometric calibration was performed relative to 20 field stars provided in Henden (2005). Kron is similar to Cousins () and was treated as identical for photometric calibration of these images. Magnitudes from the standard Johnson/Cousins system were transformed to Gunn using the empirical relation from Kent (1985). We found, however, a better correlation between our -band filter and the Cousins () filter than from the transformation to Gunn provided in Thuan & Gunn (1976). We therefore use in the remainder of this work. For the Gunn filter, we used the Two Micron All Sky Survey (2MASS; Skrutskie et al. 2006) catalog and the optical photometry provided by Henden (2005) to interpolate the spectral energy distributions of 10 sources to the Sloan bandpass. Typical RMS variations in the calibration sources were mag in and , mag in , and in .
The results of our P60 observations are shown in Table Multi-Wavelength Observations of GRB 050820A: An Exceptionally Energetic Event Followed from Start to Finish. While the expected galactic extinction in this direction is small ( mag; Schlegel et al. 1998), we have incorporated it into our results because of the large wavelength range spanned by our observations ( mag). Errors quoted are 1 photometric and instrumental errors summed in quadrature. For this and all other optical data in this work, magnitudes are converted to flux densities using the zero-points reported in Fukugita et al. (1995).
2.3.2 Swift Ultra-violet Optical Telescope
The Swift UVOT automatically slewed to the BAT location and began observations only 80 s after the trigger. However, the UVOT also becomes inoperable in the SAA and therefore does not cover the period of the main -ray emission.
The Swift team reduced the early-time UVOT data and reported detections in the , , , and bands (Chester et al., 2005). Here we have independently reduced the -, -, and -band UVOT data following the recipe outlined in Li et al. (2006) (see §3.6). As a check, we re-calculated the and zero-points with respect to the field stars from Henden (2005). While our zero-points are consistent with the ones quoted in Li et al. (2006), we found a much larger scatter ( mag vs. mag) that could not be attributable solely to spread in the field stars. We have therefore incorporated the resulting zero-point errors for these data points (as well as a similar value for -band). The results of these observations are shown in Table Multi-Wavelength Observations of GRB 050820A: An Exceptionally Energetic Event Followed from Start to Finish.
2.3.3 Hobby-Eberly Telescope
We triggered target-of-opportunity observations on the 9.2-m Hobby-Eberly Telescope beginning on the night of 26 August UT. Observations were taken in both and filters. A second reference epoch was taken on 29 August UT. Image subtraction was performed on the two epochs to remove contamination from nearby sources (as described in §2.3.1). Photometric calibration was performed relative to 10 reference objects from Henden (2005), and the absolute calibration was of similar quality to the P60 dataset. Our results are reported in Table Multi-Wavelength Observations of GRB 050820A: An Exceptionally Energetic Event Followed from Start to Finish.
2.3.4 Hubble Space Telescope
To better constrain the jet-break time, as well as to investigate the properties of the host galaxy of GRB 050820A, we triggered our Cycle 14 Hubble Space Telescope program (GO-10551; PI: Kulkarni). Using the Wide-Field Camera (WFC) channel of the Advanced Camera for Surveys (ACS), we imaged the field of GRB 050820A on 29 September 2005 UT ( d) in the (), (), and () filters (see Figure 3). A second epoch to study the host galaxy is scheduled for July 2006, and these results will be reported in a future work.
The HST data were processed using the multidrizzle routine (Fruchter & Hook, 2002) in the stsdas IRAF package. We used pixfrac and pixscale for the drizzling procedure, resulting in a pixel scale of ″ / pixel. The astrometry on these images was then tied to a P60 co-addition of all the -band data taken on 20 August 2005 (which is itself tied to the USNO-B1 astrometric grid).
The afterglow is well separated from any nearby objects in the field, and so we have followed the recipe for aperture photometry from Sirianni et al. (2005). As a note of caution, however, flux from an underlying host galaxy could affect the results reported here. Final values for the late time afterglow flux will require image subtraction of any host galaxy contribution, expected following our July observations. and magnitudes were converted to the and band-passes using synthetic spectra from Table 22 of Sirianni et al. (2005). The results of our measurements are shown in Table Multi-Wavelength Observations of GRB 050820A: An Exceptionally Energetic Event Followed from Start to Finish.
2.4. Radio Observations
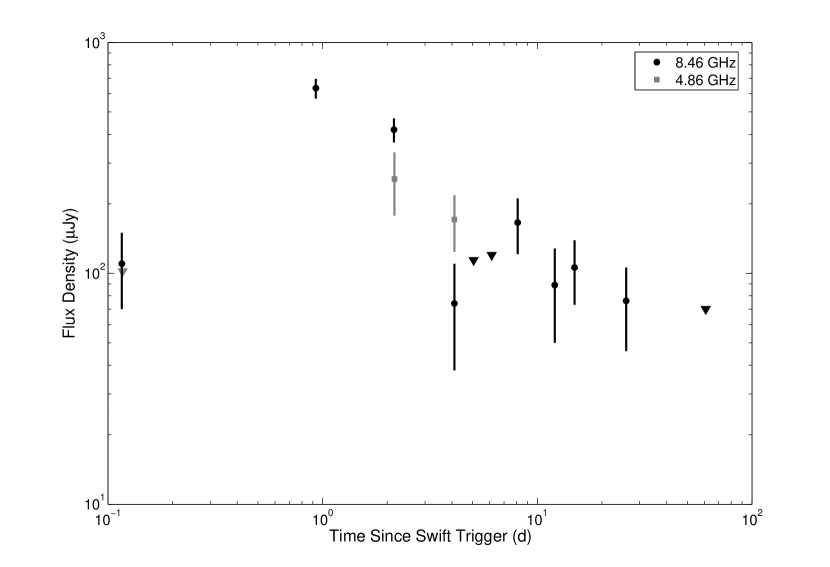
In Table 4 we summarize our radio observations of GRB 050820A, spanning 0.1–61 days after the explosion. All observations were conducted with the Very Large Array444The National Radio Astronomy Observatory is a facility of the National Science Foundation operated under cooperative agreement by Associated Universities, Inc. in standard continuum mode with a bandwidth of 2 50 MHz centered at 4.86, 8.46 or 22.5 GHz. The array was in the configuration, with an angular resolution of 2.3″. We used 3C48 (J0137331) for flux calibration, while J2212+239 and J2225+213 were used to monitor phase. Data were reduced using standard packages within the Astronomical Image Processing System (AIPS).
| Observation Date | Frequency | Flux DensityaaErrors quoted for detections are at the 1 level. Upper limits are reported as 2 RMS noise. | |
|---|---|---|---|
| (2005 UT) | (days) | (GHz) | (Jy) |
| Aug 20.39 | 0.116 | 4.86 | |
| Aug 20.39 | 0.116 | 8.46 | |
| Aug 20.39 | 0.116 | 22.5 | |
| Aug 21.20 | 0.93 | 8.46 | |
| Aug 22.42 | 2.15 | 4.86 | |
| Aug 22.42 | 2.15 | 8.46 | |
| Aug 22.42 | 2.15 | 22.5 | |
| Aug 24.38 | 4.11 | 4.86 | |
| Aug 24.38 | 4.11 | 8.46 | |
| Aug 25.32 | 5.05 | 8.46 | |
| Aug 26.40 | 6.13 | 8.46 | |
| Aug 28.37 | 8.10 | 8.46 | |
| Sep 1.33 | 12.06 | 8.46 | |
| Sep 4.18 | 14.91 | 8.46 | |
| Sep 15.20 | 25.93 | 8.46 | |
| Oct 20.19 | 60.92 | 8.46 |
3. Analysis
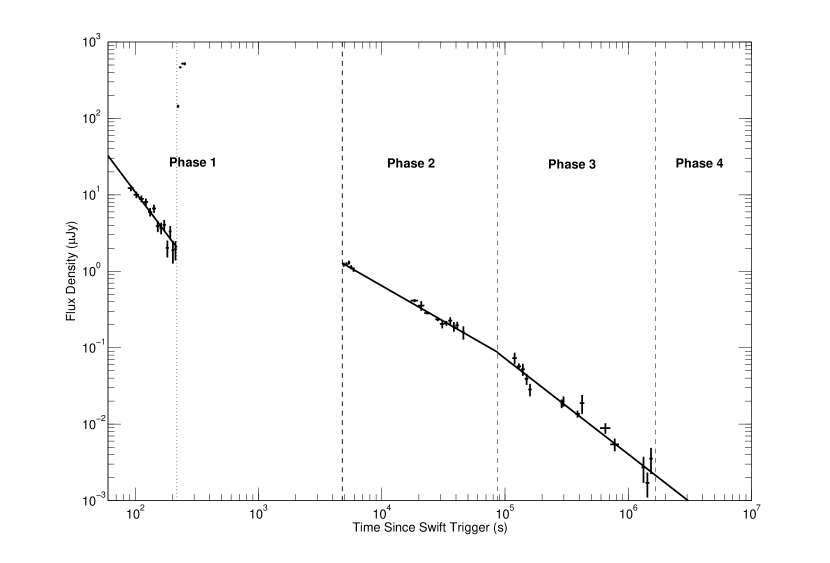
In this section we provide an analysis of the X-ray, optical, and radio light curves and spectra of the afterglow of GRB 050820A. We have divided the X-ray and optical light curves into segments (Phases 1–4) based on noticeable temporal breaks. We then investigated each segment independently, fitting the light curve and spectra to power-law decay indices of the form: . The lack of a bright afterglow makes such analysis impossible in the radio.
The X-ray and optical light curves, with temporal divisions marked as dashed vertical lines, are shown in Figure 4. Phase 1 begins with the BAT trigger and ends with the resumption of X-ray observations at s. The X-ray and optical data behave differently in Phase 1, resulting in unique subdivisions for the two band-passes. However, Phase 1 is the only epoch to show such divergent behavior.
With the emergence of Swift from the SAA at , both the X-ray and optical light curves exhibit a relatively shallow decline. This characterizes Phase 2, which ends when the X-ray decline steepens at s. The decay slope in Phase 3 is steeper than in Phase 2 in both band-passes.
Phase 3 extends out to the last X-ray detection at s. Between this time and the HST optical observations, the optical decay must have significantly steepened. This last epoch, with only optical data, we define as Phase 4.
The results of this power-law analysis are shown in Tables 3 and 5. Each bandpass is discussed in further detail below.
| Phase | / d.o.f. | ||||
|---|---|---|---|---|---|
| (s) | (s) | ||||
| 1a | 626 | … | 3.00 / 13 | ||
| 1b | 626 | 1.53 / 14 | |||
| 2 | 5.7 / 31 | ||||
| 3 | 1.43 / 18 | ||||
| 4 |
Note. — We have fit the optical data to a power-law model of the form where possible. In some Phases (1a and 3), we have limited spectral coverage and could not meaningfully constrain . Thus we have only fit for the temporal decay index . In Phase 4, we can only place an upper limit on the decay slope. All errors quoted are 90% confidence limits.
3.1. X-ray Light Curve and Spectrum
The X-ray light curve of GRB 050820A is shown in Figure 4 (top panel). In Phase 1, we see two distinct behaviors: initially the X-ray light curve falls rapidly with a decay slope . This continues until s, and we define this as Phase 1ax. The X-ray emission then rises rapidly ( s; Phase 1bx), after which Swift enters the SAA. It is clear from the correlation between the -ray and X-ray emission in this epoch that the two are related (see Fig. 1c). A full study of the properties of Phase 1bx is left to §4.2.
Following Swift’s emergence from the SAA, the light curve in Phase 2 shows evidence for a shallower epoch of decline. With the large gap in coverage, we cannot constrain when this transition occurs. We therefore define to coincide with the resumption of XRT observations at s. A similar break in the optical light curve is also seen near this time (§3.2).
The X-ray data after are not well fit by a single power-law decay (; 31 d.o.f.), due mostly to a steepening of the decay at s. Fitting a broken power-law model to this data, we find an acceptable fit with s (; 25 d.o.f.). The resulting decay index before the break (Phase 2) is . For Phase 3, we find .
The X-ray spectral index in Phase 1ax is relatively steep: . The spectrum hardens significantly in Phase 1bx (), further justifying our decision to split Phase 1 into two separate X-ray segments. In Phase 2, the spectrum softens again, to . There are too few X-ray counts in Phase 3 to meaningfully constrain the spectrum.
The results of our analysis of the X-ray data set are summarized in Table 3.
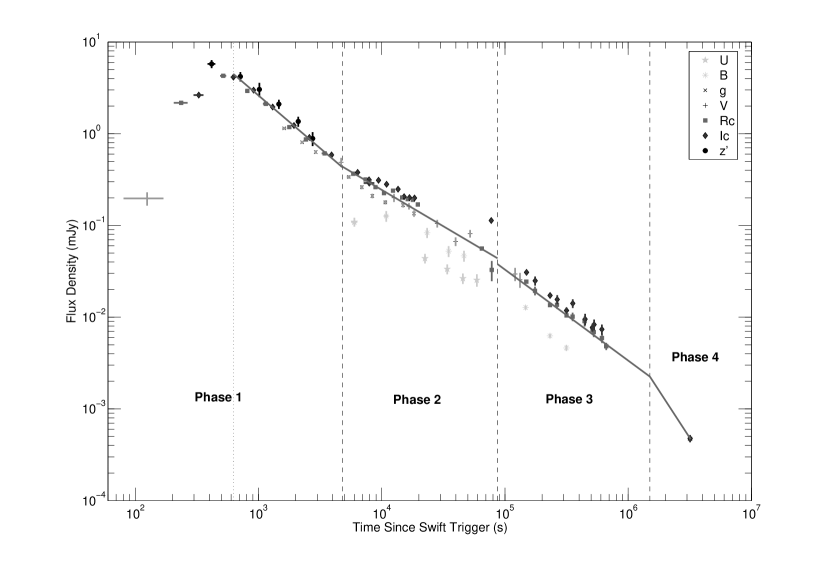
3.2. Optical Light Curve and Spectrum
The optical light curve from GRB 050820A is shown in Figure 4 (bottom panel). Phases 1 (), 2 (), and 3 () of the optical light curve have already been defined in terms of the X-ray decay. However, unlike the X-ray, the earliest optical observations indicate the afterglow was getting brighter with time (Cenko & Fox, 2005; Wren et al., 2005). This rise continues until a peak at s, marking the end of Phase 1aopt. After the peak, the optical light curve in all four P60 filters decays steadily with until . We note that for this and all subsequent phases, we have constrained to be identical in all optical filters. A more thorough discussion of Phase 1 is left to §4.2.
Much like the X-ray, the optical decay in Phases 2 and 3 is poorly fit by a single power-law (; 49 d.o.f.). In Phase 2, the optical decay noticeably flattens (). A much higher degree of variability is seen in the different filters, resulting in a poor fit statistic. After the decay in Phase 3 is again steeper and more uniform, with .
It is clear that if we extrapolate the decay from Phase 3 out to the HST observations, the late-time flux is greatly overestimated. We conclude therefore a break has occurred in the light curve sometime after , and thus we define Phase 4 to span . We estimate the temporal decay in Phase 4 to be .
Due to the limited spectral coverage of our observations, we are unable to provide meaningful constraints on the spectral index in Phases 1aopt, 3, and 4. For the remaining epochs, we have excluded the - and -band data from our spectral fits, as these are expected to lie below the Ly- absorption edge at this redshift. We attempted to solve for the host galaxy reddening ((host)) using extinction laws for the Milky Way, Large and Small Magellanic Clouds from Pei (1992). In all cases, we find a host extinction consistent with zero. While this result is inconsistent with the column density derived from high-resolution spectroscopy (Ledoux et al., 2005), it is in agreement with the low host extinction values seen in almost all well-sampled pre-Swift afterglows (Kann et al., 2006).
Ignoring host reddening, we find and . While the optical spectrum appears to have steepened in Phase 3, the poor fit quality of this phase precludes any firm conclusions from being drawn.
The results of our analysis of the optical data set are shown in Table 5.
3.3. Radio Light Curve
The radio emission rises to a peak sometime around 1 d after the burst (see Figure 5 and Table 4). The radio spectrum at early times is quite chaotic, transitioning through a peak around 8.5 GHz at d to optically thin 4.11 d after the burst. We note that some of the variation at early times may be due to inter-stellar scintillation (Goodman, 1997) as has been in seen in many other radio afterglows (see e.g. Frail et al. 1997).
The late-time ( d) radio data show no sign of any afterglow brighter than 200 Jy. This is in marked contrast to the bright optical and X-ray afterglows, and is one of the most difficult aspects of the afterglow to account for (§4.4).
4. Discussion
In this section, we use the results from our previous analysis to try and explain the broadband emission from GRB 050820A in the context of the standard fireball model (see e.g. Piran 2005 for a review). In this model, highly-relativistic ejecta are emitted by a central engine as shells with varying Lorentz factors. Shock fronts formed between these shells produce the high-energy prompt emission; these collisions are known as internal shocks. Emission from internal shocks is highly non-thermal and results in an (empirically determined) power-law spectrum with a cut-off exponential: (Band et al., 1993). As the relativistic shells expand and slow down, they eventually encounter the circum-burst medium. Again a collision-less shock front forms, accelerating electrons to a power-law distribution of Lorentz factors with exponent and minimum Lorentz factor . It is assumed that a constant fraction of the total energy density is partitioned to the electrons () and the magnetic field (). These accelerated electrons then emit synchrotron radiation, powering the long-lived X-ray, optical, and radio afterglow (the forward, external shock). Additional emission can be generated from shock heating of the ejecta (the reverse shock), leading to a rapidly-decaying flare in the optical and radio light curve (Sari & Piran, 1999b).
The observed afterglow spectrum depends on the relative ordering of the three critical frequencies: , the frequency where self-absorption becomes important, , the characteristic frequency of the emission, and , the frequency above which electrons are able to cool efficiently through radiation. Typical afterglow observations occur when (i.e. slow cooling), resulting in the following spectral indices (Sari et al., 1998):
| (1) | |||||
| (2) | |||||
| (3) | |||||
| (4) |
The light curve produced by such emission depends on the radial profile of the circum-burst medium into which the shock is expanding. The simplest circum-burst medium to consider is one in which the density is constant (). This scenario is also referred to as an inter-stellar medium (ISM). In this case, the flux density will scale as (Sari et al., 1998):
| (5) | |||||
| (6) | |||||
| (7) | |||||
| (8) |
Alternatively, if we eliminate from the above equations, we find a characteristic relation between and in each spectral regime known as a “closure relation” (Price et al., 2002):
| (9) | |||||
| (10) | |||||
| (11) | |||||
| (12) |
The long-soft class of GRBs, however, is thought to arise from the deaths of massive stars, as they collapse to form black-holes: the so-called “collapsar” model (Woosley, 1993). In the late stages of evolution, massive Wolf-Rayet stars are stripped of their outer envelopes in a wind, leaving behind a signature density profile that should be discernible in the afterglow light curve. The analogous temporal decay indices for a wind-like medium are (Chevalier & Li, 2000):
| (13) | |||||
| (14) | |||||
| (15) | |||||
| (16) |
The derived closure relations are:
| (17) | |||||
| (18) | |||||
| (19) | |||||
| (20) |
The above temporal decay indices and closure relations (Equations 5-20) are only valid for spherically symmetric emission. GRBs, however, are thought to be beamed events. At early times, observers only notice emission from a narrow cone (opening angle , where is the Lorentz factor of the expanding shock) due to relativistic beaming (see e.g. Rybicki & Lightman 1979). As the shock slows, however, lateral spreading of the jet becomes important, and the observer eventually notices “missing” emission from wider angles (Rhoads, 1999; Sari et al., 1999). This hydrodynamic transition manifests itself as an achromatic steepening in the afterglow light curve, with an expected post-jet-break decay proportional to .
With the above formulation in hand, we now wish to understand the physical implications of our previous analysis.
4.1. Early -ray Emission
The most striking feature of the -ray light curve of GRB 050820A is the large gap between the initial pulse that triggered the Swift BAT (Peak A in Fig. 1b) and the bulk of the high-energy emission ( s). The natural question arises as to whether this “precursor”555Here we define a precursor as an event that is well separated from and contains only a small fraction of the total high-energy emission. Unlike some other authors, our definition is independent of the mechanism behind the emission. Peak in GRB 050820A is then clearly a precursor. results from the same physical mechanism as the bulk of the high energy emission. Many models predict a high-energy component distinct from the prompt GRB at early times. Possible mechanisms include the transition from an optically thick to an optically thin environment in the fireball itself (Paczynski, 1986; Lyutikov & Usov, 2000; Mészáros & Rees, 2000; Lyutikov & Blandford, 2003), or the interaction of a jet with a progenitor, presumably a collapsing Wolf-Rayet star (Ramirez-Ruiz et al., 2002; Waxman & Mészáros, 2003).
We can securely rule out both of these models for the precursor of GRB 050820A, as both predict a thermal spectrum. Fitting a thermal model to the BAT precursor spectrum results in a fit statistic of (75 d.o.f.), while a non-thermal power-law model provides an excellent fit ( for 75 d.o.f.; ).
While the precursor may be non-thermal, it is noticeably softer than the majority of the remaining prompt emission (see Figs. 2d and 2e). A search for precursors in a sample of long, bright BATSE bursts revealed such a soft, non-thermal component in a sizable fraction (20–25%) of these events (Lazzati, 2005). Furthermore, two of the longest, brightest Swift bursts observed to date, GRB 041219 (Vestrand et al., 2005; McBreen et al., 2006) and GRB 060124 (Romano et al., 2006) show a faint, soft precursor followed by a large time lag (570 s in the case of GRB 060124).
These soft precursors are inconsistent with the main prompt emission in most GRBs, which exhibits a hard-to-soft evolution in the -ray spectrum (Ford et al., 1995; Frontera et al., 2000). The -ray light curve of GRB 050820A conforms to this trend only if we ignore the precursor. Furthermore, it is difficult to conceive of a scenario by which internal shocks can generate such long periods of quiescence in a sustained outflow. The large time lag, soft nature, and repeated occurrence of these precursors hint that they are in fact due to a different emission mechanism than the internal dissipation thought to power the bulk of the high-energy emission. However, we cannot state this conclusively, as would be the case if the precursors were thermal.
If we assume a different emission mechanism, the prompt emission did not begin until 222 s after the Swift trigger. This seemingly small discrepancy in defining affects the calculated temporal decay indices, particularly during the early afterglow (§4.4). For all temporal decay indices calculated in this work, we consider to coincide with the beginning of the bulk of the high-energy emission (i.e. 06:38:35 UT on 20 August 2005).
Finally, we consider the early X-ray emission. The temporal decay slope at early times () is too steep to be attributed to a standard forward shock afterglow. The most popular explanation for the rapid decline of early X-ray emission in Swift GRBs is “high-latitude emission”: prompt emission from large angles () that, due to relativistic beaming effects, reaches the observer at late times (, Kumar & Panaitescu 2000). However, this results in a well-defined relationship between the spectral and temporal indices () which is inconsistent with the observed values for GRB 050820A.
Zhang et al. (2006) discuss possible mechanisms that could cause the early-time decay slope to deviate from this behavior. The most realistic possibility is if the X-rays were below the cooling frequency at this very early epoch. Then the closure relation would take the form (Sari & Piran, 1999a), in good agreement with the observed value.
| Interval ID | Duration | -Ray FluxaaErrors quoted are at the 1 level. | bbSpectral fits of the form were performed for the case of Intervals 2 and 4. For interval 5, the highest-energy data were not of sufficient quality to estimate . Instead a power-law fit () was used. Errors quoted are 90% confidence limits. | bbSpectral fits of the form were performed for the case of Intervals 2 and 4. For interval 5, the highest-energy data were not of sufficient quality to estimate . Instead a power-law fit () was used. Errors quoted are 90% confidence limits. | / d.o.f. | Optical Filter | Optical Flux DensityaaErrors quoted are at the 1 level. | cc-ray-to-optical color index: . | |
|---|---|---|---|---|---|---|---|---|---|
| (s) | (s) | ( erg cm-2 s-1) | (keV) | (mJy) | |||||
| 1 | 80.949 | 85.376 | |||||||
| 2 | 257.839 | 8.448 | 0.83 / 62 | 12.5 | |||||
| 3 | 297.775 | 59.904 | |||||||
| 4 | 389.167 | 57.344 | 0.78 / 62 | 10.0 | |||||
| 5 | 487.471 | 57.344 | 1.01 / 58 | 9.2 | |||||
| 6 | 602.159 | 49.152 | |||||||
| 7 | 684.079 | 57.344 | |||||||
4.2. Contemporaneous X-ray and Optical Emission
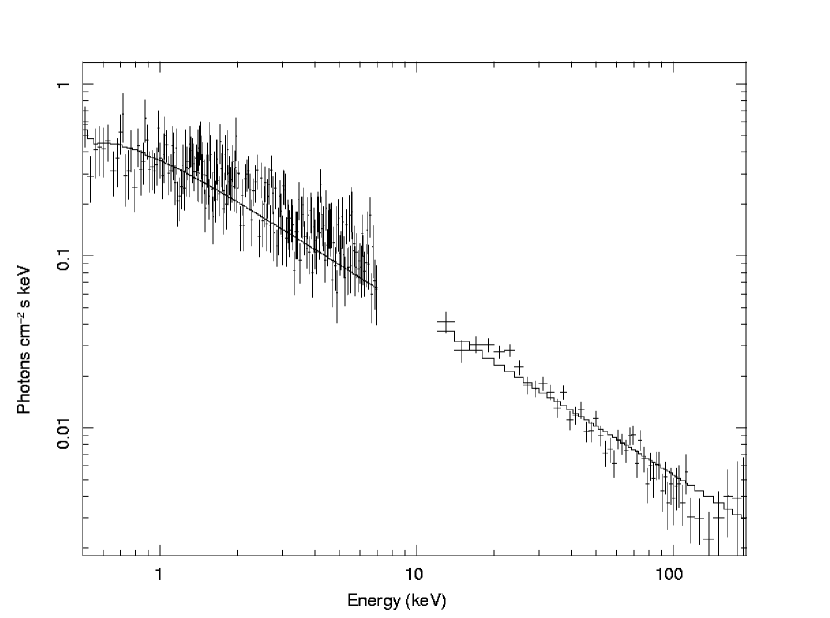
Given the long duration and bright fluence, GRB 050820A provides a rare opportunity to study contemporaneous emission in the optical, X-ray, and -ray band-passes. In Figure 1, we show the early time ( s) emission in X-rays (c) and optical (d) overlaid onto the high-energy light curve of GRB 050820A.
A look at the X-ray data in Figure 1c shows a strong correlation between the X-ray and -ray light curves. The X-ray light curve, previously in the midst of a decline, abruptly jumps in sync with the high energy emission at s (Phase 1bX). In addition to temporal similarities, the X-ray photon index at this epoch () is much harder than at any other epoch in the X-ray light curve, and similar to that derived from the BAT (). Thus motivated, we have performed a joint fit of the BAT and XRT spectra at this epoch. Unfortunately Konus-Wind had yet to trigger, and so no high-energy multi-channel spectra are available from that instrument. We find both band-passes well-fit by a single power-law with index (; 391 d.o.f.). The resulting un-folded spectrum is shown in Figure 6. We conclude the X-rays in Phase 1bX are generated by the same mechanism as the prompt emission.
It is clear from Figure 1d that, unlike in the X-ray band, there is no strong correlation between optical and -ray flux from GRB 050820A. Radical spectral evolution would be required in the optical to explain both band-passes as arising from the same emission mechanism. We consider this scenario highly unlikely and conclude that, at the very least, the dominant contribution to the optical emission in Phase 1 has a different origin than the prompt emission.
We next consider if our optical observations in Phase 1 can be explained solely in terms of the standard afterglow formulation. We have attempted to fit both a simple broken power-law (Sari et al., 1998) as well as an analytic solution for the flux density near the optical peak (Granot & Sari, 2002) to our -, -, and -band early-time data. The resulting fit quality is quite poor (; 14 d.o.f.) with the dominant contribution coming from the data in Phase 1aopt (i.e. before the peak). In spite of the poor fit, we have included the results for Phase 1aopt in Table 5 for reference.
This result is not unexpected, as Vestrand et al. (2006) have shown that contemporaneous optical imaging of GRB 050820A with the RAPTOR telescope can be well-fit as the sum of two independent components: one representing the forward shock and another proportional to the high-energy prompt emission. We attempted an analogous fit with the P60 and Konus-Wind data set. While a better fit statistic ensues, we still do not find an acceptable result (; 14 d.o.f.). We conclude that the relatively sparse time sampling of our observations, coupled with the frequent filter changes, make it impossible to verify this result.
Independent of any correlation between the prompt optical and -ray emission, we note that the decay after s is dominated by the forward shock. Unlike the bright, early-time emission seen from GRB 990123 (Akerlof et al., 1999), we see no evidence for rapidly-decaying (; Kobayashi 2000) reverse-shock emission from an optical flare.
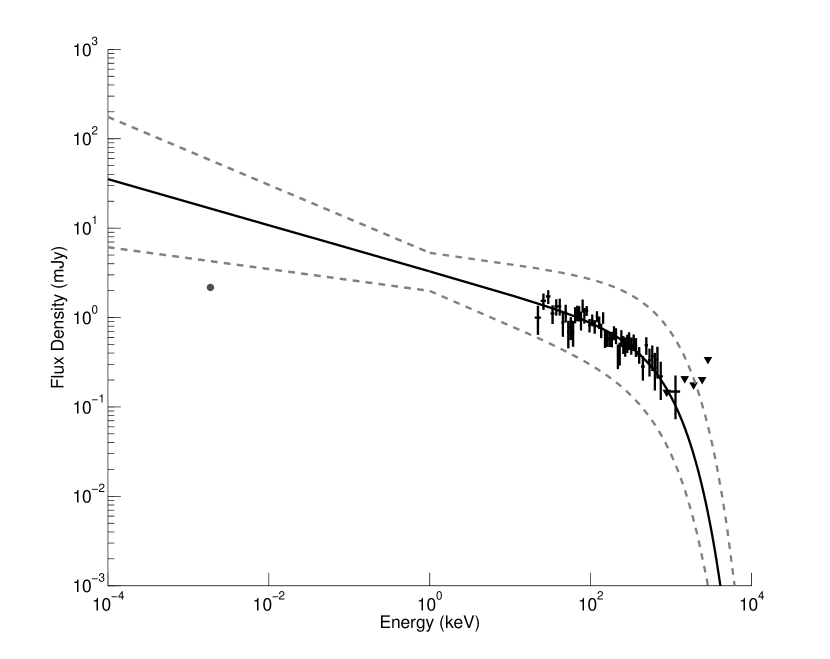
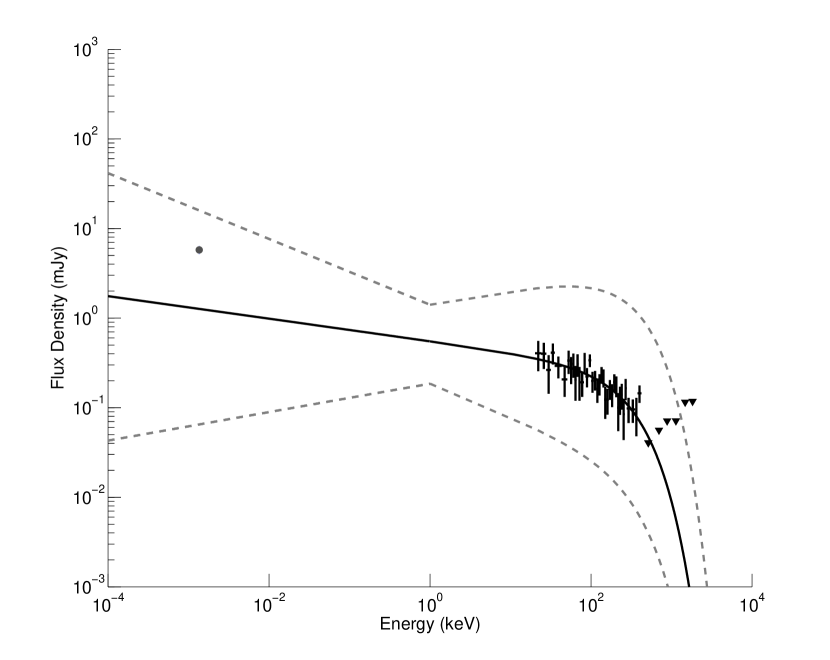
Finally, using the combination of optical and -ray data, we consider the broadband spectral energy distribution (SED) of GRB 050820A at early times. For each of the contemporaneous optical observations, we have extracted fluxes and (where possible) spectra from the corresponding Konus-Wind observations (Figure 7 and Table 6). Following the method of Vestrand et al. (2005), we have calculated the -ray-to-optical color index, , or lower limits, for each interval. The ratio varies significantly over the course of our observations. The value of in Interval 2 is consistent with that seen from GRB 041219a, while later intervals are even brighter in the optical. In fact, the optical-to--ray flux ratio in Interval 5 is over 240 times larger than that observed for GRB 050401 (Rykoff et al., 2005). Evidently a large diversity exists in the broadband SEDs of GRBs at early times.
4.3. Late-time Energy Injection
The majority of XRT light curves observed to date have exhibited a period of shallow decline () that is inconsistent with the standard afterglow formulation (Nousek et al., 2006). Two models have been invoked to explain this phase, both of which involve injecting energy into the forward shock at late times (; see e.g. Zhang et al. 2006 for a review). In the first, the central engine is active for long time periods, . The late-time emission of highly relativistic material injects additional energy into the forward shock, flattening the decay slope (Katz & Piran, 1997; Rees & Mészáros, 2000). Alternatively, towards the end of the -ray emission, the central engine may inject material with a smooth distribution of (decreasing) Lorentz factors. Slower moving material will catch up with the forward shock when it has swept up enough circum-burst material, resulting in a smooth injection of energy at late times (Rees & Meszaros, 1998; Sari & Mészáros, 2000). While both models explain the flattening of the XRT light curves, they provide different constraints on the nature of the central engine.
In the first (long-lived central engine) model, the central engine’s luminosity, , is characterized as
| (21) |
This results in the following spectral and temporal power-law indices for a constant-density medium:
| (22) | |||||
| (23) | |||||
| (24) | |||||
For a wind-like medium, the analogous results are
| (25) | |||||
| (26) | |||||
| (27) | |||||
The refreshed shock scenario is parameterized in terms of the amount of mass ejected with Lorentz factor greater than :
| (28) |
For the circum-burst profiles considered here, we can define a new variable, , such that we reproduce identical afterglow behavior to that of Equations 22-24 or Equations 25-27 by simply substituting for . is related to the mass ejection parameter by the following equations (Zhang et al., 2006):
| (ISM) | (29) | ||||
| (Wind) | (30) |
While the X-ray decay in Phase 2 is not as flat as that seen in other Swift bursts, the temporal and spectral decay indices are nonetheless inconsistent with the standard afterglow model for (Equations 12 and 20). Furthermore, the optical light curve shows a flattening during Phase 2, and is inconsistent with both the closure relations in either medium for (Equations 11 and 19). We conclude we are therefore seeing a milder version of the energy injection phase present in many Swift XRT afterglows.
For the X-ray data in Phase 2, we find an acceptable fit for the energy injection models only if . This corresponds to values of (, ) and . The optical data in Phase 2 are best fit with a constant-density medium and : () and . Both the X-ray and the optical fall in the spectral regime we would expect, providing further confidence in this interpretation.
A prediction of the energy injection hypothesis is a bright reverse shock at early times most easily visible in the radio (Sari & Mészáros, 2000). A reverse shock nicely explains the rapid decline in flux at 8.5 GHz from 1–4 d after the burst. Furthermore, the transition from a spectrum peaked around 8.5 GHz at d to an optically thin radio spectrum at d can be understood as the reverse shock peak frequency, , passing through the radio. Since , this should occur well before the forward shock peak frequency reaches the radio bands.
Distinguishing between the two theories to explain the energy injection is quite difficult, as both models can be identically parameterized. Progress in this area would require a large sample of bursts with detailed contemporaneous X-ray and optical light curves. If the refreshed shocks are due to continued engine activity, they should be correlated with the bright X-ray flares seen in some XRT afterglows. On the other hand, if the flat decay is caused by slow-moving ejecta, this behavior should be more uniform from burst to burst. Such an analysis is beyond the scope of this work.
4.4. Burst Environment and Progenitor Models
We now turn our attention to the issue of the circum-burst medium. As discussed earlier, the radial profile of the burst environment affects the temporal decay below the cooling frequency (Equations 5-7, 13-15). In particular, the closure relationships (Equations 9-11, 17-19) are sufficiently different that we should be able to distinguish between the competing models for a well-sampled event like GRB 050820A.
First we examine the X-ray data. As discussed previously (§4.3), the X-ray observations in Phase 2 require invoking mild energy injection to explain the shallower-than-expected decay for . If we assume the X-ray spectral index does not change from Phase 2 to Phase 3, then we find and satisfy the standard afterglow closure relation for (Equations 12 and 20). The corresponding values for the electron index are: , .
Unlike the X-ray observations, the optical bands typically probe frequencies below the cooling frequency, where the closure relations are different for different circum-burst media (Equations 11 and 19). We have shown already in §4.3 that the optical data in Phase 2 are better fit by a constant-density medium. We find that a constant-density medium is favored in the optical in Phase 1bopt and Phase 3 as well. The only closure relation satisfied in Phase 1bopt is for an ISM with (Equation 11). The resulting -values are , . We note that had we equated the BAT trigger time, , with the onset of the burst (), the temporal slope in Phase 1bopt would not have been consistent with any closure relation.
In Phase , we cannot meaningfully constrain the optical spectral slope. However, using the X-ray-to-optical spectral slope in this phase, , we conclude the optical data in this segment still fall below the cooling frequency. Based solely on the temporal decline then, we can rule out a wind-like medium in this phase, The corresponding electron index () would result in a divergent total energy. While this possibility has been addressed with more complicated electron energy distributions (see e.g. Dai & Cheng 2001), we consider this possibility unlikely.
Taken together, the X-ray and optical data provide a consistent picture of the forward shock expanding into a constant density medium. The late-time ( week) radio observations, however, are inconsistent with this interpretation. For a constant-density medium, the peak flux density, , should remain constant in time. This would predict, if we have correctly interpreted the optical peak as the forward shock (§4.2), a similar peak ( mJy) in the radio at days (). This is well above the VLA detection limit at this epoch, yet we only measure Jy. While the energy injection phase will delay the arrival of in the radio (), our radio limits extend out to two months after the burst. It would be very difficult, if not impossible, to delay the peak this long. Furthermore, during the energy injection phase, the peak flux increases with time (). Thus we would expect to see rising emission earlier relative to the peak, counteracting the delay of the peak radio flux.
One explanation for the lack of a bright, late-time radio afterglow is an early jet break ( day), as was invoked for GRB 990123 (Kulkarni et al., 1999). However, we find no evidence for a jet break in the optical or X-ray light curves out to at least 17 days after the burst (see §4.5).
Another possibility, invoked to explain the relatively low late-time radio flux from GRB 050904, is a high ambient density (Frail et al., 2006). In the case of GRB 050904, it was argued that the large density raised the self-absorption frequency, , above the radio observing bands. This greatly suppresses the radio flux, for the spectrum in this regime is proportional to (Eqn. 1). There is no evidence in the radio data for an optically thick spectrum, although spectral data is sparse at late times. Furthermore, broadband modeling of this event (§4.5) rules out a high ambient density for typical values of the micro-physical parameters and . We therefore consider this explanation unlikely.
Alternatively, a natural explanation for the low radio flux at late times is a wind-like medium. In a wind-like medium, the forward shock peak flux density declines in time as . The decreasing peak flux counteracts the rising synchrotron emission, suppressing any late-time radio data. This is of course inconsistent with our X-ray and optical data, which strongly favor a constant-density medium. One can imagine a scenario in which the environment near the burst (the regime sampled predominantly by the X-ray and optical data) is approximately constant in density, while the outer regions (sampled by the radio at later times) have a wind-like profile. However, without a physical justification for such a density profile, this remains little more than speculation. The lack of a bright radio afterglow remains a puzzling aspect of GRB 050820A.
4.5. Geometry and Energetics
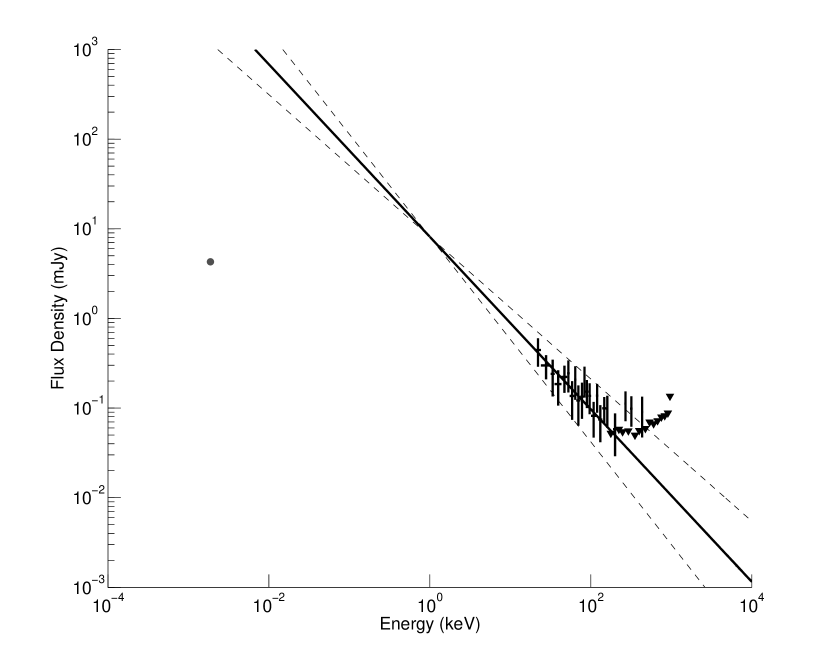
Using the high-energy fluence derived from Konus-Wind satellite (§2.1.2), we calculate the total isotropic energy release in the prompt emission was ergs (assuming a redshift of ; Prochaska et al. 2005; Ledoux et al. 2005). This makes GRB 050820A one of the most energetic events (in terms of ) for which a redshift has been measured (Amati, 2006).
However, only a fraction of the explosion energy is converted into prompt emission via internal dissipation. The rest remains in the kinetic energy of the outflow, powering the forward shock and hence the afterglow. We can estimate the kinetic energy of the afterglow () by examining the the X-ray emission at hr (Freedman & Waxman, 2001). At this point, the X-rays should be above the cooling frequency. The flux density is then independent of ambient density and only weakly dependent on . A joint fit of the Phase 3 optical and X-ray data (after the energy injection has stopped and the system has returned to adiabatic expansion) constrains the electron energy index: . If we take typical values for () and () (Yost et al., 2003), we find that .
For an accurate accounting of the total energy emitted by this event, however, we must determine the degree of collimation of the emission. We therefore examine all the temporal breaks in the optical and X-ray light curves to determine which one (if any) shows an achromatic steepening to the decay expected from a jet (Sari et al., 1999). The only plausible candidate is the transition from Phase 3 to 4 in the optical light curve. The steepening here is achromatic (i.e. it is seen in all three Hubble Space Telescope filters) and much too large to be explained solely by the cooling frequency passing through the optical bands (although this may have occured as well). Any contribution from an underlying host galaxy would only further steepen the decay in Phase 4.
With only one observation, it is impossible to constrain the post-break decay index. Instead, we assume the post-break decay has a power-law index (see above). We then find d. This result is consistent with our X-ray observations, which put a lower limit on the jet break time of d.
We note that the jet break time we have inferred for GRB 050820A is extremely large. In the host galaxy reference frame, the break occurs at , a factor of three larger than any jet break seen in the pre-Swift era (Zeh et al., 2006). In this respect, too, GRB 050820A is a strong outlier.
To convert the jet break times to a range of opening angles, we use the relation (Sari et al., 1999):
| (31) |
Here is the fraction of the total energy converted to prompt -ray emission. The only remaining unknown in Equation 31 is the ambient density, . Using the ratio of the X-ray and optical data, as well as the canonical values of and , we find the density of the burst must be low: cm-3. Afterglow modeling of the late-time optical and X-ray data (Phase 3, after any continued energy injection has ceased and the shock expands adiabatically) using the technique of Yost et al. (2003) confirms this result: .
Combining the above results, we find the opening angle is constrained to fall between between 6.8, corresponding to a beaming factor . While the opening angle is large for a long-soft burst, there are several comparable events in the pre-Swift sample (Zeh et al., 2006). The total collimation-corrected energy emitted in -rays () from GRB 050820A is therefore ergs. The corresponding value for the blast-wave energy () is ergs.
Ghirlanda et al. (2004a) have demonstrated an empirical relation between and the peak energy of the prompt emission spectrum in the GRB rest frame (). GRB 050820A is more energetic than any of the 37 bursts considered in their sample (in terms of ), and therefore proves an interesting test case for the so-called Ghirlanda relation. Using our calculated value of , Ghirlanda predicts MeV. This is marginally consistent with the actual value of MeV derived from the Konus-Wind dataset.
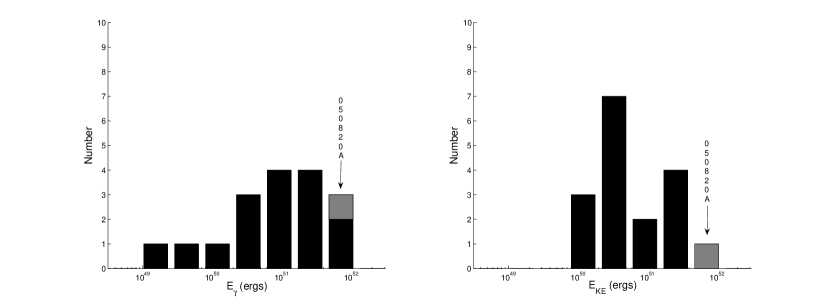
In Figure 8, we plot a histogram of and for the 15 long-soft cosmological bursts for which both quantities have been derived. We have not included the most nearby events (GRB 980425, GRB 031203, and GRB 060218) in our analysis, as these events released significantly less energy than the typical cosmological GRB (Soderberg et al., 2006). Soderberg et al. (2004) have shown that, with the exception of the most nearby events, the sum of and is clustered around ergs. GRB 050820A is clearly an over-energetic exception, an order of magnitude more energetic than this sample. In fact, it would require the direct conversion of M⊙ (with 100% efficiency) to release this much energy.
Finally, it is important to consider how robust our estimates of , , and are given that the standard afterglow model fails to explain the broadband behavior of GRB 050820A. We note that the opening angle is relatively insensitive to both variables (Eqn. 31); factors of order unity will be greatly reduced by the exponent. It is difficult to conceive of a long-soft GRB environment where the ambient density is less than , and high densities would only increase the opening angle and thus the energy release.
5. Conclusion
GRB 050820A joins a select sample of events with simultaneous observations in the -ray and optical bands, and an even smaller group with contemporaneous X-ray observations as well. Such events have led to fundamental advances in our understanding of GRBs, including the discovery of a reverse-shock optical flash from GRB 990123 (Akerlof et al., 1999) and possibly from GRB 050904 (Boër et al., 2006). The early-time optical emission from GRB 041219A also showed a bright optical flash, but the rise was correlated with an accompanying peak of -ray emission, suggesting a common origin for the two components (Vestrand et al., 2005).
The early behavior of GRB 050820A is unlike either of these events. Vestrand et al. (2006) have shown the contemporaneous optical emission is well described as the sum of two components: one proportional to the prompt -ray emission and one smoothly varying forward shock term. While the -ray component is important for s, the optical peak at s is dominated by emission from the external shock region. Furthermore, the post-peak decay rate is inconsistent with reverse-shock emission. Instead we interpret this as the forward shock peak frequency passing through the optical bands. This is not unlike what was seen in the optical for GRB 060124 (Romano et al., 2006), although the time resolution in the prompt phase was much poorer than for this burst. The contemporaneous optical light curves of GRB 050319 (Quimby et al., 2006; Woźniak et al., 2005) and GRB 050401 (Rykoff et al., 2005) did not show this peak phase, but extrapolations to late-times were consistent with the adiabatic expansion of a forward shock. Another different behavior was seen in the early optical light curve of GRB 050801, which showed an extended plateau phase correlated with the X-ray emission, hinting at continued energy injection from a central engine refreshing the external shocks (Rykoff et al., 2006).
The contemporaneous X-ray emission, on the other hand, is the low-energy tail of the prompt emission. This behavior was also seen for GRB 060124 (Romano et al., 2006) and has been hinted at in the rapid decline in early X-ray light curves attributed to high-latitude emission (Liang et al., 2006), as well as the bright X-ray flares seen in many XRT light curves (Burrows et al., 2005b). It is clear then, that, in marked contrast to the X-ray emission, contemporaneous optical emission exhibits a large diversity in behavior. Unfortunately the physical mechanism behind this diversity remains to be explained.
The issue of burst geometry is a particularly interesting one in the Swift era. The steep post-break decay slope, seen simultaneously in multiple filters, makes GRB 050820A one of the most convincing examples of a beamed event in the Swift sample. The X-ray afterglow, however, is too faint at late times to provide broadband confirmation. In fact, very few Swift bursts, including those, like GRB 050408 (Foley et al., 2006), that have been followed for months, show signs of a jet break in the XRT light curve (Nousek et al., 2006).
Typical jet breaks in pre-Swift bursts occurred on time-scales of several days (Zeh et al., 2006). Perna et al. (2003) predicted that Swift would detect bursts with wider opening angles than previous missions due to the increased sensitivity of the BAT. However, not a single Swift afterglow has shown a convincing jet-break-like transition in multiple band-passes (candidates include GRB 050525A and GRB 050801; see Panaitescu et al. 2006 and references therein for a more thorough discussion). While it may be that most jet breaks, like GRB 050820A, occur at late times, beyond the sensitivity of the XRT and most ground-based facilities, this is nonetheless troubling. On the one hand, few if any X-ray jet breaks were seen in pre-Swift bursts; all collimation angles were determined from optical (and sometimes radio) light curves. Conversely, given the large number of well-sampled XRT light curves, and the fact that such fundamental results for GRB cosmology as the Ghirlanda relation rest on our picture of GRBs as a-spherical events, this is clearly a matter that merits further investigation.
One consequence of the large opening angle associated with GRB 050820A is a correspondingly large burst and afterglow energy. In fact, of all the bursts compiled in the Ghirlanda et al. (2004b) sample, GRB 050820A has the largest prompt energy release. And unlike GRB 990123 (Panaitescu & Kumar, 2001), this large -ray energy was accompanied by a correspondingly large kinetic energy imparted to the afterglow. The only comparable event for which such energies could be determined was the high-redshift GRB 050904, which released a total energy of ergs (Tagliaferri et al., 2005; Frail et al., 2006). Given the large -ray fluence, similar events should have been easily detected by both Swift and previous GRB missions. And given the bright optical afterglow and the late jet-break, such events are strongly favored for ground-based follow-up (i.e. redshift determination). The lack of a large sample of such events means they must be relatively rare in the universe.
Like many other Swift GRBs, the X-ray light curve of GRB 050820A exhibits a phase of shallow decay incompatible with the standard forward shock model (Nousek et al., 2006). GRB 050820A is relatively unique, however, in that this epoch is also well-sampled in the optical. The seemingly simultaneous breaks in the optical light curve bolster the commonly-held belief that this phase is caused by some form of refreshed shocks (Zhang et al., 2006). Coupled with the large gap between the precursor and the bulk of the prompt emission, the late-time energy injection poses fundamental challenges to any central engine model.
Finally, we return to the question of the radio afterglow. Radio observations typically probe low-Lorentz factor ejecta () at large distances from the central engine ( cm). The forward shock peak frequency reaches the radio much later than the optical or X-ray bands. Thus, radio emission is usually visible at later times than optical or X-ray emission, and is well-suited to study afterglows when the emission is isotropic (i.e. after the jet break) or even in some cases when the ejecta has slowed to Newtonian expansion (Berger et al., 2004). For this reason, late-time radio observations are considered the most accurate method for model-independent calorimetry. For GRB 050820A, this paradigm has broken down. The burst had a bright optical and X-ray afterglow, but weak emission in the radio. It is hoped that further studies of such energetic GRBs in the Swift era will help to elucidate some of these puzzles.
References
- Akerlof et al. (1999) Akerlof, C. et al. 1999, Nature, 398, 400
- Amati (2006) Amati, L. 2006, preprint (astro-ph/0601553)
- Aptekar et al. (1995) Aptekar, R. L. et al. 1995, Space Science Reviews, 71, 265
- Aslan et al. (2005) Aslan, Z. et al. 2005, GRB Coordinates Network, 3896, 1
- Band et al. (1993) Band, D. et al. 1993, ApJ, 413, 281
- Barthelmy et al. (2005) Barthelmy, S. D. et al. 2005, Space Science Reviews, 120, 143
- Berger et al. (2001) Berger, E. et al. 2001, ApJ, 556, 556
- Berger et al. (2003a) Berger, E., Kulkarni, S. R., and Frail, D. A. 2003a, ApJ, 590, 379
- Berger et al. (2004) —. 2004, ApJ, 612, 966
- Berger et al. (2003b) Berger, E. et al. 2003b, Nature, 426, 154
- Berger et al. (2005) —. 2005, Nature, 438, 988
- Bikmaev et al. (2005) Bikmaev, I. et al. 2005, GRB Coordinates Network, 3853, 1
- Boër et al. (2006) Boër, M., Atteia, J. L., Damerdji, Y., Gendre, B., Klotz, A., and Stratta, G. 2006, ApJ, 638, L71
- Briggs et al. (1999) Briggs, M. S. et al. 1999, ApJ, 524, 82
- Burrows et al. (2005a) Burrows, D. N. et al. 2005a, Space Science Reviews, 120, 165
- Burrows et al. (2005b) —. 2005b, Science, 309, 1833
- Cenko & Fox (2005) Cenko, S. B. and Fox, D. B. 2005, GRB Circular Network, 3834, 1
- Chester et al. (2005) Chester, M., Page, M., Roming, P., Marshall, F., Boyd, P., Angelini, L., Greiner, J., and Gehrels, N. 2005, GRB Circular Network, 3838, 1
- Chevalier & Li (2000) Chevalier, R. A. and Li, Z.-Y. 2000, ApJ, 536, 195
- Chevalier et al. (2004) Chevalier, R. A., Li, Z.-Y., and Fransson, C. 2004, ApJ, 606, 369
- Cummings et al. (2005a) Cummings, J. et al. 2005a, GRB Circular Network, 3835, 1
- Cummings et al. (2005b) —. 2005b, GRB Circular Network, 3858, 1
- Cusumano et al. (2006) Cusumano, G. et al. 2006, Nature, 440, 164
- Dai & Cheng (2001) Dai, Z. G. and Cheng, K. S. 2001, ApJ, 558, L109
- Dai et al. (2004) Dai, Z. G., Liang, E. W., and Xu, D. 2004, ApJ, 612, L101
- Dickey & Lockman (1990) Dickey, J. M. and Lockman, F. J. 1990, ARA&A, 28, 215
- Falcone et al. (2006) Falcone, A. D. et al. 2006, ApJ, 641, 1010
- Firmani et al. (2006) Firmani, C., Avila-Reese, V., Ghisellini, G., and Ghirlanda, G. 2006, preprint (astro-ph/0605430)
- Foley et al. (2006) Foley, R. J. et al. 2006, ApJ, 645, 450
- Ford et al. (1995) Ford, L. A. et al. 1995, ApJ, 439, 307
- Fox & Cenko (2005) Fox, D. B. and Cenko, S. B. 2005, GRB Circular Network, 3829, 1
- Frail et al. (2006) Frail, D. A. et al. 2006, ApJ, 646, L99
- Frail et al. (1997) Frail, D. A., Kulkarni, S. R., Nicastro, S. R., Feroci, M., and Taylor, G. B. 1997, Nature, 389, 261
- Frail et al. (2001) Frail, D. A. et al. 2001, ApJ, 562, L55
- Freedman & Waxman (2001) Freedman, D. L. and Waxman, E. 2001, ApJ, 547, 922
- Friedman & Bloom (2005) Friedman, A. S. and Bloom, J. S. 2005, ApJ, 627, 1
- Frontera et al. (2000) Frontera, F. et al. 2000, ApJS, 127, 59
- Fruchter & Hook (2002) Fruchter, A. S. and Hook, R. N. 2002, PASP, 114, 144
- Fukugita et al. (1995) Fukugita, M., Shimasaku, K., and Ichikawa, T. 1995, PASP, 107, 945
- Gal-Yam et al. (2004) Gal-Yam, A. et al. 2004, ApJ, 609, L59
- Gehrels et al. (2004) Gehrels, N. et al. 2004, ApJ, 611, 1005
- Gehrels et al. (2005) —. 2005, Nature, 437, 851
- Ghirlanda et al. (2004a) Ghirlanda, G., Ghisellini, G., and Lazzati, D. 2004a, ApJ, 616, 331
- Ghirlanda et al. (2004b) Ghirlanda, G., Ghisellini, G., Lazzati, D., and Firmani, C. 2004b, ApJ, 613, L13
- Goodman (1997) Goodman, J. 1997, New Astronomy, 2, 449
- Granot & Sari (2002) Granot, J. and Sari, R. 2002, ApJ, 568, 820
- Haislip et al. (2006) Haislip, J. B. et al. 2006, Nature, 440, 181
- Henden (2005) Henden, A. 2005, GRB Circular Network, 3845, 1
- Kann et al. (2006) Kann, D. A., Klose, S., and Zeh, A. 2006, ApJ, 641, 993
- Katz & Piran (1997) Katz, J. I. and Piran, T. 1997, ApJ, 490, 772
- Kent (1985) Kent, S. M. 1985, PASP, 97, 165
- Khamitov et al. (2005) Khamitov, I. et al. 2005, GRB Coordinates Network, 3864, 1
- Kobayashi (2000) Kobayashi, S. 2000, ApJ, 545, 807
- Kulkarni et al. (1999) Kulkarni, S. R. et al. 1999, ApJ, 522, L97
- Kumar & Panaitescu (2000) Kumar, P. and Panaitescu, A. 2000, ApJ, 541, L51
- Lazzati (2005) Lazzati, D. 2005, MNRAS, 357, 722
- Ledoux et al. (2005) Ledoux, C. et al. 2005, GRB Coordinates Network, 3860, 1
- Li et al. (2006) Li, W., Jha, S., Filippenko, A. V., Bloom, J. S., Pooley, D., Foley, R. J., and Perley, D. A. 2006, PASP, 118, 37
- Liang et al. (2006) Liang, E. W. et al. 2006, ApJ, 646, 351
- Lyutikov & Blandford (2003) Lyutikov, M. and Blandford, R. 2003, preprint (astro-ph/0312347)
- Lyutikov & Usov (2000) Lyutikov, M. and Usov, V. V. 2000, ApJ, 543, L129
- MacLeod & Nysewander (2005) MacLeod, C. and Nysewander, M. 2005, GRB Coordinates Network, 3863, 1
- McBreen et al. (2006) McBreen, S., Hanlon, L., McGlynn, S., McBreen, B., Foley, S., Preece, R., von Kienlin, A., and Williams, O. R. 2006, preprint (astro-ph/0604455)
- Mészáros & Rees (2000) Mészáros, P. and Rees, M. J. 2000, ApJ, 530, 292
- Metzger et al. (1997) Metzger, M. R., Djorgovski, S. G., Kulkarni, S. R., Steidel, C. C., Adelberger, K. L., Frail, D. A., Costa, E., and Frontera, F. 1997, Nature, 387, 878
- Nousek et al. (2006) Nousek, J. A. et al. 2006, ApJ, 642, 389
- O’Brien et al. (2006) O’Brien, P. T. et al. 2006, preprint (astro-ph/0601125)
- Paczynski (1986) Paczynski, B. 1986, ApJ, 308, L43
- Page et al. (2005a) Page, K. L., Beardmore, A. P., Goad, M. R., Kennea, J. A., Burrows, D. N., Marshall, F., and Smale, A. 2005a, GRB Coordinates Network, 3837, 1
- Page et al. (2005b) Page, M. et al. 2005b, GRB Circular Network, 3830, 1
- Pal’shin & Frederiks (2005) Pal’shin, V. and Frederiks, D. 2005, GRB Circular Network, 3852, 1
- Panaitescu & Kumar (2001) Panaitescu, A. and Kumar, P. 2001, ApJ, 554, 667
- Panaitescu & Kumar (2002) —. 2002, ApJ, 571, 779
- Panaitescu et al. (2006) Panaitescu, A., Mészáros, P., Burrows, D., Nousek, J., Gehrels, N., O’Brien, P., and Willingale, R. 2006, MNRAS, 369, 2059
- Pei (1992) Pei, Y. C. 1992, ApJ, 395, 130
- Perna et al. (2003) Perna, R., Sari, R., and Frail, D. 2003, ApJ, 594, 379
- Piran (2005) Piran, T. 2005, Reviews of Modern Physics, 76, 1143
- Price et al. (2002) Price, P. A. et al. 2002, ApJ, 572, L51
- Prochaska et al. (2005) Prochaska, J. X., Bloom, J. S., Wright, J. T., Butler, R. P., Chen, H. W., Vogt, S. S., and Marcy, G. W. 2005, GRB Circular Network, 3833, 1
- Quimby et al. (2006) Quimby, R. M. et al. 2006, ApJ, 640, 402
- Ramirez-Ruiz et al. (2002) Ramirez-Ruiz, E., MacFadyen, A. I., and Lazzati, D. 2002, MNRAS, 331, 197
- Rees & Meszaros (1998) Rees, M. J. and Meszaros, P. 1998, ApJ, 496, L1+
- Rees & Mészáros (2000) Rees, M. J. and Mészáros, P. 2000, ApJ, 545, L73
- Rhoads (1999) Rhoads, J. E. 1999, ApJ, 525, 737
- Romano et al. (2006) Romano, P. et al. 2006, preprint (astro-ph/0602497)
- Roming et al. (2005) Roming, P. W. A. et al. 2005, Space Science Reviews, 120, 95
- Rybicki & Lightman (1979) Rybicki, G. and Lightman, A. 1979, Radiative Processes in Astrophysics (New York, New York: Wiley Interscience)
- Rykoff et al. (2006) Rykoff, E. S. et al. 2006, ApJ, 638, L5
- Rykoff et al. (2005) —. 2005, ApJ, 631, L121
- Sari & Mészáros (2000) Sari, R. and Mészáros, P. 2000, ApJ, 535, L33
- Sari & Piran (1999a) Sari, R. and Piran, T. 1999a, ApJ, 517, L109
- Sari & Piran (1999b) —. 1999b, ApJ, 520, 641
- Sari et al. (1999) Sari, R., Piran, T., and Halpern, J. P. 1999, ApJ, 519, L17
- Sari et al. (1998) Sari, R., Piran, T., and Narayan, R. 1998, ApJ, 497, L17+
- Schlegel et al. (1998) Schlegel, D. J., Finkbeiner, D. P., and Davis, M. 1998, ApJ, 500, 525
- Sirianni et al. (2005) Sirianni, M. et al. 2005, PASP, 117, 1049
- Skrutskie et al. (2006) Skrutskie, M. F. et al. 2006, AJ, 131, 1163
- Soderberg et al. (2004) Soderberg, A. M. et al. 2004, Nature, 430, 648
- Soderberg et al. (2006) —. 2006, preprint (astro-ph/0604389)
- Tagliaferri et al. (2005) Tagliaferri, G. et al. 2005, A&A, 443, L1
- Thuan & Gunn (1976) Thuan, T. X. and Gunn, J. E. 1976, PASP, 88, 543
- Tody (1986) Tody, D. 1986, in Instrumentation in astronomy VI; Proceedings of the Meeting, Tucson, AZ, Mar. 4-8, 1986. Part 2 (A87-36376 15-35). Bellingham, WA, Society of Photo-Optical Instrumentation Engineers, 1986, p. 733., ed. D. L. Crawford, 733–+
- Vaughan et al. (2006) Vaughan, S. et al. 2006, ApJ, 638, 920
- Vestrand et al. (2005) Vestrand, W. T. et al. 2005, Nature, 435, 178
- Vestrand et al. (2006) —. 2006, Nature, 442, 172
- Waxman & Mészáros (2003) Waxman, E. and Mészáros, P. 2003, ApJ, 584, 390
- Woosley (1993) Woosley, S. E. 1993, ApJ, 405, 273
- Woźniak et al. (2005) Woźniak, P. R., Vestrand, W. T., Wren, J. A., White, R. R., Evans, S. M., and Casperson, D. 2005, ApJ, 627, L13
- Wren et al. (2005) Wren, J., Vestrand, W. T., Wozniak, P., Evans, S., and White, R. 2005, GRB Circular Network, 3836, 1
- Yost et al. (2003) Yost, S. A., Harrison, F. A., Sari, R., and Frail, D. A. 2003, ApJ, 597, 459
- Zeh et al. (2006) Zeh, A., Klose, S., and Kann, D. A. 2006, ApJ, 637, 889
- Zhang et al. (2006) Zhang, B., Fan, Y. Z., Dyks, J., Kobayashi, S., Mészáros, P., Burrows, D. N., Nousek, J. A., and Gehrels, N. 2006, ApJ, 642, 354
| Mean Observation Date | Duration | Spectral Index () | 2–10 keV Flux | |
|---|---|---|---|---|
| (2005 UT) | (s) | (s) | ( ergs cm-2 s-1) | |
| Aug 20 06:36:25 | 92.0 | 10.0 | 0.90 | |
| Aug 20 06:36:35 | 102.0 | 10.0 | ||
| Aug 20 06:36:45 | 112.0 | 10.0 | ||
| Aug 20 06:36:55 | 122.0 | 10.0 | ||
| Aug 20 06:37:05 | 132.0 | 10.0 | ||
| Aug 20 06:37:15 | 142.0 | 10.0 | ||
| Aug 20 06:37:25 | 152.0 | 10.0 | ||
| Aug 20 06:37:35 | 162.0 | 10.0 | ||
| Aug 20 06:37:45 | 172.0 | 10.0 | ||
| Aug 20 06:37:55 | 182.0 | 10.0 | ||
| Aug 20 06:38:05 | 192.0 | 10.0 | ||
| Aug 20 06:38:15 | 202.0 | 10.0 | ||
| Aug 20 06:38:25 | 212.0 | 10.0 | ||
| Aug 20 06:38:35 | 222.0 | 10.0 | -0.10 | |
| Aug 20 06:38:45 | 232.0 | 10.0 | ||
| Aug 20 06:38:55 | 242.0 | 10.0 | ||
| Aug 20 06:39:05 | 252.0 | 10.0 | ||
| Aug 20 07:56:43 | 250.0 | 1.20 | ||
| Aug 20 08:00:53 | 250.0 | |||
| Aug 20 08:05:03 | 250.0 | |||
| Aug 20 08:09:13 | 250.0 | |||
| Aug 20 08:13:23 | 250.0 | |||
| Aug 20 11:41:43 | ||||
| Aug 20 12:23:23 | ||||
| Aug 20 13:05:03 | ||||
| Aug 20 14:28:23 | ||||
| Aug 20 15:10:03 | ||||
| Aug 20 15:51:43 | ||||
| Aug 20 16:33:23 | ||||
| Aug 20 17:15:03 | ||||
| Aug 20 17:56:43 | ||||
| Aug 20 19:20:03 | ||||
| Aug 21 15:48:01 | ||||
| Aug 21 18:34:41 | ||||
| Aug 21 21:21:21 | ||||
| Aug 22 00:08:01 | ||||
| Aug 22 02:54:41 | ||||
| Aug 23 14:30:22 | ||||
| Aug 23 17:17:02 | ||||
| Aug 24 18:02:47 | ||||
| Aug 25 03:46:07 | ||||
| Aug 27 19:38:46 | ||||
| Aug 29 06:22:06 | ||||
| Sep 04 15:45:23 | ||||
| Sep 05 19:32:03 | ||||
| Sep 06 23:18:43 |
Note. — The four Phases of the X-ray light curve are delineated by horizontal lines (see §3.1 for further details). We assumed the spectral index was constant in each Phase to convert count rates to the flux values shown here. We also assumed the spectral index remained constant from Phase 2 to Phase 3. All errors quoted are at the level.
| Mean Observation Date | Telescope | Filter | Exposure Time | MagnitudeaaErrors quoted are 1 photometric and instrumental errors summed in quadrature. Galactic extinction (; Schlegel et al. 1998) has been incorporated in the reported magnitudes. | Reference | |
|---|---|---|---|---|---|---|
| (2005 UT) | (s) | (s) | (Vega) | |||
| Aug 20 08:14:47 | UVOT | 693.3 | 18.12 0.13 | * | ||
| Aug 20 12:49:02 | UVOT | 899.8 | 19.11 0.14 | * | ||
| Aug 20 16:01:58 | UVOT | 899.8 | 19.40 0.14 | * | ||
| Aug 20 19:14:54 | UVOT | 899.8 | 19.66 0.15 | * | ||
| Aug 20 22:59:51 | UVOT | 392.3 | 19.70 0.18 | * | ||
| Aug 20 09:36:06 | UVOT | 899.8 | 18.79 0.16 | * | ||
| Aug 20 13:04:10 | UVOT | 899.8 | 19.24 0.15 | * | ||
| Aug 20 16:17:05 | UVOT | 897.3 | 19.74 0.16 | * | ||
| Aug 20 19:30:02 | UVOT | 899.8 | 19.87 0.16 | * | ||
| Aug 21 23:30:41 | RTT150 | 1800.0 | 21.28 0.06 | 1 | ||
| Aug 22 22:58:17 | RTT150 | 7860.0 | 22.05 0.06 | 2 | ||
| Aug 23 22:09:05 | RTT150 | 5400.0 | 22.38 0.08 | 2 | ||
| Aug 20 07:01:53 | P60 | 120.0 | 16.27 0.04 | * | ||
| Aug 20 07:12:35 | P60 | 120.0 | 16.65 0.04 | * | ||
| Aug 20 07:23:24 | P60 | 120.0 | 16.92 0.05 | * | ||
| Aug 20 08:04:47 | P60 | 360.0 | 17.59 0.05 | * | ||
| Aug 20 08:29:42 | P60 | 360.0 | 17.87 0.06 | * | ||
| Aug 20 08:54:50 | P60 | 360.0 | 18.11 0.06 | * | ||
| Aug 20 09:33:18 | P60 | 720.0 | 18.29 0.06 | * | ||
| Aug 20 10:43:25 | P60 | 720.0 | 18.36 0.06 | * | ||
| Aug 20 11:39:32 | P60 | 720.0 | 18.59 0.09 | * | ||
| Aug 20 06:36:58 | 125.0 | UVOT | 89.0 | 18.18 0.20 | * | |
| Aug 20 07:52:58 | UVOT | 99.8 | 17.20 0.13 | * | ||
| Aug 20 10:04:28 | UVOT | 337.0 | 18.16 0.12 | * | ||
| Aug 20 11:12:34 | UVOT | 899.8 | 18.39 0.09 | * | ||
| Aug 20 14:25:30 | UVOT | 899.8 | 18.86 0.11 | * | ||
| Aug 20 17:38:26 | UVOT | 899.8 | 19.35 0.12 | * | ||
| Aug 20 21:03:50 | UVOT | 899.8 | 19.14 0.11 | * | ||
| Aug 21 16:09:34 | UVOT | 899.8 | 20.24 0.19 | * | ||
| Aug 21 19:22:30 | UVOT | 899.8 | 20.40 0.22 | * | ||
| Aug 20 06:38:49 | 236.0 | P60 | 60.0 | 15.39 0.04 | * | |
| Aug 20 06:43:31 | 517.0 | P60 | 60.0 | 14.65 0.02 | * | |
| Aug 20 06:48:25 | 812.0 | P60 | 60.0 | 15.06 0.03 | * | |
| Aug 20 06:53:59 | P60 | 120.0 | 15.42 0.02 | * | ||
| Aug 20 07:04:34 | P60 | 120.0 | 16.05 0.03 | * | ||
| Aug 20 07:15:19 | P60 | 120.0 | 16.39 0.02 | * | ||
| Aug 20 07:32:13 | P60 | 360.0 | 16.77 0.02 | * | ||
| Aug 20 08:12:58 | P60 | 360.0 | 17.32 0.04 | * | ||
| Aug 20 08:38:05 | P60 | 360.0 | 17.48 0.04 | * | ||
| Aug 20 08:46:53 | PROMPT-5 | 660.0 | 17.52 0.09 | 3 | ||
| Aug 20 09:03:19 | P60 | 360.0 | 17.69 0.04 | * | ||
| Aug 20 09:28:50 | P60 | 360.0 | 17.85 0.04 | * | ||
| Aug 20 10:00:44 | P60 | 360.0 | 17.78 0.04 | * | ||
| Aug 20 10:38:59 | P60 | 360.0 | 17.97 0.04 | * | ||
| Aug 20 11:05:54 | P60 | 360.0 | 18.01 0.04 | * | ||
| Aug 20 11:33:14 | P60 | 360.0 | 18.03 0.04 | * | ||
| Aug 20 12:02:31 | P60 | 360.0 | 18.16 0.05 | * | ||
| Aug 21 00:37:53 | RTT150 | 900.0 | 19.36 0.01 | 1 | ||
| Aug 21 04:16:53 | PROMPT-5 | 5370.0 | 19.94 0.31 | 3 | ||
| Aug 22 00:00:05 | RTT150 | 1800.0 | 20.26 0.05 | 1 | ||
| Aug 22 07:17:03 | P60 | 6840.0 | 20.51 0.11 | * | ||
| Aug 22 23:00:41 | RTT150 | 3900.0 | 20.90 0.03 | 2 | ||
| Aug 23 08:06:11 | P60 | 8400.0 | 20.89 0.10 | * | ||
| Aug 23 22:18:05 | RTT150 | 2700.0 | 21.18 0.04 | 2 | ||
| Aug 24 08:46:32 | P60 | 8400.0 | 21.22 0.11 | * | ||
| Aug 25 09:33:11 | P60 | 2880.0 | 21.34 0.13 | * | ||
| Aug 26 05:05:39 | HET | 600.0 | 21.57 0.08 | * | ||
| Aug 26 08:28:20 | P60 | 3600.0 | 21.64 0.12 | * | ||
| Aug 27 08:37:13 | P60 | 4800.0 | 21.80 0.12 | * | ||
| Aug 27 22:49:53 | RTT150 | 1500.0 | 22.02 0.10 | 4 | ||
| Sep 26 01:39:38 | HST | 800.0 | 24.59 0.08 | * | ||
| 24.55 0.08 | * | |||||
| Aug 20 06:40:21 | 328.0 | P60 | 60.0 | 14.91 0.02 | * | |
| Aug 20 06:45:19 | 626.0 | P60 | 60.0 | 14.42 0.01 | * | |
| Aug 20 06:50:06 | 913.0 | P60 | 60.0 | 14.78 0.01 | * | |
| Aug 20 06:56:37 | P60 | 120.0 | 15.24 0.02 | * | ||
| Aug 20 07:07:15 | P60 | 120.0 | 15.74 0.02 | * | ||
| Aug 20 07:18:03 | P60 | 120.0 | 16.07 0.02 | * | ||
| Aug 20 07:40:11 | P60 | 360.0 | 16.54 0.03 | * | ||
| Aug 20 08:21:15 | P60 | 360.0 | 17.02 0.05 | * | ||
| Aug 20 08:46:26 | P60 | 360.0 | 17.22 0.04 | * | ||
| Aug 20 08:46:53 | PROMPT-3 | 1560.0 | 17.31 0.08 | 3 | ||
| Aug 20 09:11:47 | P60 | 360.0 | 17.23 0.05 | * | ||
| Aug 20 09:37:27 | P60 | 360.0 | 17.34 0.03 | * | ||
| Aug 20 10:21:01 | P60 | 360.0 | 17.48 0.04 | * | ||
| Aug 20 10:47:55 | P60 | 360.0 | 17.68 0.04 | * | ||
| Aug 20 11:14:54 | P60 | 360.0 | 17.71 0.05 | * | ||
| Aug 20 11:42:22 | P60 | 360.0 | 17.72 0.04 | * | ||
| Aug 21 04:04:53 | PROMPT-3 | 5440.0 | 18.33 0.11 | 3 | ||
| Aug 22 00:07:53 | RTT150 | 1800.0 | 19.74 0.07 | 1 | ||
| Aug 22 07:25:05 | P60 | 6840.0 | 19.97 0.12 | * | ||
| Aug 22 23:06:41 | RTT150 | 3900.0 | 20.37 0.05 | 2 | ||
| Aug 23 08:22:42 | P60 | 7560.0 | 20.48 0.12 | * | ||
| Aug 23 22:24:05 | RTT150 | 2700.0 | 20.78 0.09 | 2 | ||
| Aug 24 09:11:48 | P60 | 8400.0 | 20.59 0.11 | * | ||
| Aug 25 10:44:39 | P60 | 2400.0 | 21.02 0.15 | * | ||
| Aug 26 04:49:33 | HET | 1200.0 | 21.25 0.10 | * | ||
| Aug 26 09:27:24 | P60 | 4800.0 | 21.17 0.14 | * | ||
| Aug 27 08:34:02 | P60 | 4440.0 | 21.30 0.13 | * | ||
| Sep 26 02:01:58 | HST | 800.0 | 24.32 0.09 | * | ||
| 24.27 0.09 | * | |||||
| Aug 20 06:41:50 | 417.0 | P60 | 60.0 | 13.93 0.11 | * | |
| Aug 20 06:46:45 | 712.0 | P60 | 60.0 | 14.27 0.14 | * | |
| Aug 20 06:51:50 | P60 | 60.0 | 14.62 0.21 | * | ||
| Aug 20 06:59:16 | P60 | 120.0 | 15.02 0.13 | * | ||
| Aug 20 07:09:56 | P60 | 120.0 | 15.49 0.14 | * | ||
| Aug 20 07:20:45 | P60 | 120.0 | 15.96 0.20 | * | ||
| Sep 26 03:06:14 | HST | 1600.0 | 24.09 0.09 | * |