High resolution CO imaging of high redshift QSO host galaxies
Abstract
We review recent high-resolution CO observations of distant QSOs obtained at the Very Large Array. The aim of these observations is to resolve the molecular gas distribution in these extreme objects both spatially and in velocity space. They provide unique information regarding the small-scale distribution, the extent, and the brightness temperatures of the molecular gas in these early systems. E.g., the structure and dynamics of the molecular gas may reveal whether or not mergers can be the cause of the ongoing starburst activity. The observations also allow for a first estimate of the dynamical gas mass. Currently, only the VLA is able to obtain resolutions in CO of up to 0.15′′ which is needed to resolve typical galactic structures of sizes 1 kpc. We present new high-resolution VLA imaging of high– QSOs (BRI 1335–0417, APM 08279+5255 and J1148+5251). These observations pave the road to future ALMA observations where resolutions of order 0.1′′ will be obtained routinely.
1Max-Planck-Institut für Astronomie, Königstuhl 17,
Heidelberg, D-69117, Germany
2National Radio Astronomy Observatory, PO Box O, Socorro, NM
87801, USA
3Argelander-Institut für Astronomie, Auf dem Hügel 71, Bonn,
D-53121, Germany
4Max-Planck-Institut für Radioastronomie, Auf dem Hügel 69,
Bonn, D-53121, Germany
5 Institut de RadioAstronomie Millimétrique, 300 Rue de la
Piscine,
Domaine Universitaire, 38406 Saint Martin d’Héres, France
1. Introduction: QSOs at high
Over the last few years, the study of high redshift QSOs has been
revolutionized in three ways. First, wide field surveys have revealed
100’s of high– QSOs, right back to the epoch of cosmic reionization
(; e.g., Fan et al. 2006). Second, it has been shown that most
(all?) low redshift spheroidal galaxies have central super-massive
black holes (SMBH), and that the black hole mass correlates with bulge
velocity dispersion. This MBH– correlation
suggests coeval formation of galaxies and SMBH, thereby making SMBHs a
fundamental aspect of the galaxy formation process (Gebhardt et al.
2000). And third, mm surveys of high redshift QSOs find that 30
of the sources are ‘hyper-luminous infrared galaxies’ ( L⊙), corresponding to thermal emission from warm dust,
and that this fraction is independent of redshift out to (Beelen et al. 2004, Omont et al. 2004). If the dust is heated
by star formation, the implied star formation rates are extreme ( M⊙ year-1), consistent with the formation of a large
elliptical galaxy on a dynamical timescale of 108 years.
2. Molecular Gas in QSO hosts
Molecular line observations (typically CO) of FIR-luminous high– QSOs have revealed large gas masses in most cases observed to date (see Carilli et al. 2004; Solomon & Vanden Bout 2005). Detecting large amounts of warm, extended molecular gas currently provides the strongest evidence that these luminous QSOs are undergoing vigorous star formation. The coeval growth of massive black holes and of massive stellar populations can be examined directly in these unique systems, providing an opportunity to study the cause of the tight correlation between these components that is observed in local spheroidal galaxies. High resolution observations are crucial for this, since the structure of the dense gas which is feeding the starburst and the black hole can reveal the cause of event (e.g. mergers) and the mass of the systems, placing them into the cosmic structure evolution context. Molecular gas has now been detected in more than a dozen QSO host galaxies. Most sources have been studied in the higher order transitions ( CO 3–2), although at the lower order transitions become accessible to cm telescopes such as the VLA.
The detection of CO emission is critical to estimate the reservoir of the molecular gas in these early systems. A second step is then to spatially resolve the molecular gas distribution. In particular, given the typical diameters of galaxies of many kpc, a linear resolution of kpc is needed to resolve the structure of the underlying host galaxy. Such measurements are needed 1) to get an estimate for the size of the host galaxy (and thus a better estimate for the dynamical mass), 2) to resolve potentially merging systems and 3) to better constrain the physical properties of the molecular gas by measuring the brightness temperature of the molecular gas in the hosts. A linear resolution of 1 kpc corresponds to a resolution of 0.15′′ at the redshifts under consideration (1 kpc at , 1 kpc at ). Such observations can then in turn be used to constrain the predictions by CDM simulations of early galaxy formation, and, if a large sample was available, put limits on the frequency of mergers at high redshift. In addition, such studies can be used to constrain the possible redshift-evolution of the MBH– relation (as will be discussed below).
It is important to note that the highest resolution imaging of QSO host galaxies can currently only be obtained using the recently upgraded Q–band system at the VLA. In optical/NIR observations the central bright AGN greatly overshines the host galaxy, thus rendering optical/NIR studies of the QSO hosts impossible given current instrumentations. We note that observations of the molecular gas phase at resolutions of 0.15′′ will even be difficult to achieve with ALMA during the ’early science’ operations, as they require 4 km ( GHz) or km ( GHz) baselines (numbers are for a source). For comparison, current mm interferometers typically only observe at baselines up to m.
3. Previous Work
Over the last few years, the VLA has been used to image a number of high– sources. In the following, we will briefly review some of these observations and their implications for understanding the properties of molecular gas at the highest redshifts.
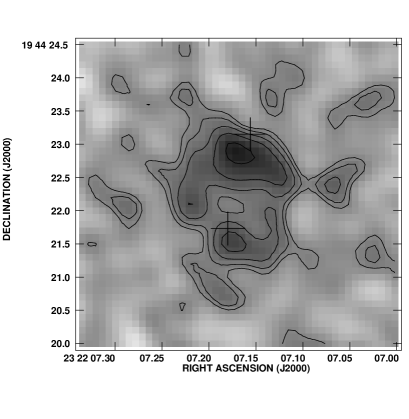
J2322+1944 (): In Fig. 1 we show the CO emission from the QSO J2322+1944. The source is strongly gravitationally lensed, appearing as a double QSO in the optical with 1′′ separation (Djorgovski et al. in prep), and a complete ’Einstein ring’ in the CO 2-1 emission (Carilli et al. 2003). This molecular ring makes J2322+1944 one of the most stunning CO images at high redshift. Quite importantly, a similar ring is seen for the 1.4 GHz continuum emission (Carilli et al. 2003). These observations have been modeled (by the above mentioned authors) in the source plane as a starburst disk surrounding the QSO with a radius of about 2 kpc. J2322+1944 thus represents perhaps the best example of a coeval starburst+AGN at high redshift. This exemplifies that strongly lensed sources can be used to even study the overall morphologies in galaxies (if a good lens model exists).
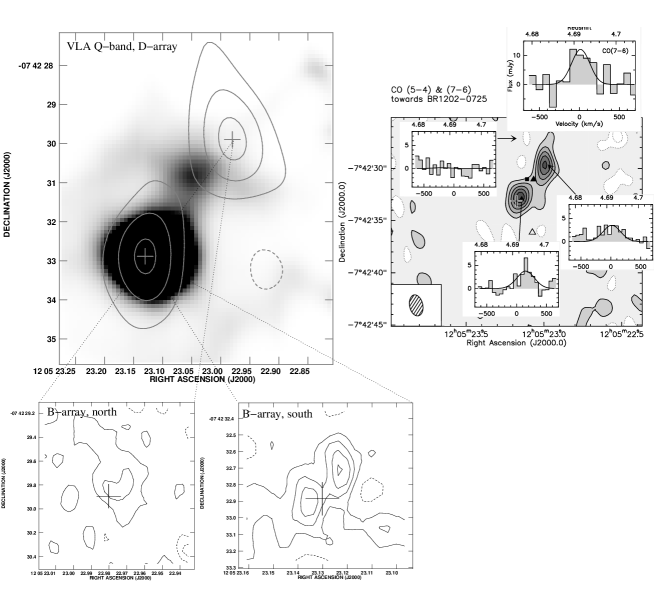
B1202-0725 (): At , BR 1202-0725 is observed at a cosmic time of 1.3 Gyr after the Big Bang. It was detected in multiple CO transitions and recently also in CO(1–0) using the GBT (see Riechers et al. 2006, also this volume). This source has the curious property that the optical QSO is a single source, but the mm continuum and CO line observations show a double source with a separation of about 4′′ (Omont et al. 1996; Guilloteau et al. 1999; Carilli et al. 2002). This is illustrated in the CO imaging shown in Fig. 2. This double morphology may indicate a pair of interacting objects separated by about only 20 kpc (Yun et al. 2000) or a QSO exhibiting a massive starburst (southern source) with a dust–obscured, Ly– - emitting companion (northern source, Hu et al. 1996) ionized by the strong QSO, which also contains a starburst. The total far-IR luminosity of the ULIRG BR 1202-0725 is , leading to a ratio of 350. The implied total molecular gas mass in this system is about (Carilli et al. 2002).
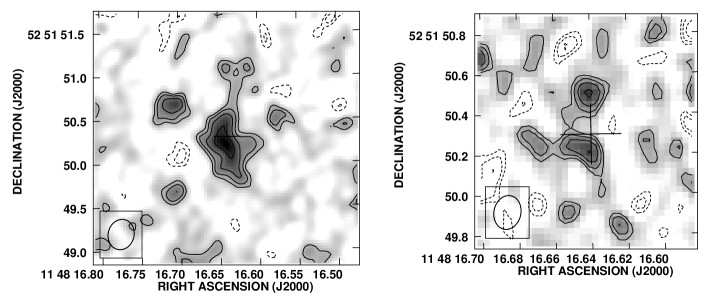
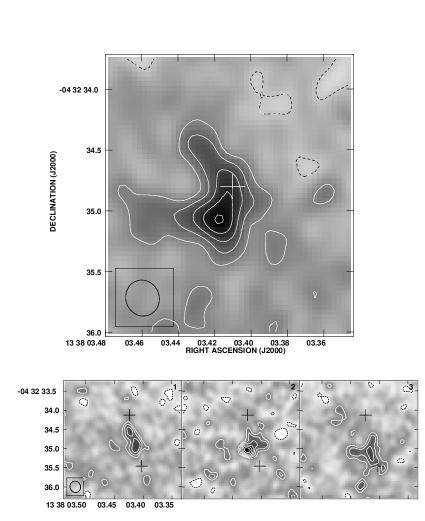
J1148+5251 (): This source is still the redshift record–holder for QSOs. It has been detected in CO(3-2) using the VLA (Walter et al. 2003) and in CO(6–5) and CO(7–6) using the Plateau de Bure interferomter (Bertoldi et al. 2003). Follow–up VLA B and C array observations clearly resolved the the molecular distribution spatially and also in velocity space (Walter et al. 2004, see Fig. 3). The molecular gas distribution in J1148+5251 is extended out to radii of 2.5 kpc. The central region is resolved and shows 2 peaks, separated by 1.7 kpc; they account for about half of the total emission, with the other half present in the more extended molecular gas distribution. Each of these peaks harbors a molecular gas mass of M⊙ within a radius of 0.5 kpc, respectively; this mass is similar to the total mass found in nearby ULIRGS such as Mrk 273 or Arp 220 (Downes & Solomon 1998). The peaks have intrinsic brightnesses of K (averaged over the 1 kpc-sized beam), similar to what is found in the centres of nearby active galaxies (Downes & Solomon 1998, assuming constant surface brightness down to the CO(1–0) transition), albeit measured over a larger physical area.
Based on the extent of the molecular gas distribution and the line-width measured from the higher CO transitions we derive a dynamical mass of M⊙ ( M⊙ if we correct for an inclination of ). This dynamical mass estimate can account for the detected molecular gas mass within this radius but leaves little room for other matter. In particular, given a black hole mass of mass 1-5 M⊙ (Willot et al. 2003), this dynamical mass could not accomodate an order few M⊙ stellar bulge which is predicted by the present–day M relation (Ferrarese & Merritt 2000, Gebhardt 2000), if this relation were to hold at these high redshifts. Even if we assume a scenario in which this bulge was 10 times the scale length of the molecular gas emission, we would still expect a bulge contribution of few M⊙ within the central 2.5 kpc (assuming a central density–profile of , e.g., Jaffe 1983, Tremaine 1994) which can not be reconciled with our results. Our finding therefore suggests that black holes may assemble before the stellar bulges. Depending on the space density of similar sources at these high redshifts, the smaller dynamical masses may be in better agreement with the masses predicted by CDM simulations in the very early universe as a 1012 M⊙ bulge would imply a rather massive dark matter halo of M⊙. Regardless, these results show the power of high-resolution CO imaging in sources at the end of cosmic reionization.
4. New Observations
In the following, we present some new observations that we recently obtained at the VLA in B array configuration (D. Riechers, PhD Thesis, MPIA Heidelberg).
APM0827+5255 (): The presence of extended CO(1–0) emission in APM0827+5255 was reported by Papadopoulus et al. (2001). Additional CO(2–1) C–array imaging by Papadopoulus et al. also showed some evidence for an extended envelope around the central QSO. We have have obtained new C and B array observations for this source and do not find evidence for such an extended CO component. In Fig. 4, we show our highest resolution data, where we detect a compact but resolved structure of the lens images. Two clearly separated images can be seen, and their morphology and brightess ratio is very similar to that of the optical QSO. We thus conclude that the CO in this source is indeed extremely compact, and that the lensing magnification is close to the optical magnification i.e., a factor of 100 rather than 7 as derived in previous models (Lewis et al. 2002). Further evidence against an extended CO(1–0) reservoir around APM0827+5255 comes from our multi–CO transition study of this source (Weiss et al. 2006, in prep., see also this volume, and recent single dish observations of this source using the GBT, Riechers et al. 2006, see also this volume).
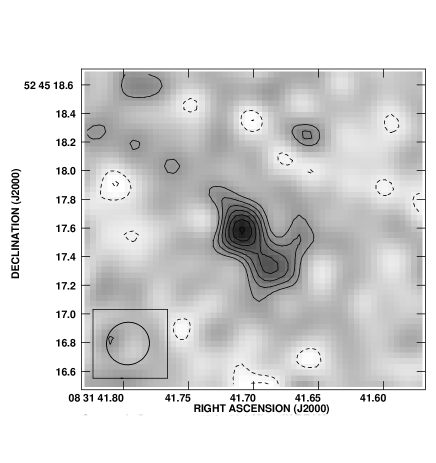
B1335-0417 (): This is one of the first sources detected in CO(2–1) with the VLA in D array (Carilli et al. 1999). We recently re–observed the CO(2–1) transition in the QSO BRI 1335-0417 at high resolution (0.15′′) with the VLA in B–array (Fig. 5, Riechers et al. 2006, in prep.). The integrated CO map shows a compact but resolved molecular gas reservoir, and our velocity channel maps show, for the first time, the actual dynamics of the molecular gas in a high-z QSO host galaxy at high signal–to–noise. The detected structure shows an interesting morphology which may be interpreted as a close merger or rotation. We are currently modeling the kinematics of this unique dataset.
5. Concluding remarks
The recent observations presented here have shown that resolved molecular gas maps of objects out to the highest redshifts can already be achieved with today’s instrument (i.e. the VLA). Although these observations are time intensive, they have dramatically improved our knowledge of the properties of the molecular gas phase at high redshift. E.g., they have helped to constrain the source sizes and kinematics, which in turn constrain the dynamical masses (e.g. in the case of J1148+5251, and B1335-0417). Also, they have provided clear evidence for co-eval starburst and AGN activity (e.g., J2322+1944) and revealed likely interactions with objects that are barely visible in the optical (e.g. B1202-0725). These results show the enormous potential for future studies of the molecular gas content and dynamical masses in a statistically significant sample of high–redshift galaxies using ALMA, where resolutions of will be achieved routinely.
Acknowledgments.
D. A. R. acknowledges support from the Deutsche Forschungsgemeinschaft (DFG) Priority Programme 1177. C. C. would like to acknowledge support from the Max-Planck-Forschungspreis.
References
- (1) Beelen, A., et al. 2004, A&A, 423, 441
- (2) Bertoldi, F., Cox, P., Neri, R., et al. 2003, A&A, 409, L47
- (3) Carilli, C. L., Menten, K. M., & Yun, M. S. 1999, 521, L25
- (4) Carilli, C. L., Kohno, K., Kawabe, R., et al. 2002b, AJ, 123, 1838
- (5) Carilli, C. L., Lewis, G. F., Djorgovski, S. G., et al. 2003, Science, 300, 773
- (6) Carilli, C., et al. 2004, astro-ph/0402573
- (7) Downes, D., & Solomon, P. M. 1998, ApJ, 507, 615
- (8) Fan, X, et al. 2006, AJ, 131, 1203
- (9) Ferrarese, L. & Merritt, D. 2000, ApJ, 539, L9
- (10) Gebhardt, K., et al. 2000, ApJ, 539, L13
- (11) Guilloteau, S., et al. 1999, A&A 349, 363
- (12) Hu, E., et al. 1996, ApJ, 459, L53
- (13) Jaffe, W. 1983, MNRAS, 202, 995
- (14) Lewis, G. F., Carilli, C., Papadopoulos, P., & Ivison, R. J. 2002, MNRAS, 330, L15
- (15) Omont, A., Petitjean, P., Guilloteau, S., et al. 1996, Nature, 382, 428
- (16) Omont, A., Beelen, A., Bertoldi, F., Carilli, C. L., & Cox, P. 2004, in ’Multiwavelength AGN Surveys’,World Scientific, Singapore, 2004, 109
- (17) Papadopoulos, P., Ivison, R., Carilli, C. L., & Lewis, G. 2001, Nature, 409, 58
- (18) Riechers, D. A., Walter, F., Carilli, C. L., et al. 2006, ApJ, in press
- (19) Solomon, P. M., & Vanden Bout, P. A. 2005, ARA&A, 43, 677
- (20) Tremaine, S., Richstone, D. O., Byun, Y., et al. 1994, AJ, 107, 634 614, L97
- (21) Walter, F., Bertoldi, F., Carilli, C. L., et al. 2003, Nature, 424, 406
- (22) Walter, F., Carilli, C., Bertoldi, F., et al. 2004, ApJ, 615, L17 365, 271
- (23) White, R. L, Becker, R. H, Fan, X., & Strauss, M. A., 2005, AJ, 129, 2102
- (24) Willott, C. J., McLure, R. J., & Jarvis, M. J. 2003, ApJ, 587, L15
- (25) Yun, M., et al. 2000, ApJ, 528, 171