11email: tigar@mpifr-bonn.mpg.de, ros@mpifr-bonn.mpg.de, azensus@mpifr-bonn.mpg.de
Cosmological evolution of compact AGN at 15 GHz
Abstract
Aims. We study the uniformity of the distribution of compact flat-spectrum AGN on the sky and the evolution of their relativistic jets with cosmic epoch.
Methods. A complete sample of compact extragalactic radio sources at 15 GHz was recently compiled to conduct the MOJAVE program. The MOJAVE sample comprises 133 radio-loud flat-spectrum AGN with compact relativistic outflows detected at parsec scales.
Results. Analysis of the population of flat-spectrum quasars of the sample reveals that the pc-scale jets of quasars have intrinsic luminosities in the range between and and Lorentz factors distributed between . We find that the apparent speed (or Lorentz factor) of jets evolves with redshift, increasing from to and then falling at higher redshifts () by a factor of 2.5. The evolution of apparent speeds does not affect significantly the evolution of the beamed luminosity function of quasars, which is most likely to be dependent on the evolution of radio luminosity. Furthermore, the beamed radio luminosity function suggests that the intrinsic luminosity function of quasars has a double power-law form: it is flat at low luminosities and steep at high luminosities. There is a positive evolution of quasars at low redshifts () and strong negative evolution at redshifts with space density decline up to . This implies that the powerful jets were more populous at redshifts between and . We show that the evolution of compact quasars is luminosity dependent and it depends strongly on the speed of the jet suggesting that there are two distinct populations of quasars with slow and fast jets which evolve differently with redshift.
Key Words.:
surveys – quasars: general – galaxies: active – galaxies: nuclei – galaxies: jets – BL Lacertae objects: general1 Introduction
The advantage of studying the cosmological evolution of radio sources free of dust obscuration was realized by Longair (1966). He demonstrated that the cosmic evolution of low and high luminosity radio sources sampled at low radio frequency (178 MHz) are different with later ones having much stronger evolution. The morphological difference between FRI and FRII radio sources (Fanaroff & Riley 1974) and their division into low and high luminosity classes below and above W Hz-1 sr-1 was used by Wall et al. (1980) to show that the population of FRI radio sources does not evolve strongly with cosmic time whilst the evolution of FRII sources is much stronger. The orientation-based unification scheme (Scheuer 1987; Barthel 1989) suggests that a single parent population of radio sources appears as radio galaxies and quasars when viewed at different angles to the line of sight, with quasars beeing seen from to the line of sight and radio galaxies from larger angles. It was successfully used to describe a diverse appearance of observed characteristics of radio sources and their evolution (Urry & Padovani 1995; Jackson & Wall 1999; Grimes et al. 2004) at different radio frequencies. The orientation of the jet and its beamed emission are two important keys to identify that the BL Lacs and quasars are beamed parent objects of FRI and FRII radio sources. At low frequencies (178 MHz), these sources appear as extended (lobe-dominated) steep-spectrum FRI and FRII radio sources. Willott et al. (2001) used the combined sample of 3CRR, 7C and 6CE surveys (see references in Willott et al. 2001) to model the radio luminosity function of FRI/FRII radio sources. They showed that a dual-population model of luminosity function fits the data well, but it requires a differential positive density evolution between and . No evidence of a negative evolution (redshift ‘cut-off’) is found at high redshifts.
The surveys at frequencies GHz include both lobe- and core-dominated sources in which the jet beaming effect appears to be dominant. These radio sources enhanced by Doppler beaming of the jet are identified with flat-spectrum quasars and BL Lacs. At these frequencies, the cosmological evolution of flat-spectrum sources is more complex, involving the evolution of both non-beamed and beamed emission. In addition to the luminosity/density evolution it also may depend on the evolution of relativistic effects with cosmic time. The evolution of flat-spectrum quasars was studied in several works (Dunlop & Peacock 1990; Jackson & Wall 1999; Cirasuolo et al. 2005; Wall et al. 2005). Jackson & Wall (1999) showed that the evolution and beaming of powerful radio sources may be described by a dual-population unification scheme for FRI and FRII sources which, depending on the viewing angle, appear as lobe-dominated steep-spectrum and core-dominated flat-spectrum sources. Using data from a combined sample of radio sources at 2.7 GHz Dunlop & Peacock (1990) showed that both pure luminosity and luminosity/density evolution fit the observed redshift and source-count data. They presented clear evidence of a redshift cut-off for both steep- and flat-spectrum quasars at high redshifts, . A high redshift cut-off is also evident in the Parkes quarter-Jansky flat-spectrum quasars (Wall et al. 2005) and in the sample of 352 faint flat-/steep-spectrum quasars (Cirasuolo et al. 2005) – with radio fluxes 1 mJy at 1.4 GHz – selected from the radio (Faint Images of the Radio Sky at Twenty centimeters) and optical (2dF QSO Redshift Survey) surveys. They found an indication of a significant negative evolution for faint quasars at consistent with negative evolution of bright flat-spectrum radio quasars at 2.7 GHz, and inconsistent with no-evolution of steep-spectrum bright radio quasars at 151 MHz (Willott et al. 1998). The reduction of the comoving space density of quasars at high redshifts is also found in X-ray and optically selected samples (e.g., Schmidt et al. 1991; Fan et al. 2001 and references therein; Hasinger 2004; Silverman et al. 2005) indicating that the redshift cut-off of optically-selected quasars is not a selection effect due to obscuration by dust.
It is not clear whether the redshift cut-off of flat-spectrum sources is present in high radio frequency samples selected on the basis of beamed emission and whether the cosmological evolution of beamed sources depends on the properties of the jets such as the intrinsic luminosity and Lorentz factor of the jet (the analytical relationships between the latter parameters were studied by Lister & Marscher (1997) for simulated flux-limited samples of relativistic jets). To examine these problems we use the (first) complete sample of 133 bright AGN at 15 GHz which has been compiled recently by Lister & Homan (2005) as an extension of the Very Long Baseline Array (VLBA) 2 cm survey (Kellermann et al. 1998; Zensus et al. 2002) and other programs. This sample of flat-spectrum AGN was designed for a long-term observational program (named the MOJAVE survey) to study the structure and evolution of compact jets. The radio emission of AGN originates in the compact jets at scales from a few parsecs to tens of parsecs. Although the sample is small, includes relatively bright sources and is restricted to , it provides a wealth of information about radio emission, structure and kinematics of parsec-scale jets. The completeness of the sample makes it possible to investigate the cosmological evolution of flat-spectrum AGN in the context of evolution of the jet parameters. In Sect. 2, the complete sample of flat-spectrum AGN is presented. In Sect. 3, we investigate the homogeneity of the MOJAVE sources on the sky. The source counts of AGN, evolution of apparent speeds of jets, and luminosity function and its evolution with cosmic epoch are examined in Sect. 4. Section 5 involves the summary of results. In this paper we use a flat cosmology () with non-zero lambda, and .
2 The MOJAVE sample
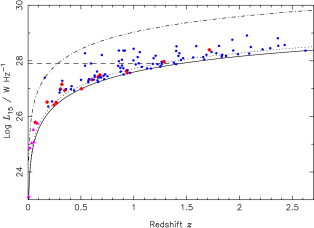
The main selection criterion is the flux density limit at 15 GHz: all variable sources with measured VLBA flux densities exceeding 1.5 Jy (2 Jy for southern sources) at any epoch since 1994 are included in the sample (Lister & Homan 2005). It is restricted to declinations larger than and to Galactic latitudes . There are 96 sources in common with the 2 cm survey, which is not entirely complete down to the flux density limit. A sample of additional 37 AGN was assembled from other recent high-frequency surveys. The final sample comprises 133 radio sources, all active galactic nuclei: radio-loud, core-dominated and flat-spectrum111 http://www.physics.purdue.edu/astro/MOJAVE (see Lister & Homan 2005, for more detailed description of the sample and its completeness). The MOJAVE sample is based on the selection of highly beamed radio sources. The majority of the AGN have a core-jet structure on parsec-scales, and many of them show superluminal motion in their jets suggesting that the bulk of the beamed emission at 15 GHz originates in the relativistic jet. Some nearby radio galaxies with two sided jets are included in the sample because of bright (unboosted) radio emission. At present, 116 (87 %) of the 133 AGN have spectroscopic redshifts: 94 of 94 (100 %) quasars, 15 of 22 (68 %) BL Lacs and 7 of 7 (100 %) radio galaxies. The remaining nine sources have no optical identification. The radio luminosities of compact AGN at 15 GHz () vary over to W Hz-1 over the redshift range from to (Fig. 1). The apparent speed of the fastest component of the jet rated as ‘good’ or ‘excellent’ (Kellermann et al. 2004) is measured for 66 quasars, 15 BL Lacs and six radio galaxies. The maximum total flux densities observed for each source during the VLBA monitoring campaign are used throughout the paper.
3 Sky distribution
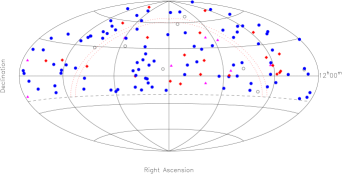
If the sample is free from selection effects, then we should expect that the radio sources are distributed uniformly in the sky. The distribution of 133 AGN on the celestial sphere is shown in Fig. 2. The distribution of radio sources looks patchy with few clusters and voids in the sky. To test the uniform distribution of AGN we measure a two-point angular correlation function (Peebles 1980; Infante 1994),
| (1) |
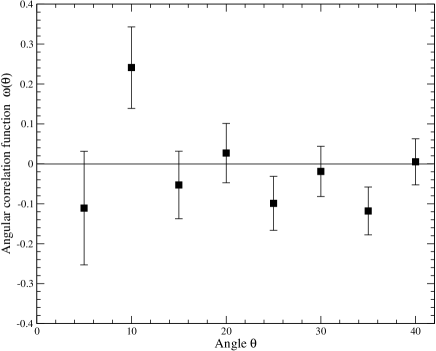
where is the number of AGN in the MOJAVE survey, is the number of distinct pairs of AGN with angular separations from to , is the number of random points generated in the area of the survey, and is the total number of random points in the same annuli to around AGN. Note, that only % of the sources (, where ) are missed from the sample as a result of the Galactic plane exclusion. This has little effect on number statistics of AGN therefore we do not take it into account. The angular correlation function for 133 AGN is shown in Fig. 3. The correlation function remains near within the limits of errors, which is indicative that the distribution of MOJAVE sources is uniform over the large angular scale from to .
4 Space distribution: evolution of compact AGN
At high radio frequencies the observed flux density is produced predominantly in the relativistic jet,
| (2) |
where is the beamed (apparent) luminosity, is the comoving distance at the redshift , and is the spectral index ( is assumed throughout the paper). The relativistic Doppler effect causes the rest-frame (intrinsic) luminosity () of the source to appear enhanced towards the observer, , where for a steady-state jet and is the Doppler factor which is a function of the jet viewing angle () and the speed of the jet (in units of the speed of the light) and is the Lorentz factor,
| (3) |
Therefore, the source counts and cosmological evolution of AGN from the MOJAVE sample are affected by the relativistic beaming effects.
4.1 Source counts
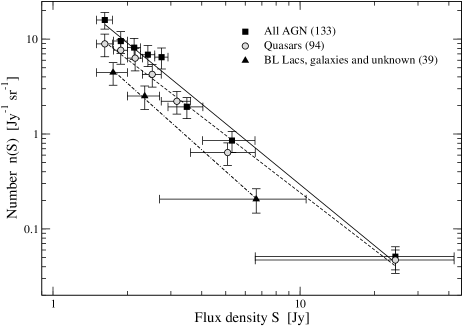
The MOJAVE sample is sampled from different high frequency radio samples and does not represent an independent survey. One needs to test its completeness which is the main criterion for deriving the true cosmological evolution and statistical characteristics of relativistic jets of compact AGN. If the MOJAVE sample is a complete sample, then one should expect that the slopes of source counts of the MOJAVE sample and independent high frequency surveys are aligned. At present, the only independent survey of radio sources at 15.2 GHz is carried out using the Ryle Telescope (Taylor et al. 2001). They identified 66 sources between 0.2 Jy and 5 Jy and fitted the differential source count by a power law, . At 15.2 GHz and flux density range the main population of objects should consist of the beamed flat-spectrum extragalactic radio sources (Jackson & Wall 1999).
The normalized differential source count of AGN from the MOJAVE sample is presented in Fig. 4. To take into account the different flux density limits of the sample, the northern sky area is used to normalize the number count of AGN between the flux density range from 1.5 Jy to 2 Jy, and the number count of AGN with Jy is normalized to the complete sky area of the sample, . The slope of the differential source counts ( Jy-1sr-1) is estimated for three sets of sources (Fig. 4): all AGN (), quasars (), and BL Lacs, galaxies and sources with no optical identification (). The MOJAVE and 15.2 GHz surveys overlap between the 1.5 Jy and 5 Jy flux density range. The source counts of all MOJAVE sources (solid line) and quasars only (dashed line) have slopes which are characteristic of the complete survey at 15.2 GHz () and of the bright end ( Jy) of lower frequency surveys at 0.15 GHz to 8.4 GHz () suggesting that the MOJAVE represents a flux-limited complete sample. The subsample of non-quasars (dot-dashed line) has a slightly steeper slope. It is most likely that this deviation arises because of a small number of bins (or sources) involved in the fitting.
It is useful to compare the observed source count with the Euclidean source count which is given by for the unbeamed and uniformly distributed radio sources. It is not obvious whether this simple relation holds for the beamed sample of radio sources. Given the apparent radio luminosity function , the number of radio sources with apparent flux per unit area of the sky is given by,
| (4) |
where is the comoving volume element. For the isotropic non-evolving Euclidean universe and , and the equation (4) reduces to,
| (5) |
The apparent luminosity function is the convolution of the intrinsic luminosity function () and probability density of a Doppler factor (),
| (6) |
where the integration limits are a complex function of and (Urry & Padovani 1991; Lister 2003). The integral over the apparent luminosity function is constant (eq. 5) and hence the Euclidean differential source counts of a beamed population of radio sources, , is independent of the distributions of their intrinsic luminosities and Doppler factors. The slope of the differential number counts of the MOJAVE sources () is flatter than the slope of the Euclidean source counts () indicating that the radio luminosity function of compact AGN evolves with cosmic epoch.
4.2 Radio luminosity function
The observed radio luminosity of BL Lacs and quasars at 15 GHz is highly boosted and radiated predominantly by the approaching relativistic jet (Kellermann et al. 1998; Zensus et al. 2002). The relativistic Doppler beaming of the jet transforms the intrinsic radio luminosity function of compact quasars to the beamed (apparent) luminosity function at the rest-frame of the observer. Earlier studies (Urry & Shafer 1984; Urry & Padovani 1991; Lister 2003) provided analytical predictions for the apparent luminosity function of jets randomly oriented on the sky. The single and double power-law intrinsic luminosity functions were modelled assuming a single-valued Lorentz factor for the jet. Lister (2003) extended the later work for the variety of power-law distributions of Lorentz factors, (), which was found to provide a good fit to the distribution of apparent speeds of AGN (Lister & Marscher 1997). The modelled apparent and intrinsic luminosity functions have several important break points and relations. We will use these to constrain the intrinsic luminosity function of the jets. The evolution of the apparent luminosity function involves both evolution of the intrinsic luminosity function and evolution of the Lorentz factor (or the change of the Doppler factor) of the jet with redshift. The latter can be examined by considering the apparent speed–redshift relation plane which also allows the important characteristics of the relativistic beaming of flat-spectrum AGN to be determined.
4.2.1 The apparent speed – redshift plane
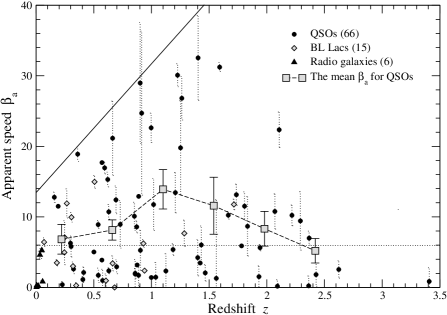
The apparent speed (in units of the speed of the light, ) of jets measured for 87 AGN is plotted against their redshifts in Fig. 5. The mean apparent speed varies significantly depending on type of AGN: ( for radio galaxies, ( for BL Lacs and ( for quasars. Most of quasars and BL Lacs have superluminal jets () indicating that their radio emission is highly beamed. This puts a limit on the minimum Doppler factor, (), where is the maximum (critical) viewing angle of the jet having a minimum Lorentz factor . Assuming that for quasars (Barthel 1989), we calculate the lower limit on the Lorentz factors, (from eq. 3).
Vermeulen & Cohen (1994) showed that for the orientation-biased sample with a single Lorentz factor distribution the value of the apparent speed is close to the maximum apparent speed of the jet which is true for BL Lac objects and quasars with , and . The maximum apparent speed and Lorentz factor of the jet is (Fig. 5) and the . The maxumum Doppler factor will be reached at the viewing angle degrees. It is extremely unlikely to detect a source with in a small sample such as the MOJAVE. at the optimum angle of the jet, , and the value of is a realistic upper limit to the Doppler factor of the jets of our sample. To calculate the range of the intrinsic luminosities of jets we use the minimum and maximum radio luminosities of quasars W Hz-1 (at ) and W Hz-1 (at ). Assuming that at low and high redshifts (see Fig. 5) we recover and .
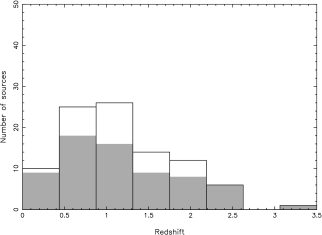
There is a lack of high at low redshifts, (Fig. 5). For the relation plane, Cohen et al. (in preparation) discuss the selection effects which might result in the lack of sources with large at low luminosities. They argue that both effects, the minimum sampling interval of the MOJAVE sample and the determination of speed of the jet when the frequency of ejection of moving components is greater than the frequency of observations, can not account for the lack of sources thus leading to the conclusion that the increase of apparent speeds with increasing luminosity is real. This is true also for the relation plane because of positive correlation between and in the flux-limited MOJAVE sample. Another potential selection effect at low redshifts is that we miss sources with unknown which may populate the left-top region in Fig. 5. The quasars with unknown apparent speeds (Fig. 6) will populate the redshifts thus the increase of to high redshifts () will not be affected. This trend is also evident for the mean apparent speeds (gray squares in Fig. 5) estimated in different redshift bins. There is a gradual decrease of the mean apparent speed from down to . Were high speed jets () to exist at high redshifts one should observe them because their radio emission would be highly boosted. It is unlikely that the high-speed quasars are among those with unknown , because no systematic selection of measured apparent speeds was introduced. For the same reason, the averaged behaviour of the apparent speed can not be affected by unknown apparent speeds. Moreover, the highest redshift bin, which includes six quasars with measured , has the lowest value of which supports the idea that the apparent speeds (and hence the Lorentz factors) of the jets of quasars evolve with cosmic epoch: the mean apparent speed increases from to by a factor 2.5 and then falls by factor of two at the present epoch.
Note that a peak in the relation plane is mainly due to nine high speed sources with , and that inclusion or exclusion of these quasars has no significant effect on the evolution of the luminosity function of quasars examined in the next sections.
4.2.2 Evolution of the luminosity function of quasars
We chose the population of quasars for a study of the luminosity function because they comprise a large homogeneous sample of beamed and optically identified sources having apparent speeds measured for 70% of the jets. We used the (Schmidt 1969) method to construct the apparent luminosity function. The MOJAVE sample occupies different sky areas depending upon the flux density limits: 1.5 Jy for northern hemisphere and 2 Jy for southern hemisphere. In this case, the is the volume available in the combined sample (Avni & Bahcall 1980). Note that all statistical tests and methods throughout the paper were applied to the combined sample. The apparent luminosity function is presented in Fig. 7 for three redshift bins, (27 quasars), (35) and (32). The form of the luminosity function is similar at all redshifts: it is flat at lower luminosities (, for ) and becomes steeper at higher luminosities. There is marginal evidence that the high luminosity end of the luminosity function steepens with increasing redshift. We now discuss the form of the intrinsic luminosity function and distribution of Lorentz factors which may reproduce the observed luminosity function. We consider a single (steep) and double (flat and steep) power-law intrinsic luminosity functions (, where ) and distribution of Lorentz factors with (Urry & Padovani 1991; Lister 2003).

Urry & Padovani (1991) showed that if the slope of the apparent luminosity function is steeper than () then the intrinsic and apparent luminosity functions have the same slope at high luminosities (here we use the notation of Urry & Padovani 1991). At high luminosities the slope of the apparent luminosity function (and hence the slope of the intrinsic luminosity function) is . Urry & Padovani (1991) claimed that such a single and steep power-law intrinsic luminosity function will be transformed to the apparent luminosity function which, at low luminosities (), will have a slope independent of the Lorentz factor distribution. A single power-law parent luminosity function can not produce the flat part () of the apparent luminosity function observed at low luminosities. Lister (2003) showed that a flat or inverted slopes may be produced with the steep power-law slope () of the intrinsic luminosity function, and steep () distribution of the Lorentz factors. This is true for orientation-unbiased samples populated by slow jets and apparently it is not applicable to the flux-limited MOJAVE sample which is dominated by relativistic jets and high .
A complex (flat and steep) power-law intrinsic luminosity function and single power-law distribution of Lorentz factors of the jets are needed to describe the observed flatness of the luminosity function of beamed quasars. At low luminosities, the flat slopes of the intrinsic and apparent luminosity functions should coincide (Urry & Padovani 1991) while the steep slopes should match at high luminosities. The overall intrinsic luminosity function can be crudely represented by a double power-law with and at low and high luminosities respectively. The broken power-law form is generally consistent with the luminosity functions of quasars selected from unbeamed surveys: optical (Boyle et al. 1988) and low radio frequency samples (Willott et al. 1998, 2001). This supports the idea that flat-spectrum quasars are the parent population of FRII radio sources beamed towards the observer (Jackson & Wall 1999).
The shift of the apparent luminosity function (Fig. 7) may happen as a result of the evolution of intrinsic luminosity function of quasars and/or evolution of the Lorentz factor (Doppler factor) of the jet with cosmic time. We now consider three cases: a pure evolution of the Lorentz factors of the jets, a pure evolution of the intrinsic luminosity function, and evolution of both. The mean Lorentz factors in three redshift bins (Fig. 7) are () at low-, () at intermediate- and () at high-. In the case of an evolution of the jet speeds, the unchanged intrinsic luminosity function will be transformed to the apparent luminosity function. The observed shift of the luminosity function at high redshifts requires the increase of the beaming factor (or the Lorentz factor) with increasing redshift. The mean Lorentz factor increases from low- () to intermediate- () and goes down at high- (). This is in contradiction with the expected increase of the beaming factor at high redshifts.
In the case of a pure luminosity evolution of the intrinsic luminosity function one should expect that the luminosity curves shift to high luminosities (Fig. 7) at high redshifts (similar to the shift of the luminosity function of optically selected quasars, e.g. Boyle et al. 1988). Wall et al. (2005) noted that a contamination of the low luminosity bin by unbeamed sources can mimic a luminosity evolution. Our sample includes only the beamed quasars and therefore the observed shift is likely to be produced by simple luminosity evolution. An important question is whether the evolution of the beaming effects have a contribution to the shift of the luminosity function. Although there are indications that the Lorentz factor evolves with cosmic time (Fig. 5) it has no significant effect on the evolution of the apparent luminosity function. To understand and recover fully the effects of the relativistic beaming on the intrinsic luminosity function one needs to compare the observed distributions of jet parameters (and a complete data set of apparent speeds) with the distributions generated by means of Monte-Carlo simulations (Lister & Marscher 1997; Lister et al., in preparation).
4.3 evolution
Here, we use the model-independent statistics (Schmidt 1969) to test a null hypothesis of a uniform distribution of compact AGN in space and to study their cosmological evolution. This test is applicable only for complete flux-limited samples, where is the volume of space enclosed by the redshift of the AGN having a certain flux density, and is the maximum volume of space within which this source could be observed and still be included in the complete sample. If sources have a uniform distribution in space, then the averaged ratio of is constant and equal to 0.5. The difference between the expected and observed values of allows the significance of a deviation of the real distribution from uniform to be estimated. This test has been applied for different radio samples to show the presence of a strong positive evolution up to with to (e.g. (Longair & Scheuer 1970; Wills & Lynds 1978; Peacock et al. 1981).
We employed the generalized test (Avni & Bahcall 1980) which is derived for combined samples with different flux-density limits and sky areas. The new variables are and , the volume enclosed by the source and the volume available in the combined sample. Avni & Bahcall (1980) showed that the formal statistical properties of are the same as those of .
For 94 quasars, , the distribution is not uniform at the % confidence level (see Table 2), and it is biased towards large values which indicates that compact quasars, and hence the powerful jets, were more populous at high redshifts.
| ID | Num | Standard | K-S test | ||
|---|---|---|---|---|---|
| Error a | (%) | Prob. | |||
| All | 116 | 0.581 | 0.025 | 98.83 | 0.012 |
| Quasars | 94 | 0.589 | 0.027 | 99.02 | 0.009 |
| BL Lacs | 15 | 0.617 | 0.070 | 52 | 0.48 |
| Galaxies | 7 | 0.375 | 0.102 | 68 | 0.32 |
-
a
The standard error is estimated from SE , where and is the number of sources.
The BL Lacs show a similar trend, but this is not statistically significant because of the small number of sources. The distribution seems to be uniform for galaxies, i.e. with no evolution so far. The plausible explanation is that all eight radio galaxies occupy the low-redshift region where the density/luminosity evolution is negligible, but better statistics would be needed to confirm this result.
To investigate the dependence of radio luminosity on the statistics, we divided the sample of quasars in two equal subsamples by absolute luminosity at 15 GHz, . Strong sources have redshifts greater than 0.5 and weak sources have (Fig. 1). For 46 low-luminosity quasars we find that with confidence level of %, indicative that the distribution of is biased towards large values, whilst for 48 strong sources, (41 %), no significant deviation from a uniform distribution was found. The K-S test rejected at 96 % confidence level the null hypothesis that these distributions are drawn from the same parent population. The Student t test rejected the hypothesis of equal mean values of for low- and high-luminosity quasars at high significance level, 0.011 (98.88 %). This suggests that the cosmological evolution of quasars depends on radio luminosity. The evolution of high-redshift quasars can be masked by the strong positive evolution at low redshifts. To investigate the evolutionary behaviour of quasars at high redshifts we used the banded version of the test (Osmer & Smith 1970; Avni & Shiller 1983) which allows one to mask out evolutionary effects at high redshifts. It calculates the mean of a new statistic, , for the samples restricted by different values of (), where is the volume enclosed by a redshift .
The results of a banded test are shown in Figs. 8-10. For 94 quasars, a weak positive evolution is seen at low redshifts, , with values greater than the 0.5 no-evolution line (Fig. 8). The positive evolution is significant for quasars with (see Table 3). The values of decrease gradually to 0.5, and, within the errors, they remain at no-evolution level out to . A negative evolution is becoming significant for quasars with (Table 3), and it remains significant out to at which only few sources can be found. A significant redshift cut-off indicates that the population of beamed quasars having powerful jets undergo a diminution already at . Slightly high redshift cut-off () is found for faint quasars sampled at 1.4 GHz (Cirasuolo et al. 2005) and for the combined flat-spectrum quasars at 2.7 GHz (, Dunlop & Peacock 1990).

| Redshift | Number | SEa | K-S test |
|---|---|---|---|
| range | Prob. | ||
| 0.1 | 94 | 0.592 0.027 | 0.008 |
| 0.3 | 90 | 0.583 0.029 | 0.047 |
| 0.5 | 84 | 0.557 0.031 | 0.280 |
| 0.7 | 67 | 0.542 0.036 | 0.361 |
| 0.9 | 56 | 0.547 0.041 | 0.295 |
| 1.1 | 43 | 0.543 0.043 | 0.383 |
| 1.3 | 33 | 0.494 0.046 | 0.937 |
| 1.5 | 25 | 0.462 0.048 | 0.352 |
| 1.7 | 20 | 0.380 0.053 | 0.021 |
| 1.9 | 13 | 0.319 0.071 | 0.009 |
| 2.1 | 8 | 0.301 0.105 | 0.012 |
| 2.3 | 5 | 0.303 0.177 | 0.114 |
-
a
The standard error: SE , where
and is the number of sources with .
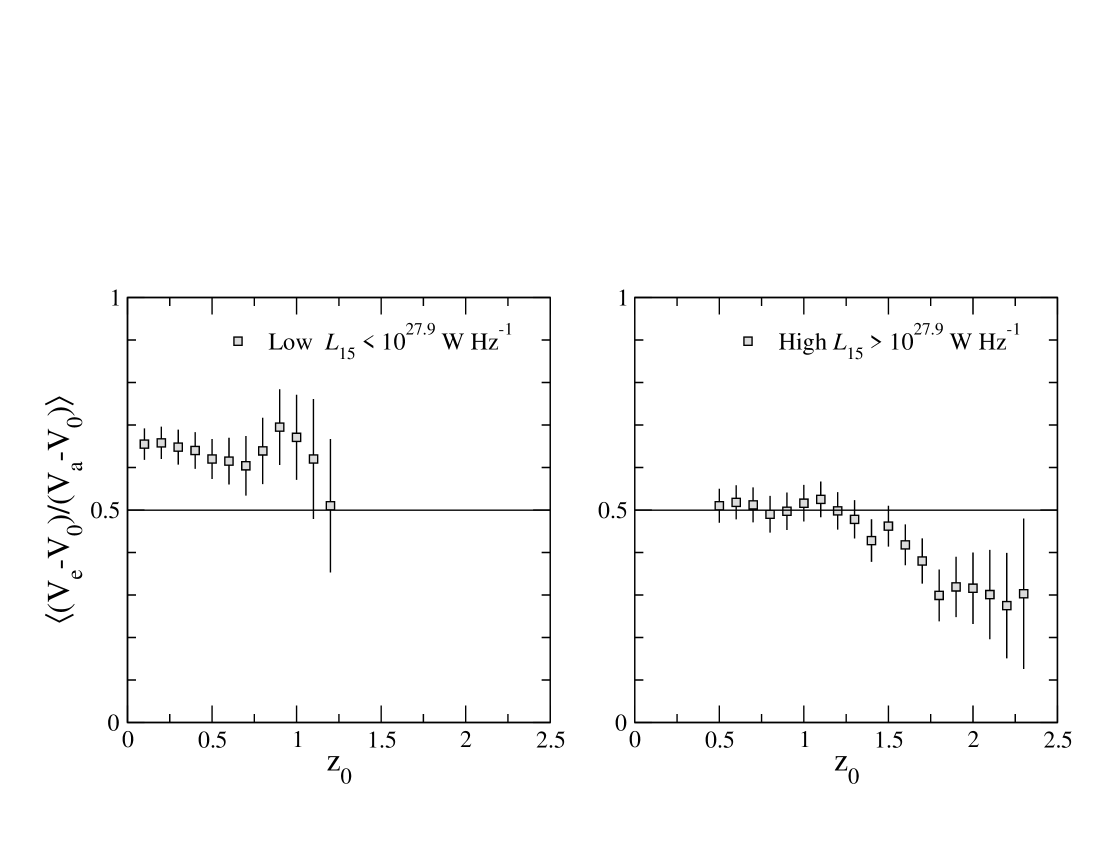
Figure 9 shows the results of a banded test for low- and high-luminosity quasars separated by luminosity at . There is significant positive evolution for low-luminosity quasars out to , and, again, a strong evidence for a high-redshift decline in the comoving space density of high-luminosity quasars with . The luminosity appears to play an important role in the evolution of flat-spectrum quasars.
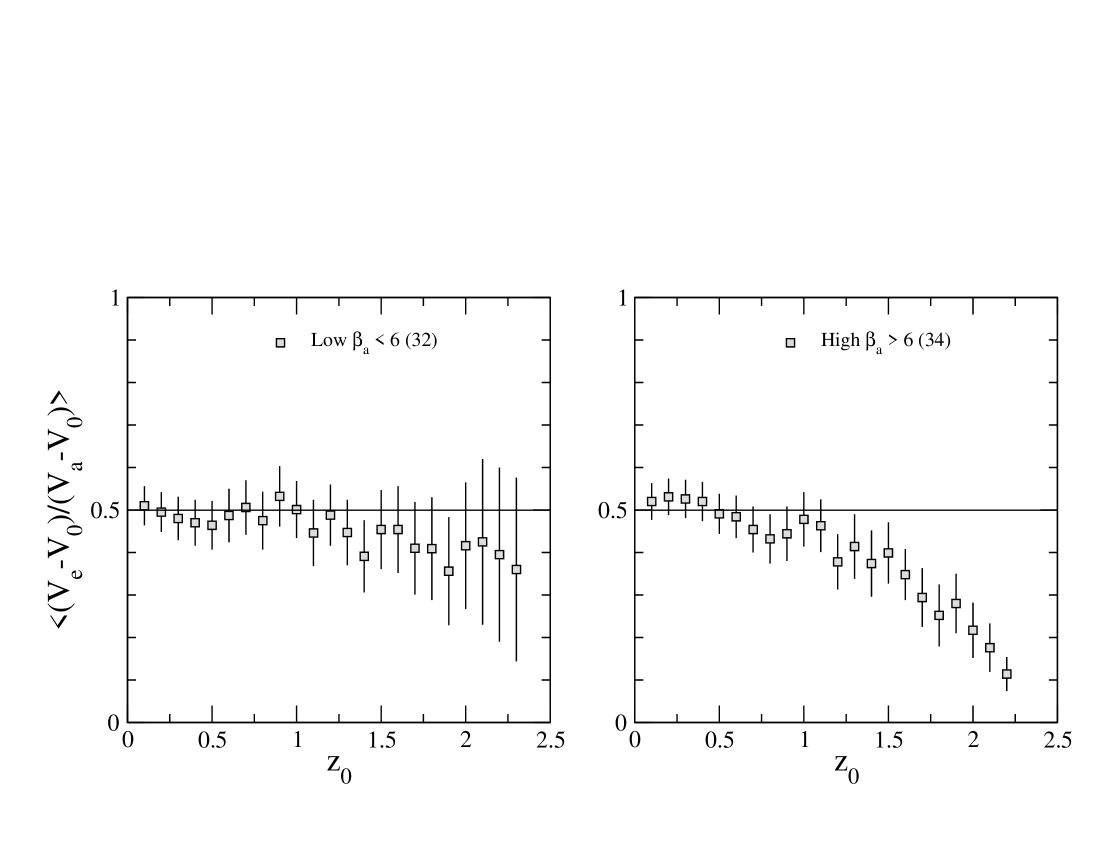
We find that the evolution of flat-spectrum quasars depends strongly on the speed of the jet. Relatively slow jets (, see Fig. 5) do not show significant evolution up to (Fig. 10), whilst the population of fast jets grows rapidly between and and remains at no evolution level at small redshifts. As discussed in Sect. 4.2.1, the missed quasars with no values should populate randomly the samples of high- and low-speed quasars and hence it is unlikely that their exclusion will introduce the observed differential evolution of quasars with high and low speeds. For a given apparent luminosity the population of slow jets should have brighter intrinsic luminosities than those of slow jets. This hints that there should be two distinct populations of quasars, one with fast jets and low intrinsic luminosities which forms at later epochs and undergoes a strong evolution up to and one with slow jets and high intrinsic luminosities formed at much earlier cosmic epochs and evolving slowly to present time. A dual population model consisting of an old population of slowly evolving low speed jets and young population of strongly evolving fast jets at may produce an apparent ‘negative evolution’ of seen at (Fig. 5). In this scenario, the positive evolution of the apparent speed at (Fig. 5) is mainly due to young population of high speed quasars.
5 Conclusions and discussions
The principal results of statistical analysis of bright flat-spectrum compact AGN from the flux-limited MOJAVE sample are: (a) the distribution of 133 AGN is uniform on the sky; (b) the slope of the source counts of radio sources is aligned with the slopes of source counts of independent high radio frequency surveys suggesting that the MOJAVE is a complete flux-limited sample; (c) Lorentz factors of the jets of quasars lie in the range from to and Doppler factors of the jets are distributed between and with the realistic upper limit on for the MOJAVE sample; (d) the mean apparent transverse speed of jets of quasars (or the mean Lorentz factor) increases by a factor of two (from 6.5 to 14) with increasing redshift up to and then gradually decreases at high redshifts by a factor of 2.5; (e) the intrinsic luminosities of compact jets are distributed in the range from to and their intrinsic radio luminosity function is flat () at low luminosities and becomes steeper () at high luminosities; (f) the weak positive evolution of quasars is evident at low redshifts, , and a statistically significant redshift cut-off is present at ; (g) the cosmological evolution is different (1) for high- () and low-luminosity quasars () suggesting that their evolution depends strongly on luminosity, and (2) for fast and slow jets, which indicates the existence of two distinct populations of quasars one with slow jets () and high intrinsic luminosities which does not show a significant evolution with redshift and one with and low intrinsic luminosities having a pronounced redshift cut-off at .
The differential evolution of the population of fast and slow jets at may explain inconsistent results obtained for a redshift cut-off of quasars sampled at high and low radio frequencies (Dunlop & Peacock 1990; Willott et al. 2001) with former one providing no evidence for any decline in the comoving space density. If slow jets reside in high luminosity FRII radio sources and fast jets produce faint FRII structures, which are too weak to be detected at 151 MHz, then the low-frequency sample will include the population of quasars with low jet speeds which do not show significant evolution up to (Fig. 10). The population of fast jets, however, will be included in the high frequency samples because of highly beamed emission of the jet. This naturally explains the redshift cut-off of quasars sampled at 1.4 GHz, 2.7 GHz (Dunlop & Peacock 1990; Cirasuolo et al. 2005; Wall et al. 2005) and significant redshift cut-off at found for our sample (Figs. 9,10).
Acknowledgements.
The authors thank Christian Wolf and members of the MOJAVE team, Marshall Cohen, Dan Homan, Ken Kellermann, Yuri Kovalev and Matt Lister for comments and useful discussions, and the referee for constructive suggestions which significantly improved the paper. TGA is grateful to the Alexander von Humboldt Foundation for the award of a Humboldt Post-Doctoral Fellowship.References
- Avni & Bahcall (1980) Avni, Y., & Bahcall, J. N. 1980, ApJ, 235, 694
- Avni & Shiller (1983) Avni, Y., & Schiller, N. 1983, ApJ, 267, 1
- Barthel (1989) Barthel, P. D. 1989, ApJ, 336, 606
- Boyle et al. (1988) Boyle, B. J., Shanks, T., & Peterson, B. A. 1988, MNRAS, 235, 935
- Cirasuolo et al. (2005) Cirasuolo, M., Magliocchetti, M., & Celotti, A. 2005, MNRAS, 357, 1267
- Dunlop & Peacock (1990) Dunlop, J. S., & Peacock, J. A. 1990, MNRAS, 247, 19
- Fanaroff & Riley (1974) Fanaroff, B. L., & Riley, J. M. 1974, MNRAS, 167, 31P
- Fan et al. (2001) Fan, X., Narayanan, V. K., Lupton, R. H., et al. 2001, AJ, 122, 2833
- Grimes et al. (2004) Grimes, J. A., Rawlings, S., & Willott, C. J. 2004, MNRAS, 349, 503
- Jackson & Wall (1999) Jackson, C. A., & Wall, J. V. 1999, MNRAS, 304, 160
- Hasinger (2004) Hasinger, G. 2004, Nuclear Physics B Proc. Supp., 132, 86
- Infante (1994) Infante, L. 1994, A&A, 282, 353
- Kellermann et al. (1998) Kellermann, K. I., Vermuelen, R. C., Zensus, J. A., & Cohen, M. H. 1998, AJ, 115, 1295
- Kellermann et al. (2004) Kellermann, K. I., Lister, M. L., Homan, D. C. et al., 2004, ApJ, 609, 539
- Lister & Homan (2005) Lister, M. L., & Homan, D. C. 2005, AJ, 130, 1389
- Lister (2003) Lister, M. L. 2003, ApJ, 599, 105
- Lister & Marscher (1997) Lister, M. L., & Marscher, A. P. 1997, ApJ, 476, 572
- Longair (1966) Longair, M. S. 1966, MNRAS, 133, 421
- Longair & Scheuer (1970) Longair, M. S., & Scheuer, P. A. G. 1970, MNRAS, 151, 45
- Osmer & Smith (1970) Osmer, P. S., & Smith, M. G. 1980, ApJS, 42, 333
- Peacock et al. (1981) Peacock, J. A., Perryman, M. A. C., Longair, M. S., Gunn, J. E., & Westphal, J. A. 1981, MNRAS, 194, 601
- Peebles (1980) Peebles, P. J. E. 1980, The large-scale structure of the universe, Princeton University Press, 435
- Scheuer (1987) Scheuer P. A. G., 1987, Superluminal Radio Sources, Cambridge University Press, Cambridge, ed. J.A. Zensus J., T. Pearson, p. 104.
- Schmidt (1969) Schmidt, M. 1969, ApJ, 151, 393
- Schmidt et al. (1991) Schmidt, M., Schneider, D. P., & Gunn, J. E. 1991, The Space Distribution of Quasars, ed. D. Crampton, ASP CS-394
- Silverman et al. (2005) Silverman, J. D., Green, P. J., Barkhouse, W. A., et al. 2005, ApJ, 618, 123
- Taylor et al. (2001) Taylor, A. C., Grainge, K., Jones, M. E., et al. 2001, MNRAS, 327, L1
- Wall et al. (1980) Wall, J. V., Pearson, T. J., & Longair, M. S. 1980, MNRAS, 193, 683
- Wall et al. (2005) Wall, J. V., Jackson, C. A., Shaver, P. A., Hook, I. M., & Kellermann, K. I. 2005, A&A, 434, 133
- Willott et al. (1998) Willott, C. J., Rawlings, S., Blundell, K. M., & Lacy, M. 1998, MNRAS, 300, 625
- Willott et al. (2001) Willott, C. J., Rawlings, S., Blundell, K. M., et al. 2001, MNRAS, 322, 536
- Wills & Lynds (1978) Wills, D., & Lynds, R. 1978, ApJS, 36, 317
- Ueda et al. (2003) Ueda, Y., Akiyama, M., Ohta, K., & Miyaji, T. 2003, ApJ, 598, 886
- Urry & Padovani (1991) Urry, C. M., & Padovani, P. 1991, ApJ, 371, 60
- Urry & Padovani (1995) Urry, C. M., & Padovani, P. 1995, PASP, 107, 803
- Urry & Shafer (1984) Urry, C. M., & Shafer, R. A. 1984, ApJ, 280, 569
- Vermeulen & Cohen (1994) Vermeulen, R. C., & Cohen, M. H. 1994, ApJ, 430, 467
- Zensus et al. (2002) Zensus, J. A., Ros, E., Kellermann, K. I., et al. 2002, AJ, 124, 662