Optical observations of Be/X-ray transient system KS 1947+300
Abstract
ROTSE-IIId observations of the Be/X-ray transient system KS 1947+300 obtained between September 2004 and December 2005 make it possible to study the correlation between optical and X-ray activity. The optical outburst of 0.1 mag was accompanied by an increase in X-ray flux in 2004 observations. Strong correlation between the optical and X-ray light curves suggests that neutron star directly accretes from the outflowing material of Be star. The nearly zero time lag between X-ray and optical light curves suggests a heating of the disk of Be star by X-rays. No optical brightening and X-ray enhancement was seen in 2005 observations. There is no indication of the orbital modulation in the optical light curve.
keywords:
stars: individual (KS1947+300) - stars: Be - stars: circumstallar matter - stars: pulsars: individual (GRO J1948+32)nil@astroa.physics.metu.edu.tr
1 Introduction
The transient X-ray source KS 1947+300 was discovered in 1989 through observations of the GC 2023+338 field (Borozdin et al. 1990). After its discovery Grankin et al. (1991) and Goranskij et al. (1991) identified an optical counterpart which shows H emission line in its spectrum. Negueruela et al. (2003) derived a spectral type B0Ve for the optical companion and a distance of 10 kpc. Considering this distance, the peak X-ray luminosity during the 2000-01 outburst was erg/s (typical for Be/X-ray transients during the Type II outburst). The equivalent width of H line remained almost the same during their one year observation period. They mentioned that the occurrence of several weaker X-ray outbursts has not been reflected in any change in the intensity of H line. They explained this fact with a low inclination angle of the system. Galloway et al. (2004), analyzing their observations obtained with the instruments aboard RXTE (the ASM, PCA, HEXTE), found that neutron star revolves in a nearly circular orbit (e = 0.033) with orbital period 40.415 d and projected semimajor axis 137 lt-s, based on the modulations of neutron star’s pulse period of (Chakrabarty et al. 1995) during the 2000-01 outburst. They reported an increase in neutron star period indicating that the angular momentum was effectively transferred from the accreted material on to the neutron star which required an extended disk. They did not find eclipses in their data. TsygankovLutovinov (2005) estimated the magnetic field strength of the pulsar as G and distance to the binary as kpc. This system occupies the region of Be/X systems in the Pspin- Porb diagram (Reig et al. 2004).
2 Observations and Results
Our CCD observations were obtained between MJD 53255 (September 7, 2004) and MJD 53718 (December 14, 2005) using 45 cm ROTSE-IIId robotic telescope located at Bakırlıtepe, Turkey. It operates without filters and has a wide passband which peaks at 550 nm (Akerlof et al., 2003). ROTSE magnitudes were calculated by comparing all the field stars to USNO 2.0 R-band catalog. About 1000 CCD frames which have an exposure time of 5 s were analyzed following the procedure described in Kızıloğlu et al. (2005) and Baykal et al. (2005). This system has right ascension and declination of and , respectively.
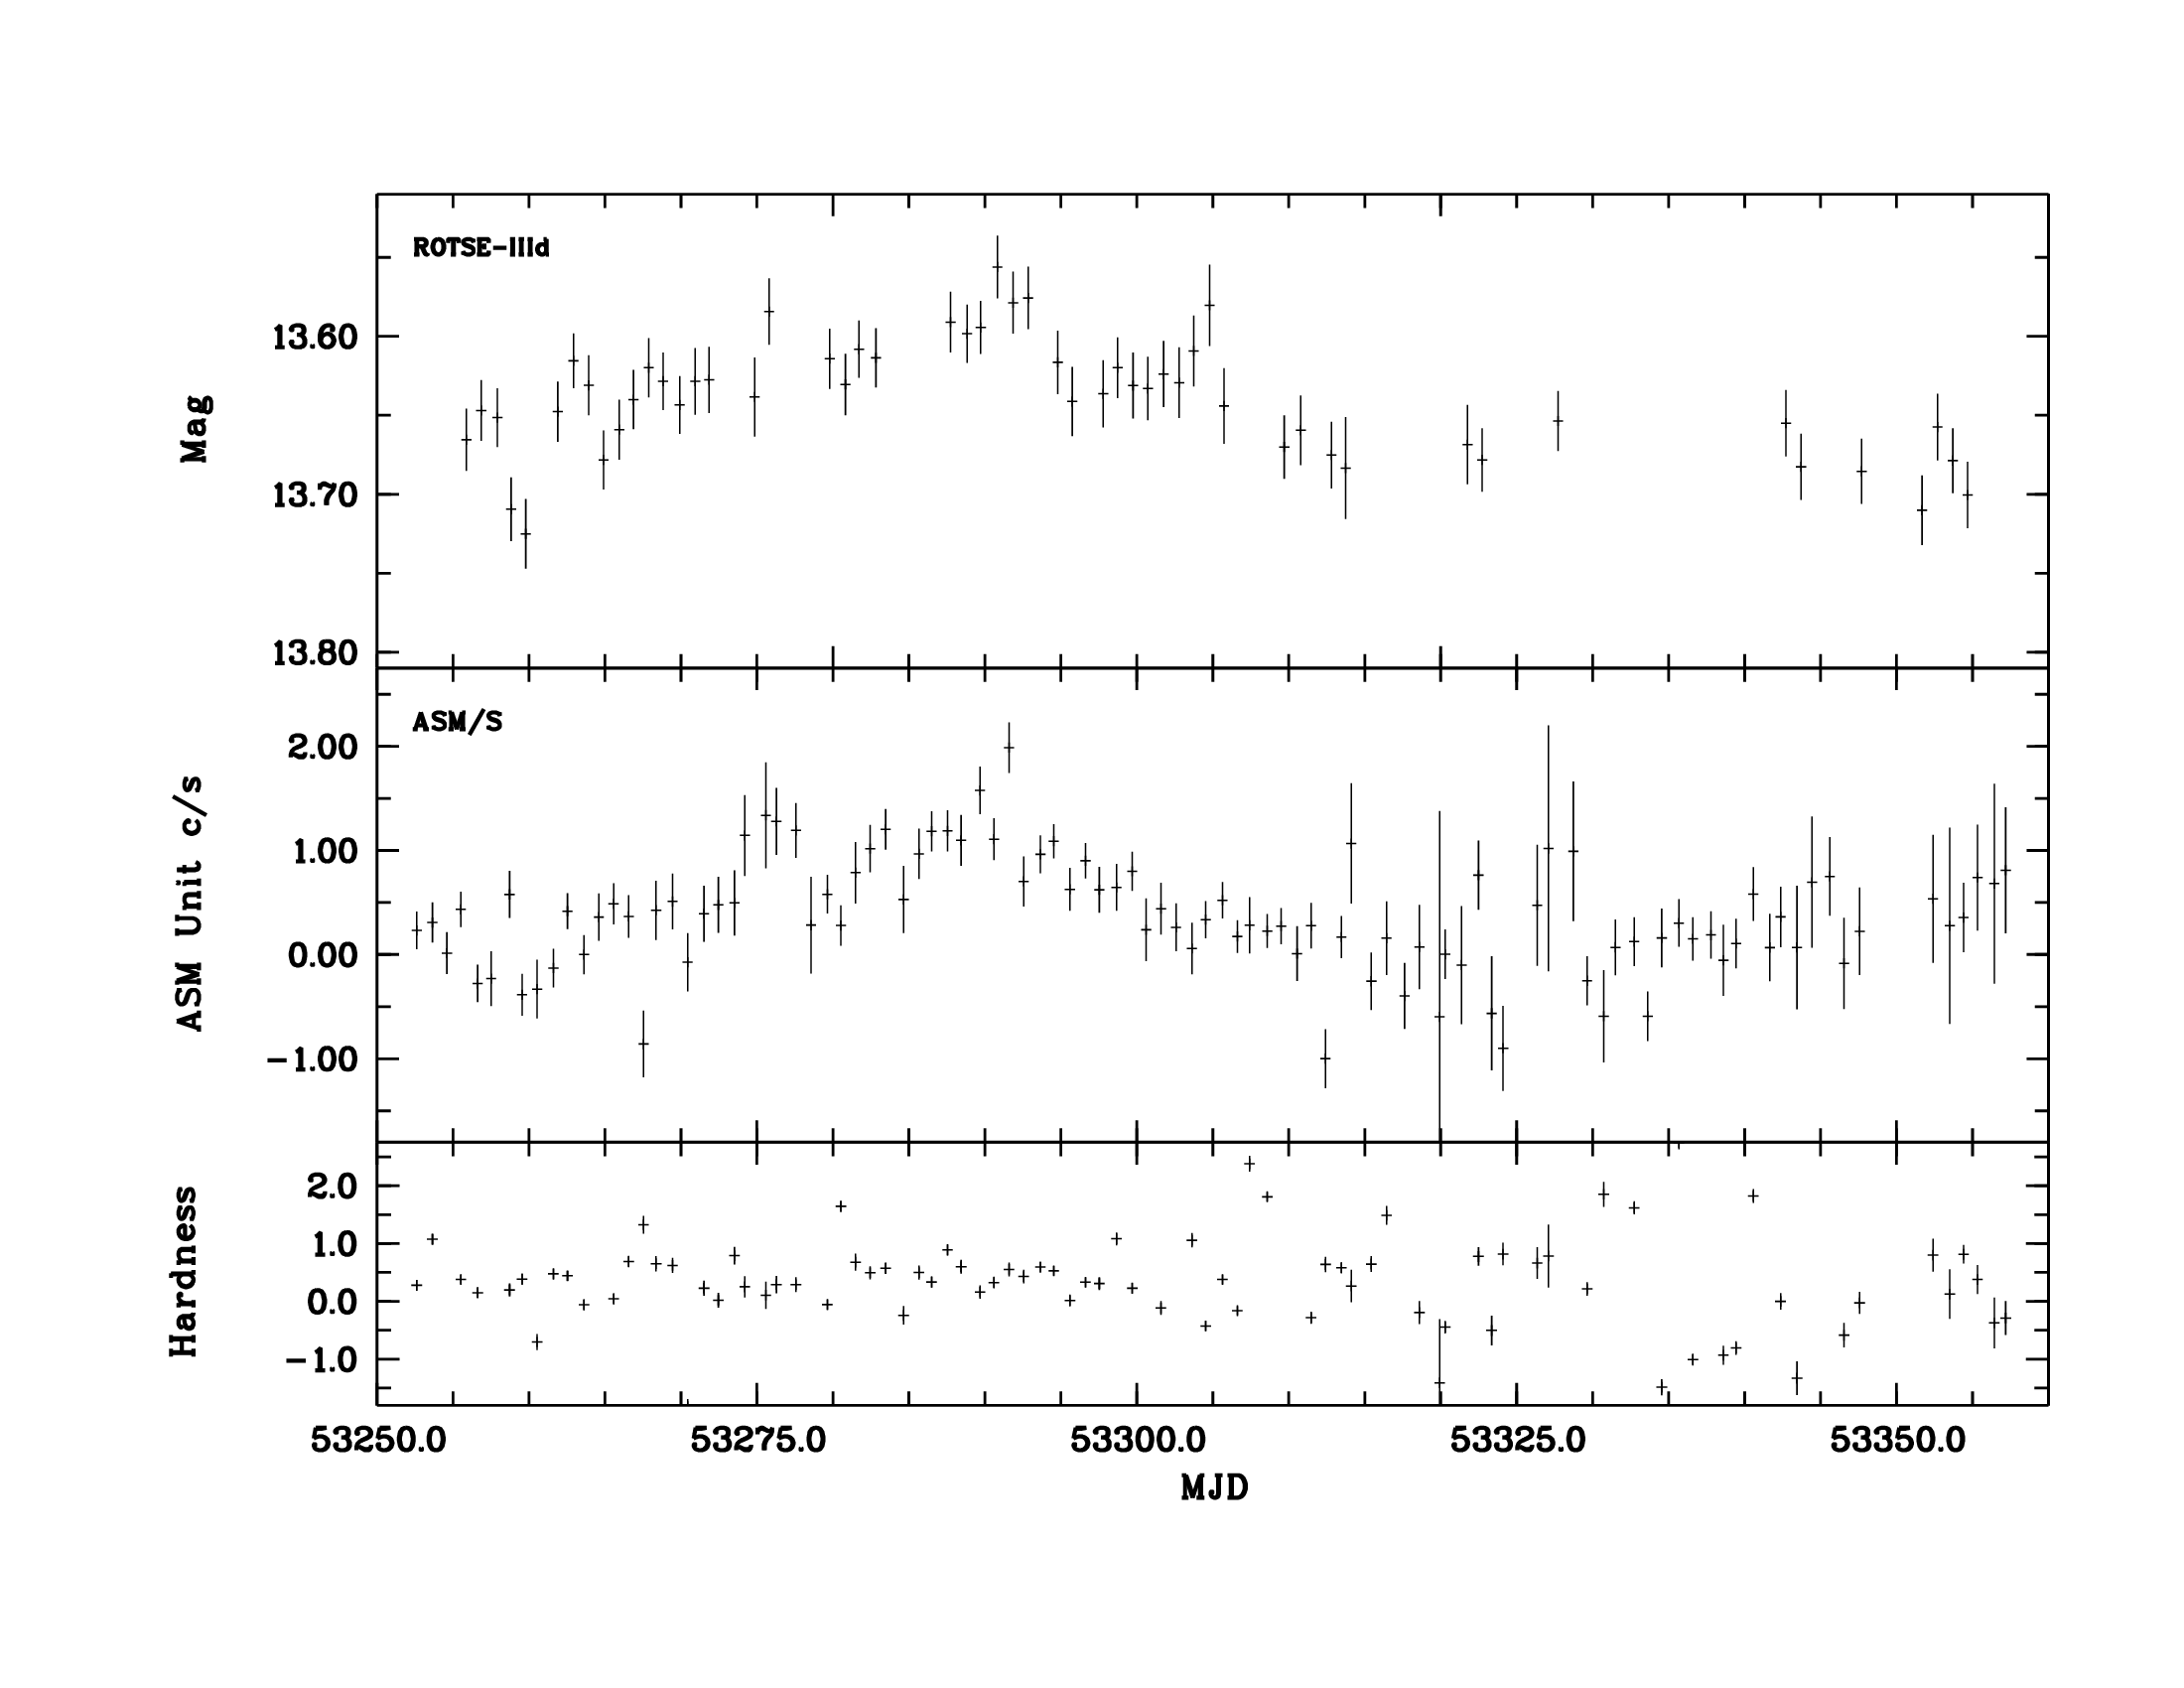
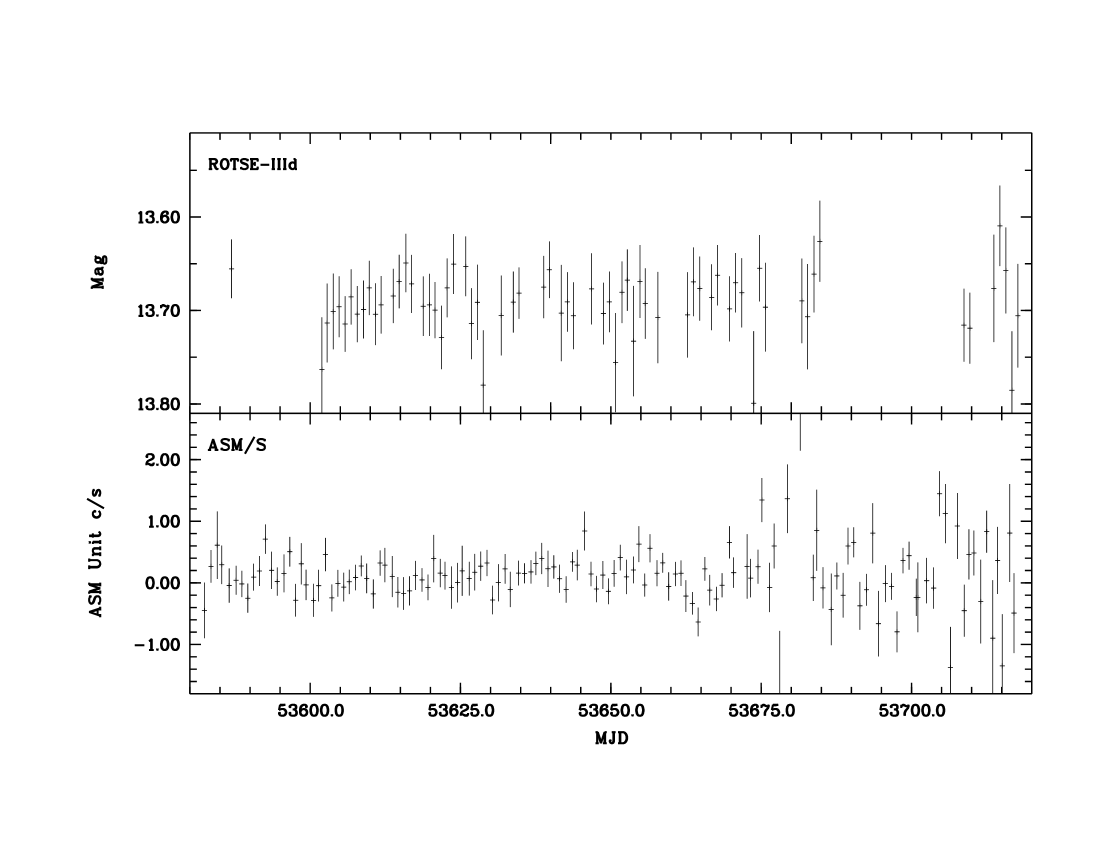
Figures 1 and 2 show the long time optical observations of Be/X-ray transient system KS 1947+300 for the first time. Fig. 1 shows the optical outburst like behavior of this system for the data obtained in 2004. Fig. 2 shows the optical data for the year 2005. On the same figures the X-ray light curves in ASM Unit c/s (daily average of 1.5- 12 keV energy band) of this system which was detected with the All-Sky-Monitor (ASM) aboard RXTE are plotted. An increase of 0.1 mag in optical magnitude is seen in Fig. 1 accompanied by an increase in X-ray flux. Both curves show a similar trend. A change in the measured magnitude of Be star is reflected in the change in X-ray flux. This similarity between optical and X-ray light curves is not seen clearly when only the low energy band of ASM data (1.5-3.0 keV) was considered. During optical and X-ray excess the hardness ratio of the higher energy bands (3.0-5.0 and 5.0-12.0 keV) did not show any notable change. In 2005, both light curves are seen nearly constant during the optical observation period. There is no significant magnitude change in the optical light curve and likewise no enhancement in the X-ray light curve.
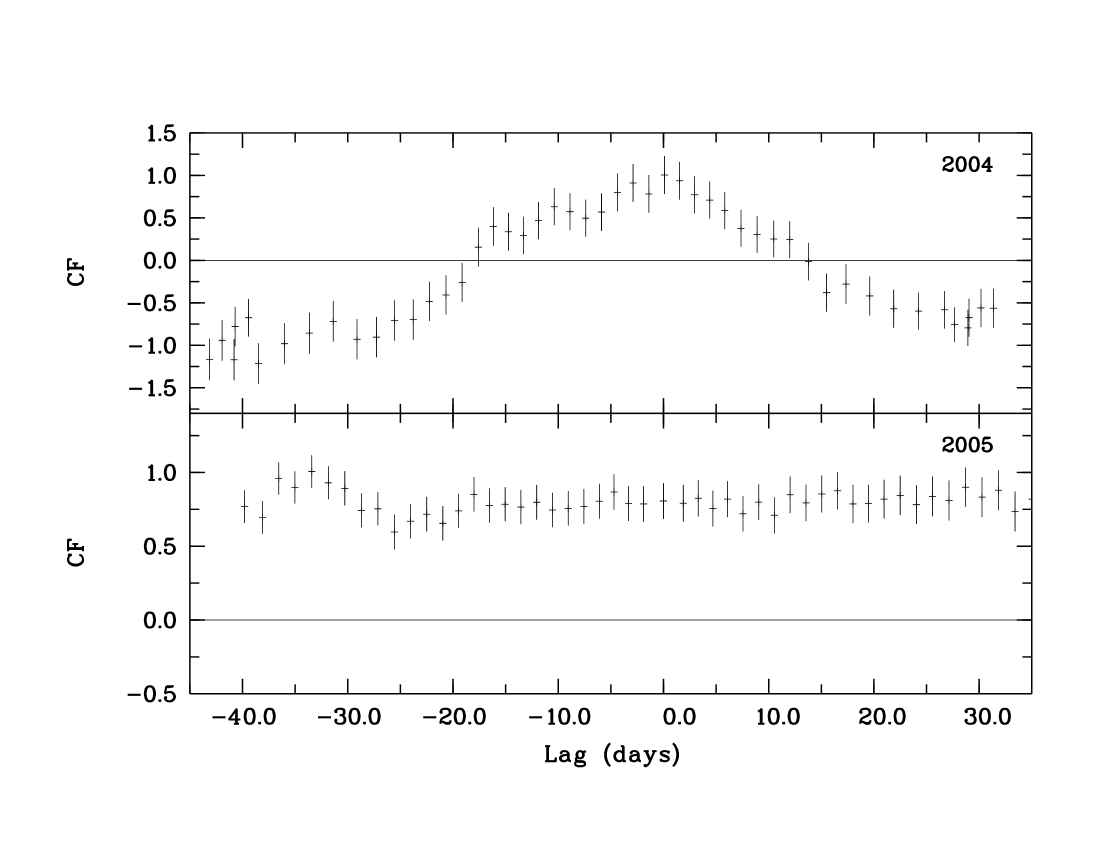
A classical correlation analysis (Oppenheim and Schaffer 1975) was used to test for correlated/time-lagged changes in X-ray and optical light curves. The classical correlation function is defined as
where is the expectation value of the two time series lagged with respect to each other. and are the standard deviations of each time series. The time series and the CF are properly normalized such that at the autocorrelation of a single time series is unity. Fig.3 is plot of the cross-correlation between optical and X-ray light curves. A very strong correlation exists between the optical and X-ray light curves for the 2004 data. The correlation which is centered on a nearly zero time-lag, starts days before and lasts days. Correlated X/optical data suggests that neutron star directly accretes from the outflowing material of Be star. The 2005 data indicates that both optical and X-ray time series are not correlated for all time-lags.
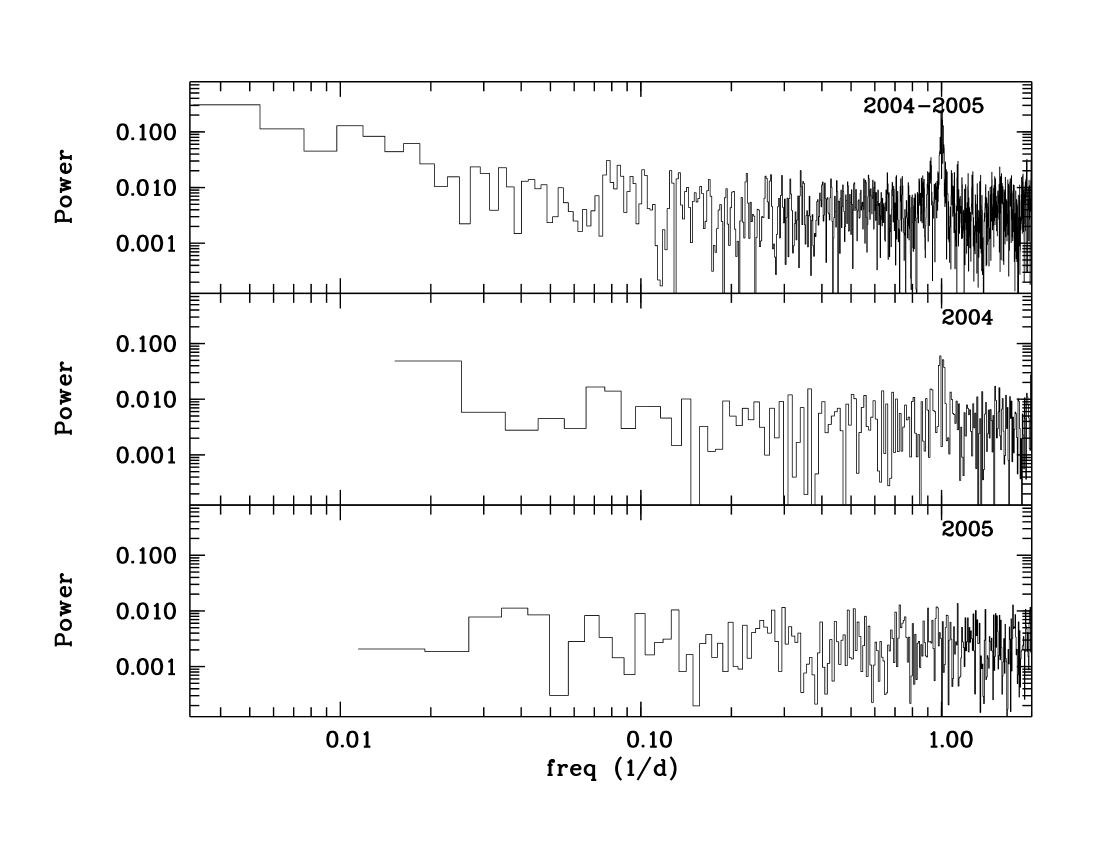
In Fig.4 we present timing analysis for the ROTSE-IIId light curve. Barycentric corrections were made to the time series by using JPL DE200 ephemerides prior to the timing analysis. The power spectrum build from all ROTSE-IIId data (Sep 2004 - Dec 2005) by using Scargle method (Scargle 1982) did not show any pronounced frequency. The power at the frequency 1 d-1 is the effect of nightly observations as expected. We could not find any indication of the orbital period modulation of KS1947+300. However there seems to be a red noise behavior for the frequencies lower than 0.07 d-1. The slope of the red noise spectrum is , where is the frequency in d-1.
Middle panel in the Fig. 4 is the power spectrum calculated for the 2004 ROTSE-IIId data. It is the same time interval that a correlation between X-ray and optical light curves is seen. Again no apparent modulation can be recognized. Although orbital modulation is not expected in such a short observation span, other short time scale modulations are also absent. No significant period is detected. An indication of a red noise feature seen in 2004 - 2005 data is also present for the frequencies lower than d-1. The power spectrum for the 2005 observations shown in the lower panel of Fig. 4 also does not show any specific periodic behavior. The red noise feature is absent.
3 Discussion
Start time of our observations (MJD 53255) corresponds to the orbital phase of 0.42 which is calculated using Tπ/2 = 51985.31 MJD from Galloway et al. (2004) (Tπ/2 is the epoch at which the mean longitude is /2 ). Maximum of brightness occurs at 0.25 orbital phase. Magnitude change lasts about 70-80 d. The brightening and fading phases have similar time durations. If the magnitude change is attributed to the disk around Be star then the disk is lost in about 70-80 d. Hanuschik et al. (1993), in their study of H outburst of Cen, propose that the outburst is caused by the ejection of photospheric matter into bound orbits forming a short lived (less than 100 d) quasi stable Keplerian disk. They did not find close relation between H emission activity and photometric data. Negueruela et al. (2003) observed almost no change in the strength of the H line (equivalent width: 15 A) during their one year observation period which begins one month after the 2000-01 X-ray outburst. They argued that if Be star disk was lost then the strength of H line should fade away. It seems that the long period of X-ray activity in 2000-01 period and likewise remaining relatively constant the strength of H line oppose to the possibility of a short lived disk during this period. It is less likely to have short lived disk in this system.
The circular orbital velocity of X-ray component is 74 km/s according to the orbital parameters given by Galloway et al (2004). Using the orbital parameters of KS 1947+300, Galloway et al., (2004) estimated the mass function as fx= 1.71 M⊙. For a neutron star of mass 1.4 M⊙, the mass of optical component is 3.4 M⊙ when the inclination angle i=90o. Since we did not see eclipses either from RXTE/ASM or ROTSE observations, we assumed that inclination angles should be less than 85o. If we assume masses of 15 and 20 M⊙ for the optical component the inclination angles are found as 28o and 26o, respectively. The corresponding Roche Lobe radii are 73 and 83 R⊙ which are much larger than the expected radius of B0V star. It is difficult to explain the X-ray outburst of this system by mass transfer from Be star through the inner Lagrangian point of Roche Lobe. In the truncated viscous disk model (OkazakiNegueruela 2001) the tidal torques on neutron star truncates the disk effectively in systems with low eccentricity therefore preventing the development of an extended and steady disk. It is difficult to explain the behavior of Be disk in this system with the viscous disk model.
The maximum X-ray luminosity obtained from ASM data (Fig.1) during our 2004 observation period is erg/s which is calculated using the definition in Galloway et al. (2004) (1 count/s erg/s/cm2 in the energy range 1.5-12 keV). This luminosity is typical for TypeI outburst but its duration is longer than the typical value for TypeI outburst. The derived accretion rate on to the neutron star is calculated as M⊙/yr. It is known that the mass loss rate derived is in the order of M⊙/yr for Be stars (Waters et al. 1987, Clark et al. 1999). Clark et al. (1999) find a mass loss rate of 1.5-9 M⊙/yr for the Be/X-ray binary A0535+26. Hanuschik et al. (1993) calculated the typical mass transfer rate during the H outburst of Cen (B2IV-Ve star) which lasted a few days as M⊙/yr. Such equatorial mass loss rates from Be star can produce the observed X-ray luminosity for KS 1947+300.
The increase in optical luminosity of the system is calculated erg/s using the value of Mv =-4.2 (Vacca et al. 1996). This increase can be explained as a heating of Be star equatorial disk by X-rays. The nearly zero time lag between X-ray and optical light curves suggests this result. The X-ray emission from the neutron star is absorbed in the stellar wind and equatorial disk of the Be star and reprocessed into the optical wavelengths (Kriss et al. 1983, Mendelson and Mazeh, 1991).
Acknowledgements.
This study was supported by TUG (Turkish National Observatory), TUBİTAK. We acknowledge support from The Scientific and Technological Research Council of Turkey through project 106T040. ROTSE is a collaboration of Lawrence Livermore National Lab, Los Alamos National Lab, and the University of Michigan (http://www.rotse.net).References
- [1] Akerlof, C.W., Kehoe, R.L., McKay, T.A., Rykoff, E.S., Smith, D.A., et al.: 2003, PASP , 115, 132
- [2] Baykal, A., Kızıloğlu, U., Kızıloğlu, N.: 2005, IBVS, No:5615
- [3] Borozdin, K., Gilfanov, M., Sunyaev, R., Churazov, E., et al.: 1990, PAZh., 16, 804
- [4] Chakrabarty, D., Towsian, K., Lars, B., Thomas, A.P.: 1995, ApJ , 446, 826
- [5] Clark, J.S., Lyuty, V.M., Zaitseva, G.V., Larionov, V.M., Larionova, L.M., et al.: 1999, MNRAS , 302, 167
- [6] Galloway, D.K., Morgan, E.H., Levine, A.M.: 2004, ApJ , 613, 1164
- [7] Grankin, K.N., Shevchenko, V.S., Yakubov, S.D.: 1991, PAZh., 17, 991
- [8] Goranskij, V.P., Esipov, V.F., Lyutyi, V.M., Shugarov, S.Y.: 1991, SvAL , 17, 399
- [9] Hanuschik, F.W., Dach, S.J., Baudzus, M., Thimm, G.: 1993, A&A , 274, 356
- [10] Mendelson, H., Mazeh, T.: 1991, MNRAS , 250, 373
- [11] Kızıloğlu, U., Kızıloğlu, N., Baykal, A.: 2005, AJ , 130, 2766
- [12] Kriss, G.A., Cominsky, L.R., Remillard, R.A., William, G., Thorstensen, J.R.: 1983, ApJ , 266, 806
- [13] Nequeruela, I., Israel, G.L., Morco, A., Norton, A.J., Speziali, R.: 2003, A&A , 397, 739
- [14] Okazaki, A.T., Nequeruela, I.: 2001, A&A , 377, 161
- [15] Oppenheim, A. V., and Schaffer, R. W.: 1975, Digital Signal Processing (Prentice Hall: New Jersey).
- [16] Reig, P., Nequeruela, I., Fabregat, J., et al.: 2004, A&A , 421, 673
- [17] Scargle, J.D., 1982, ApJ , 263, 835
- [18] Tsygankov, S.S., Lutovinov, A.A.: 2005, AstL , 31, 88
- [19] Vacca, W.D., Garmany, C.D., Shull, J.M.: 1996, ApJ , 460, 914
- [20] Waters, L.B.F.M., Cote, J., Lamers, H.J.G.L.M.: 1987, A&A , 185, 206