The nature of damped Lyman and sub-damped Lyman absorbers
We present arguments based on the measured abundances in individual damped Lyman systems (DLAs) and sub-damped Lyman systems (sub-DLAs), and also the average abundances inferred in large samples of QSO absorption line systems, to suggest that the amount of dust in intervening QSO absorbers is small and is not responsible for missing many QSOs in magnitude limited QSO surveys. While we can not totally rule out a bimodal dust distribution with a population of very dusty, metal rich, absorbers which push the background QSOs below the observational threshold of current optical spectroscopic studies, based upon the current samples it appears that the metallicity in QSO absorbers decreases with increase in H I column densities beyond cm-2. Thus the sub-DLA population is more metal rich than the DLAs, a trend which may possibly extend to the non-damped Lyman limit systems (NDLLS). Based on the recently discovered mass-metallicity relation for galaxies, we suggest that most sub-DLAs and possibly NDLLS, are associated with massive spiral/elliptical galaxies while most DLAs are associated with low mass galaxies. The sub-DLA galaxies will then contribute a larger fraction of total mass (stellar and ISM) and therefore metals, to the cosmic budget, specially at low redshifts, as compared to the DLAs.
Key Words.:
Quasars: absorption lines—ISM: abundances, dust, extinction1 Introduction
Damped Lyman systems (DLAs), having column density of H I (N) cm-2 have been suggested to be the high-redshift analogs of disks of nearby luminous galaxies. In spite of having a high amount of neutral hydrogen these absorbers have very little H2 (Ledoux et al. 2003), which raises questions about their being associated with high star formation activity. A large fraction of DLAs do indeed appear to have low star formation rates based on deep emission-line imaging searches (e.g. Kulkarni et al. 2006a and references therein). Metallicity measurements, using intermediate to high resolution observations, are available for 100 DLAs. These indicate that the metallicity evolution of DLAs is weak; most of the DLAs, even at are found to be metal poor (Kulkarni et al. 2005). It is thus possible that the DLAs may not trace the bulk of star formation in the Universe and therefore may not be among the leading metal carriers.
Compilation of observed metallicities of individual DLA systems shows a trend of decreasing abundance with increasing H I column density (Boisse et al. 1998; Akerman et al. 2005; Meiring et al. 2006a). The trend possibly exists to lower H I column densities covering the sub-DLAs, having N between 1019 and cm-2 (Péroux et al. 2003). A similar conclusion was drawn by York et al. (2006, hereafter, Y06) based on the average abundances inferred from the composite spectra of sub-samples drawn from a sample of 809, intervening Mg II QSO absorption line systems (rest equivalent width of 2796 0.3 Å and 1 1.86) compiled from the Sloan Digital Sky Survey (SDSS) Data Release 1 (DR1). The sub-sample with highest estimated (near solar) Zn metallicity, was found to have a low average inferred N of cm-2. Several arguments were given in Y06 to suggest that the DLAs may not be the analogs of the local bright galaxies, rather, the sub-DLAs and possibly the non-DLA Lyman limit systems (NDLLS) with N between 1017 and 1019 cm-2 may be associated with large galaxies. Here we consider this scenario further, using the currently available data on individual absorbers and the results of Y06. We consider various selection effects at work and discuss the implications of the recently established mass-metallicity relation for the nature of DLAs and sub-DLAs.
In section 2 we study the dependence of the Zn abundance on the column density of H I, for the observations of individual systems taken from the literature and for the average values of these quantities obtained by Y06 for large samples. We present other relevant observational information and discuss the obscuration threshold and other selection effects to argue for the reality of the observed dependence. The implication of this dependence for the nature of the absorbing galaxies are presented in section 3 and conclusions are presented in section 4.
2 Dependence of metallicity on the neutral hydrogen column density
2.1 Observational data
The number of metallicity measurements of individual sub-DLAs has grown considerably since the compilation of Péroux et al. (2003). We have compiled a sample (the literature sample, hereafter TLS) of all the measurements of Zn abundance of DLAs and sub-DLAs from the literature. This sample consists of 119 DLAs with and 30 sub-DLAs with . The DLA Zn sample is based on our recent HST, MMT, and VLT data (Khare et al. 2004; Kulkarni et al. 2005; Meiring et al. 2006a,2006b; Péroux et al. 2006b) and those from the literature (data compiled in Kulkarni et al. 2005, and more recent data from Rao et al. 2005; Akerman et al. 2005; Ledoux et al. 2006). For the sub-DLAs, we compile the data from Lu et al. (1995, 1996); Pettini et al. (1994, 1999, 2000); Kulkarni et al. (1999); Ellison & Lopez (2001); Srianand & Petitjean (2001); Dessauges-Zavadsky et al. (2003); Khare et al. (2004); Péroux et al. (2006a); Ledoux et al. (2006); and Meiring et al. (2006a,2006b). The DLA sample contains 68 detections and 51 limits, while the sub-DLA sample contains 13 detections and 17 limits. Most of these limits are at high redshifts. The full sample used here is given in Kulkarni et al (2006b).
In Fig. 1, we have plotted [Zn/H], as a function of N for TLS. The trend of decreasing abundance with increasing N is clear. The Spearman rank correlation test gives the probability of chance correlation to be 1.6 . It can be seen from the figure that the trend is similar for systems with and .
We note that we have only used Zn abundances in Fig.1. There have been studies which use the Si and S abundances in systems where Zn abundances are not available due to observational limitations. We, however, refrain from using these as (i) given the intrinsically higher abundance and higher strengths of the detectable absorption lines of these elements, line saturation effects may be important, leading to an underestimate of their abundances; (ii) Si may be depleted on the dust grains (up to -1.4 dex in cold ISM); (iii) the lines of Zn II are detectable to lower redshifts; and (iv) lines of S are often in the Lyman forest.
As noted in the last section, Y06 inferred the average abundances of various elements in the composite spectra of several sub-samples of SDSS DR1 QSOs with strong Mg II absorbers. The sub-samples were chosen on the basis of various properties of the absorption line systems and QSOs. The column densities of several species, including Zn II, were estimated from inverse variance-weighted, arithmetic mean, normalized spectra of individual QSOs in the samples. The geometric mean composite spectra of the same sub-samples were compared with similar spectra of matching (in emission redshifts and i magnitudes) samples of QSOs without absorption lines in their spectra, to determine the absorber rest frame extinction, . The column densities of neutral hydrogen were estimated by assuming the Small Magellanic cloud (SMC) dust-to-gas ratio, as the SMC extinction law was found to fit the composite extinction curves well. In Fig. 1 we have plotted the results for various sub-samples of Y06. Note that we have used all the sub-samples from Table 1 of Y06 for which the relevant data were available, some of which were not listed in their Table A4. Details of their sub-samples which are used here are given in Table 1. The trend of metallicity dependence on N is similar to that in TLS, the Spearman rank correlation test for Y06 points gives the probability of chance correlation to be 0.098. We have included the main sample (#1) of Y06 in our analysis. As the rest of the sub-samples are drawn from this, its inclusion may cause some bias. We have verified that removing this sample has very little effect on the correlation noted above.
Data for individual DLAs show a trend of increasing depletion of Cr with respect to Zn, and thus, higher dust-to-metal ratio, for higher metallicity (Ledoux et al. 2003; Akerman et al. 2005; Meiring et al. 2006a). We have confirmed that a similar trend is shown by the results of Y06. Other distributions, e.g. [Cr/Zn] vs. log(N) and [Cr/Zn] vs. log(N) are also similar for Y06 and TLS, showing that the results of Y06, which are average values for large samples, are consistent with the observations of individual systems.
We note that the Y06 results are based on the assumption of a constant dust-to-gas ratio. This ratio may depend on metallicity in view of the anticorrelation between [Cr/Zn] and [Zn/H] (and in view of Fig.2 below). We have tried to estimate the effect of this on the relation between [Zn/H] and N, obtained by Y06, as follows. We assumed that the abundance of Zn, (XZn) is proportional to N. Thus which is proportional to XN will be proportional to N, giving N. Note that the Y06 results assume . For different values of , we determined N from the values, using the above relation. Using this value of H I column density we determined [Zn/H] and then the slope of the best fit line between [Zn/H] and Log(N). Note that by construction, this slope should equal . We found that for positive values of the slope remains negative for and beyond that remains until . For negative values of the slope is somewhat smaller than the assumed value of and comes close to it (-0.94) for . Thus we see that assumption of a metallicity dependent dust-to-gas ratio, in fact, makes the decrease of Zn abundance with N even steeper (slope -0.9) than that (slope = -0.45) found for the assumption of constant-dust-to-gas ratio (Fig. 1).
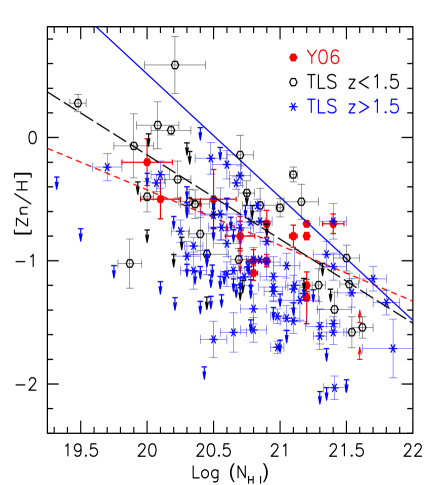
From an earlier version of this diagram (Fig. 1), with 37 points, including limits, Boissé et al. (1998) noted the trend of decreasing abundance with increasing N (their Fig. 19; hereafter, the Boissé plot). They interpreted this as being due to the observational limitations in detecting weak Zn II lines at the low N end and an obscuration bias (caused by dimming of the QSOs, by the dust in the absorbers, below the limit of magnitude limited surveys) towards the high N end, causing a dearth of points in the lower left and upper right corners of the plot respectively. Boissé et al. (1998) proposed an obscuration threshold at N cm-2 (above which the background QSO may be rendered invisible by dust obscuration), shown as a solid (blue) line in our Fig. 1. This was only an empirical limit based on the sample used by Boissé et al. (1998). It is thus not surprising that a few systems (with ) in Fig. 1 do lie above this threshold. Most of these systems were observed recently by Khare et al. (2004), Meiring et al. (2006a,2006b) and Péroux et al. (2006a, 2006b) and many of them have strong Mg II and/or Fe II lines in the SDSS spectra of the QSO’s. Recently, Herbert-Fort et al. (2006) have reported the presence of two metal strong systems (with ) in SDSS DR3, having Zn II column density greater than the obscuration threshold (SDSS1610+4724, log(N)=13.4 and SDSS1709+3258, log(N)=13.19) and have estimated that % of the SDSS-DR3 DLA population with in QSOs with have similar Zn II column densities.
| Sample | Selection Criteriona | Number | Log(N)b | Log(N)c | |
|---|---|---|---|---|---|
| (SMC) | number | of systems | |||
| 0.002 | 24 | 0.2 | 698 | 12.4 | 20.0 |
| 0.003 | 23 | W2.0 | 558 | 12.2 | 20.1 |
| 0.006 | 9 | 1.3127 | 404 | 12.4 | 20.4 |
| 0.007 | 5 | 1.53W1.91 | 139 | 12.6 | 20.5 |
| 0.009 | 11 | i19.12 | 398 | 12.4 | 20.6 |
| 0.010 | 13 | 0.103 | 405 | 12.3 | 20.7 |
| 0.011 | 12 | i19.12 | 411 | 12.4 | 20.7 |
| 0.011 | 14 | 0.103 | 404 | 12.5 | 20.7 |
| 0.012 | 26 | W2.5, 0.2 | 97 | 12.5 | 20.7 |
| 0.013 | 1 | Full sample | 809 | 12.3 | 20.8 |
| 0.014 | 16 | W/W0.577 | 369 | 12.4 | 20.8 |
| 0.018 | 6 | 1.91W2.52 | 132 | 12.8 | 20.9 |
| 0.019 | 20 | Fe II 2374 present | 392 | 12.5 | 20.9 |
| 0.031 | 7 | 2.52W5.0 | 134 | 12.9 | 21.1 |
| 0.032 | 8 | W2.0 | 251 | 12.6 | 21.2 |
| 0.034 | 17 | W/W1.538 | 85 | 12.5 | 21.2 |
| 0.034 | 19 | Fe II 2260 present | 58 | 13.0 | 21.2 |
| 0.036 | 21 | Zn II-Mg I 2026 present | 83 | 13.1 | 21.2 |
| 0.058 | 22 | Zn II-Cr II 2062 present | 31 | 13.3 | 21.4 |
| 0.081 | 25 | 0.2 | 111 | 12.7 | 21.6 |
| 0.085 | 27 | W2.5,0.2 | 48 | 12.4 | 21.6 |
a For selection from the full sample (sample 1) b Estimated from equivalent widths in composite spectra after correction for blends c Estimated from E(B-V) assuming a constant dust-to-gas ratio d The difference between the actual colours of QSOs and the median colours of QSOs at that redshift (Richards et al. 2003) e Rest equivalent width of Mg II 2796 in Å f i magnitude of the QSO g Relative velocity w.r.t. the QSO h Rest equivalent width of Fe II 2382 in Å i Rest equivalent width of Al II 1670 in Å j Rest equivalent width of Mg I 2852 in Å
2.2 Establishing the reality of the observed trend
In this section we present some relevant observational facts and discuss the known selection effects to suggest that the Boissé plot may indeed not be affected by these and that the trend of decreasing abundance with increasing N may be real.
We first discuss the observed extinction in QSOs and point out that it is much smaller than that observed in typical Milky Way sight lines and may not cause significant dimming of the background QSOs.
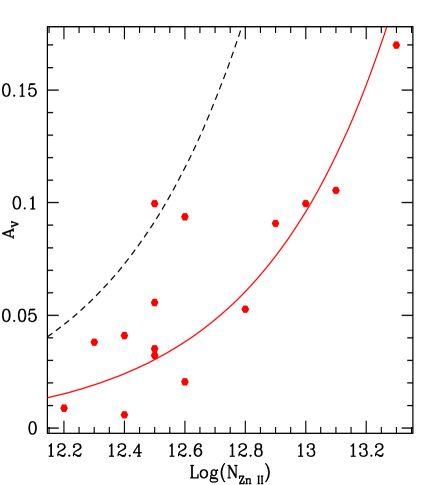
Vladilo & Péroux (2005) have shown that the extinction AV is proportional to N for Milky Way sight lines. Their relation is plotted in Fig. 2. Also plotted is a similar relation obtained for the sub-samples of Y06. It can be seen that a correlation does exist between AV and N for QSO absorbers but that the average extinction per Zn ion in the these absorbers appears to be smaller than that in Milky way by a factor of three.
The maximum value of found by Y06 for their sub-sample (#27) of most reddened systems was 0.085 while that for the sub-sample (#23) of systems with the rest frame equivalent width of Mg II Å is as low as 0.003. The observer frame AV, for the average redshift of 1.33 for their samples, assuming a 1/ extinction law, is thus smaller than 0.6 and 0.02, respectively for the two samples. These values suggest that the dust obscuration by the absorbers observed towards the SDSS QSOs, may not be very important and may not cause significant decrease in the brightness of the QSOs. A similar conclusion is drawn by Murphy & Liske (2004) from the analysis of spectral energy distributions of QSOs with DLAs at in the SDSS DR1. Ellison et al. (2005a) found no significant difference between the B-K colours of radio selected QSOs with and without DLAs, indicating that dust obscuration is not very important.
Below we discuss other indirect evidence indicating that dust obscuration is not significant in QSOs.
Wolfe et al. (2005), from the observed depletion pattern of elements, estimated the fraction of dust obscured QSOs to be 10%. Schaye (2001; also see Zwaan & Prochaska 2005) has shown that there is an upper limit of 1022 cm-2 on the neutral hydrogen column densities of DLAs because of conversion of H I to H2 and not because of dust obscuration. Herbert-Fort et al. (2006) have presented several arguments against the obscuration bias at redshifts , most importantly, one based on the magnitude distribution of the parent QSOs of metal strong systems.
Samples 11 and 12 of Y06 had i magnitude smaller/larger than 19.1. Coincidently, this is the cutoff for the SDSS targeting algorithm. Thus the bright sample consists of QSOs which should be unreddened to enter into the SDSS QSO catalog while the faint sample consists of candidates which were observed (and found to be QSOs) on the basis of their being X-ray sources, radio sources etc. Thus one would expect the faint sample to be more reddened. However, both samples have similar values of and similar distribution of values. Thus there is no evidence for higher extinction in faint SDSS QSOs from the Y06 study. Prochaska et al. (2005) measured 4020% higher gas density in DLAs towards bright QSOs than towards faint QSOs in SDSS DR3 having DLAs (). This is contrary to the obscuration bias and they suggest that gravitational lensing due to DLAs may be important. Vanden Berk et al. (1997) had found a significant excess of C IV systems in bright QSOs and interpreted this to be evidence for gravitational lensing. Some of these C IV systems could however be intrinsic to the QSOs (Richards 2001). Menard (2005) showed that lensing due to intervening Mg II systems with rest equivalent width smaller than 1.5, could brighten QSOs by up to -0.2 magnitudes. Though the two effects (lensing and dust obscuration) have different origins and need to be understood further, the results of Prochaska et al. (2005) indicate that the effects of lensing dominate over obscuration effects that may be present.
The above arguments seem to indicate that dust obscuration is not important even in faint QSOs in the SDSS sample. We, however, note that all these arguments are based on samples of optically selected QSOs and can only apply if the dust content in QSO absorbers has a continuous distribution. We note that a few dusty DLAs have been observed (e.g. Junkkarinen et al. 2004; Motta et al. 2002; Wild et al. 2006) but in none of these cases exceeds 0.42. Such values of may push bright QSOs below the cutoff (19.1) of SDSS targeting algorithm but these will still be present in the faint sample of Y06. Some empty fields have been observed in optical observations towards radio QSOs by Jorgenson et al. (2006) which could potentially be obscured by dusty absorbers, though the authors have argued against such a possibility on the basis of the DLA statistics observed in radio selected QSOs.
Some theoretical studies (e.g. Vladilo and Péroux 2005) have argued that up to 30% to 50% of the QSOs may be missed in magnitude limited surveys due to dust obscuration. Smooth-particle-hydrodynamics simulations do need to introduce dust obscuration to explain the observed (low) DLA metallicity (Cen et al. 2003). Our arguments above do not rule out the possibility of a bimodal distribution of dust columns, with a population of dusty absorbers which have pushed the background QSOs below the observational limit of the optical surveys. Though this possibility can only be verified with observations of fainter QSOs, no compelling evidence for such a population is found from the study of metallicity, column density distribution and mass density of H I in DLAs in radio selected samples of QSOs (Akerman et al. 2005; Jorgenson et al. 2006). Their study suggests that the optically selected samples give a fair census of the population of DLA absorbers. It should, however, be noted that these samples are still small and cover redshifts 1.86 only.
From all the above arguments, it seems very likely that not many points in the upper right corner of the Boissé plot are missed due to dust obscuration.
The missing points in the lower left corner of the Boissé plot have been attributed to an artifact of the sensitivity of observations (Boissé et al. 1998). A few systems may indeed be present in this region as seen from the few upper limits there in Fig. 1. However, it may be noted that in the analysis of Y06, solar metallicity was estimated in the sub-sample (#24) of 698 systems with average N of about 1020 cm-2. Most (638) of these systems did not have detectable Zn II lines in their individual SDSS spectra. We note that even a solar metallicity system with N of about 1020 cm-2, may not produce detectable Zn II lines in an individual SDSS spectrum which typically has S/N 10-15 and a 3 detection limit in the observer frame of 0.3 Å. So the absence of Zn II lines in an individual SDSS spectrum does not mean low Zn abundance. The composite spectrum of 698 systems has S/N higher than that in a typical SDSS spectrum by a factor of 25-30, enabling the detection of Zn II lines. In the sub-samples of Y06 (#s 21 and 22) comprised of systems with detectable Zn II and Cr II lines, the metallicity was estimated to be lower than that in the sample of 698 systems. It thus appears that their metallicity measurements, being averages over large samples, are not affected by observational limitations in detecting weak lines. We also note that the average solar metallicity in the sub-sample # 24 can not be an artifact of a possible high metallicity tail of the metallicity distribution in sub-DLAs. The composite spectrum, used for abundance determination is the arithmetic mean of individual spectra. Thus, if 90% of the 698 systems had subsolar abundance with [Zn/H]=-1 and only 10% had solar abundance then, assuming an H I column density of 1020 cm-2 for the systems, the average equivalent width of line of Zn II will be , which will correspond to highly sub-solar abundance of Zn II for this sub-sample as opposed to the solar abundance derived by Y06. It may also be noted that the sub-samples #23 and 24, do have a large number of systems with low N which in principle, could have had low [Zn/H] and could then have been present in the lower left corner of the Boisse plot. Sub-sample #23 which is the sample of systems with W Å, includes all the systems in sub-samples #s 2, 3 and 4 (with W Å, all together 397 systems) which have and thus N cm-2. Similarly sub-ample #24 has 698 systems. Even assuming it has all the systems with W Å (i.e. all the systems not included in sub-amples #s 2, 3 and 4) from the original sample of 809 systems, it will still have systems with N cm-2. However, the high values of the average abundances for these sub-samples suggest that most of these low N systems do not have low abundance and thus do not occupy the lower left corner of the Boisse plot. We also note that it is possible that these two sub-samples do include some DLAs. However, as argued above, the DLAs do not have high abundances and can only reduce the average abundances of the sub-samples, thereby, making the case for higher abundance of sub-DLAs even stronger.
On the conservative side, we point out that even if some points (in TLS) are indeed missing in the lower left region of Fig. 1 due to sensitivity limit of observations, the average metallicity at low N (in TLS) will still be higher than that at high N due to the large number of high metallicity, low N systems that have been observed (assuming the obscuration bias to be absent, as argued above). It thus appears that the sub-DLA metallicity is indeed higher than that of DLAs and is close to the solar value, at low redshifts.
It thus seems very likely, that the observed trend of decreasing abundance with increasing N is not due to selection effects and is real and that DLAs are not among the major metal carriers in the universe. We note that super-solar abundances have been observed in seven sub-DLAs (Pettini et al. 2000; Khare et al. 2004; Prochaska et al. 2006; Meiring et al. 2006b). Near solar abundance has been estimated in one NDLLS (Jenkins et al. 2005). Bergeron et al. (1994), estimated abundances ([X/H]), of several Mg II Lyman Limit systems with low Lyman limit optical depth, with redshifts between 0.1 and 1.1, to be between -0.5 and -0.3 dex. Super-solar abundances have also been estimated for three systems with redshifts between 0.7 and 0.95 (Charlton et al. 2003, Ding et al. 2003; Meseiro et al. 2005) and near-solar abundance has been estimated in one system at redshift of 0.064 (Aracil et al. 2006); all these systems have N cm-2. We however caution that the derived abundance in NDLLS and systems with smaller H I column densities do depend on the details of photoionization calculations.
Having argued above, for the reality of the observed dependence of Zn metallicity on H I column density, below, we consider its implications. In particular, we consider consequences of the hypothesis that the sub-DLAs, and possibly NDLLS, have higher abundances than DLAs and represent a selection of galaxies that are the major metal carriers in the universe.
3 Implications
Recently a mass-metallicity relation has been discovered by several groups. Tremonti et al. (2004), from the imaging and spectroscopy of 53,000 star-forming galaxies at 0.1, found a tight ( dex) correlation between stellar mass and metallicity spanning over 3 orders of magnitude in stellar mass and a factor of 10 in metallicity. Savaglio et al (2005), from a sample of 56 galaxies identified a strong correlation between mass and metallicity at 0.4 1.0. They predict that the generally metal poor DLA galaxies have stellar masses of the order of 108.8 M⊙ (with a dispersion of 0.7 dex) from =0.2 to =4. Erb et al. (2006) have obtained a mass-metallicity relation in a sample of 87 galaxies at 2.26 which is similar to the relation for local galaxies (Tremonti et al. 2004) except for an offset of 0.3 dex in metallicities, indicating that galaxies of a given mass have lower metallicity at high redshift. They however, note that the uncertainty in the metallicity offset between the and local galaxies is approximately a factor of 2, about the same as the offset itself. Ledoux et al. (2006) found a correlation between the metallicity and velocity widths of lines of low ionization species over two orders of magnitude in metallicity, at 1.7 4.3. Assuming velocity widths to be a measure of mass, their mass-metallicity relation is consistent with that found for local galaxies by Tremonti et al. (2004). We, however, note that Bouche et al. (2006) found an anticorrelation between halo mass and Mg II 2796 equivalent widths which seems to go against the results of Ledoux et al. (2006).
At low redshifts the metallicity of most DLAs is almost an order of magnitude lower than the solar value, while, as suggested by results of Y06 and those of Kulkarni et al. (2006b), the mean sub-DLA metallicity seems to be close to the solar value. The mass-metallicity relation of Tremonti et al. (2004) would imply stellar masses of about 1011 M⊙ and M⊙ respectively for the sub-DLAs and DLAs. These numbers will be smaller by a factor of 2 if the mass-metallicity relation of Erb et al. (2006) is used. If the stellar metallicity is lower/higher than the gas phase metallicity (as determined by the abundances in DLAs and sub-DLAs) the masses of the DLA and sub-DLA galaxies may be correspondingly lower/higher, however, the ratio of the two masses will not be affected.
We thus propose that the sub-DLAs and DLAs in general represent different types of galaxies. By and large, the sub-DLAs are produced by massive galaxies, with higher metallicity, while the DLAs are produced by less massive galaxies with lower metallicity. A few sub-DLAs may indeed arise from lines of sight which encounter low H I columns through DLA galaxies and therefore, have lower metallicity. These will give rise to points in the lower left region of Fig. 1. Similarly, a few DLAs may arise in lines of sight through sub-DLA galaxies and may have higher metallicities though the probability of this happening may be small. In our Galaxy, for instance, clouds with log(N)20.3 are very small and represent only a tiny part of the cross section of the entire Galaxy.
It has been suggested that the low metallicity found in DLAs is caused by metallicity gradients. Differences between emission line and absorption line metallicities have been observed in a few cases (Chen et al. 2005; Ellison et al. 2005b) but not in others (Schulte-Ladbeck et al. 2005; Bowen et al. 2005). The metallicity gradients in nearby spirals are fairly weak (Bresolin et al. 2004) and can not explain the low metallicity in DLAs with small impact parameters (e.g. Kulkarni et al. 2005). It has been suggested in several studies (e.g. Kauffmann 1996; Das et al. 2001; Zwaan et al. 2005) that DLAs may result for small values of impact parameters while larger impact parameters through the same absorbers may give rise to NDLLS and Lyman forest systems. In this case, abundance gradients can not be invoked to explain lower abundances in DLAs as compared to sub-DLAs/NDLLS. This scenario has also not been verified observationally.
Kulkarni et al. (2006b) have shown that the N weighted mean metallicity for sub-DLAs is a factor of 6 higher than that for DLAs at low redshifts. They estimate that at these redshifts, the contribution of the ISM in sub-DLAs to the cosmic metal budget may be several times that of ISM in DLAs. Prochaska et al. (2006), based on their observations of two metal strong sub-DLAs (Super LLS in their paper) and results from their sub-DLA survey, estimated that the ISM in sub-DLAs may contribute at least 15% to the metal budget of the universe at .
If the galaxies that give rise to sub-DLAs are indeed more massive than the galaxies that give rise to DLAs, as suggested above, then an individual sub-DLA galaxy will contribute more to the stellar mass of the universe than an individual DLA galaxy. Also, in CDM cosmology, as the massive galaxies form by mergers of smaller galaxies which triggers star formation leading to a higher rate of metal production, they are not only expected to show a higher rate of metallicity evolution (as is found by Kulkarni et al. 2006b) but are also expected to contribute more mass at lower redshifts. It is thus possible that the contribution of sub-DLA producing galaxies to the cosmic metal budget at lower redshifts may indeed be considerably higher than 15% (as estimated by Prochaska et al. (2005) at ) and may help alleviate the missing metals problem.
Boissier et al. (2003) compared the observed properties of DLAs with the predictions of simple models of present day disk galaxies and showed that low surface brightness galaxies contribute as much as spirals to the number and H I mass of DLAs. Zwaan et al. (2005) have shown that properties of DLAs are consistent with their forming in galaxies of various morphological types, with 87% of DLA cross-section being contributed by sub-L∗ galaxies. Semi-analytic models indicate sub-L∗ galaxies to be major contributors to DLA cross-section (Okoshi & Nagashima 2005). Thus there seems to be some evidence for a significant fraction of DLAs to be associated with sub-L∗ galaxies.
Deep imaging has shown low redshift DLAs to be often associated with dwarf galaxies (Rao et al. 2003). Le Brun et al. (1997) suggested that the DLA galaxies (which were selected on the basis of a damped Lyman line or 21 cm absorption or a very high Mg II/Fe II ratio) strongly differ from the Mg II selected galaxies, the latter being mostly luminous galaxies with evidence of recent star formation activity. Indeed emission-line imaging searches suggest that a large fraction of DLAs appear to have low star formation rates (Kulkarni et al. 2006a and references therein). Deep imaging of three sub-DLA galaxies at 0.7 shows them to be associated with L L∗, disk/spiral galaxies (Zwaan et al. 2005). Note that the lines of sight through our Galaxy are, statistically speaking, mostly metal rich sub-DLAs with N cm-2, perpendicular to the plane. All these support our hypothesis about the nature of DLA and sub-DLA galaxies. Chen and Lanzetta (2003), however, found the DLA galaxies to have a variety of morphologies. Djorgovski et al. (1996) and Moller et al. (2002, 2004) have observed a few high-redshift (2) absorbing galaxies in Lyman emission and found their properties to be similar to disk/Lyman break galaxies. Chun et al. (2006), using adaptive optics imaging for 4 DLAs and 2 sub-DLAs at 0.5, found most of the candidate absorber galaxies or their companions to have low-luminosity ( 0.1 L∗).
Thus, it seems that the results of some of the DLA and sub-DLA imaging studies are consistent with the hypothesis we make here. More systematic imaging surveys are needed to confirm the ideas presented in this paper. Deep imaging in K-band for absorbers with high abundances at should be able to confirm the presence of massive (red) galaxies, while imaging searches in narrow, optical emission lines should help in confirming that DLAs are mostly dwarf galaxies.
4 Conclusions
We have studied the dependence of metallicity on N in QSO absorbers with N cm-2 and have discussed various selection effects that may be giving rise to the observed trend. We have argued that the selection effects are not important and that the observed trend is real. Our conclusions based on these arguments, and subject to confirmation by future observations, are as follows:
-
1.
The amount of dust in QSO absorbers is small and is not responsible for missing many QSOs in magnitude limited surveys. We can not, however, rule out the possibility of a bimodal distribution of dust columns such that there may exist a population of dusty absorbers which push the background QSOs below the observational threshold of current optical spectroscopic studies and is completely invisible.
-
2.
The metallicity in QSO absorbers with N cm-2, decreases with increase in H I column density of these absorbers. The trend possibly continues to lower H I column densities. The sub-DLAs thus have higher metal abundances as compared to the DLAs at redshifts between 0 and 2.
-
3.
The observed mass-metallicity relation suggests that most DLAs are associated with low mass ( M⊙) galaxies while most sub-DLAs are associated with massive spiral/elliptical galaxies. It is possible that the non-DLA LLS may also be metal rich and may be associated with massive galaxies.
-
4.
The sub-DLA galaxies will contribute a larger fraction of total mass (stellar and ISM) and therefore metals, to the cosmic budget, specially at low redshifts, as compared to the DLAs. The Sub-DLAs and possibly, non-DLA LLS galaxies, may contain a much larger fraction of the metals at than has been appreciated.
-
5.
The few imaging studies, of galaxies responsible for quasar absorption line systems done so far, are ambiguous on the morphology of DLA and sub-DLA galaxies. More systematic, deep imaging in r-band, Ks-band and in narrow emission lines is essential to confirming the inferences of this paper.
Acknowledgements.
PK acknowledges support from the Department of Science and Technology, Government of India (SP/S2/HEP-07/03). VPK and JDM acknowledge support from the U.S. National Science Foundation grant AST-0206197.References
- (1) Akerman, C. J., Ellison, S. L., Pettini, M., & Steidel, C. C. 2005, A&A, 440, 449
- (2) Aracil, B., Tripp, T. M., Bowen, D. V., Proschaska, J. X., Chen, H. W., & Frye, B. L. 2006, MNRAS, 367, 139
- (3) Bergeron, J. et al. 1994, ApJ, 436, 33
- (4) Boissé, P., Le Brun, V., Bergeron, J., & Deharveng, J. M. 1998, A&A, 333, 841
- (5) Boissier, S., Péroux, C. & Pettini, M. 2003, MNRAS, 338, 131
- (6) Bowen, D. V., Jenkins, E. B., Pettini, M., & Tripp, T. M. 2005, ApJ, 635, 880
- (7) Bouché, N., Murphy, M. T., Péroux, C., Csabai, I., & Wild, V. 2006, MNRAS, 371, 495
- (8) Bresolin, F., Garnett, D. R., & Kennicutt, R. C. 2004, ApJ, 615, 228
- (9) Cen, R., Ostriker, J. P., Prochaska, J. X., & Wolfe, A. M. 2003, ApJ, 598, 741
- (10) Charlton, J. C., Ding, J., Zonak, S. G., Churchill, C. W., Bond, N. A., & Rigby, J. R. 2003, ApJ, 589, 111
- (11) Chen, H. W., & Lanzetta, K. M. 2003, ApJ, 597, 706
- (12) Chen, H. W., Kennicutt, R. C., & Rauch, M. 2005, ApJ, 620, 703
- (13) Chun, M. R., Gharanfoli, S., Kulkarni, V. P., & Takamiya, M. 2006, AJ, 131, 686
- (14) Das, S., Khare, P., & Samantray, A. 2001, A&A, 373, 843
- (15) Dessauges-Zavadsky, M., Péroux, C., Kim, T.-S., D’Odorico, S., & McMahon, R. G. 2003, MNRAS, 345, 447
- (16) Ding, J., Charlton, J. C., Churchill, C. W.,& Palma, C. 2003, ApJ, 590, 746
- (17) Djorgovski, S. G., Pahre, M. A., Bechtold, J., & Elston, R. 1996, Nature, 382, 234
- (18) Ellison, S. L., Lopez, S. 2001, A&A, 380, 117
- (19) Ellison, S. L., Hall, P. B. & Lira, P. 2005a, ApJ,
- (20) Ellison, S. L., Kewley, L. J., Mallen-Orleans, G. 2005b, MNRAS, 357, 354
- (21) Erb, D. K., Shapley, A. E., Pettini, M., Steidel, C. C., Reddy, N. A., & Adelberger, K. L. 2006, ApJ, 644, 813
- (22) Herbert-Fort, S., Prochaska, J. X., Dessauges-Zavadsky, M., Ellison, S. L., Howk, C., Wolfe, A. M., & Prochter, G. E. 2006, PASP, 118, 1077
- (23) Jenkins, E. B., Bowen, D. V., Tripp, T. M., & Sembach, K. R. 2005, ApJ, 623, 767
- (24) Jorgenson, R. A., Wolfe, A. M., Prochaska, J. X., Lu, L., Howk, J. C., Cooke, J., Gawaiser, E., & Gelino, D. M. 2006, ApJ, 646, 730
- (25) Junkkarinen, V. T., Cohen, R. D., Beaver, E. A., Burbidge, E. M., Lyons, R. W. & Madejski, G. 2004, ApJ, 614, 658
- (26) Kauffmann, G. 1996, MNRAS, 281, 475
- (27) Khare P., Kulkarni V. P., Lauroesch J. T., York D. G, Crotts P. S., & Nakamura O. 2004, ApJ, 616, 86
- (28) Kulkarni, V. P., Bechtold, J., Ge, J. 1999, in Proc. of ESO Conference on “Chemical Evolution from Zero to High Redshifts”, eds. M. Rosa and J. Walsh, (Springer-Verlag), 275
- (29) Kulkarni, V. P., Fall, S. M., Lauroesch, J. T., York, D. G, Welty, D. E, Khare, P., & Truran, J. W. 2005, ApJ, 618, 68
- (30) Kulkarni, V. P., Woodgate, B. E., York, D. G., Thatte, D. G., Meiring, J. D., Palunas, P., & Wassell, E. 2006a, ApJ, 636, 30
- (31) Kulkarni, V. P., Khare, P., Péroux, C., York, D. G., Lauroesch, J. T., & Meiring, J. D. 2006b, submitted to ApJL, astro-ph/0608126
- (32) Le Brun, V., Bergeron, J., Boissé, P., & Deharveng, J. M. 1997, A&A, 321, 733
- (33) Ledoux, C., Petitjean, P., & Srianand, R. 2003, MNRAS, 346, 209
- (34) Ledoux, C., Petitjean, Fynbo, J. P. U., Moller, P., & Srianand, R. 2006, A&A, 457, 71L
- (35) Lu, L., Savage, B. D., Tripp, T. M., Meyer, D. M. 1995, ApJ, 447, 597
- (36) Lu, L., Sargent, W. L. W., Barlow, T. A., Churchill, C. W., Vogt, S. S. 1996, ApJS, 107, 475
- (37) Maseiro, J. D. R., Charlton, J. C., Ding, J., Churchill, C. W., & Kacprzak, G. 2005, ApJ, 623, 57
- (38) Meiring, J. D., Kulkarni, V. P., Khare, P., Bechtold, J., York, D. G., Cui, J., Lauroesch, J. T., Crotts, A. P. S., & Nakamura, O. 2006a, MNRAS, 370, 43
- (39) Meiring, J. D., Lauroesch, J. T., Kulkarni, V. P., Péroux, C., Khare, P., York, D. G. 2006b, MNRAS, submitted
- (40) Menard, B. 2005, ApJ, 630, 28
- (41) Moller, P., Warren, S. J., Fall, S. M., Fynbo, J. U., & Jakobsen, P. 2002, ApJ, 574, 51
- (42) Moller, P., Fynbo, J. P. U., & Fall, S. M. 2004, A&A, 422, L33
- (43) Motta, V., Mediavilla, E., Muñoz, J. A., Falco, E., Kochanek, C. S., Arribas, S., García-Lorenzo, B., Oscoz, A., & Serra-Ricart, M. 2002, ApJ, 574, 719
- (44) Murphy, M. & Liske, J. 2004, MNRAS, 354, 31
- (45) Okoshi, K., & Nagashima, M. 2005, ApJ, 623, 99
- (46) Péroux, C., Dessauges-Zavadsky, M., D’Odorico, S., Kim, T. S., & McMahon, R. G. 2003, MNRAS, 345, 480
- (47) Péroux, C., Kulkarni, V. P., Meiring, J. D., Ferlet, R., Khare, P., Lauroesch, J. T., Vladilo, G., & York, D. G. 2006a, A&A, 450, 53
- (48) Péroux, C., Meiring, J. D., Kulkarni, V.P., Ferlet, R., Khare, P., Lauroesch, J. T., Vladilo, G., & York, D. G. 2006b, MNRAS, 372, 369
- (49) Pettini, M., Smith, L. J., Hunstead, R. W., King, D. L. 1994, ApJ, 426, 79
- (50) Pettini, M., Ellison, S. L., Steidel, C. C., Bowen, D. V. 1999, ApJ, 510, 576
- (51) Pettini, M., Ellison, S. L., Steidel, C. C., Shapley, A. E., & Bowen, D. V. 2000, ApJ, 532, 65
- (52) Prochaska, J. X., Herbert-Fort, S., & Wolfe, A. M. 2005, ApJ, 635, 123
- (53) Prochaska, J. X., O’Meara, J. M., Herbert-Fort, S., Burles, S., Prochter, G. E., & Bernstein, R. A. 2006, astro-ph/0606573
- (54) Rao, S. M., Nestor, D. B., Turnshek, D. A., Lane, W. M., Monier, E. M. & Bergeron, J. 2003, ApJ, 595, 94
- (55) Rao, S. M., Prochaska, J. X., Howk, C., & Wolfe, A. M. 2005, AJ, 129, 9
- (56) Richards, G. T. 2001, ApJS, 133, 53
- (57) Richards, G. T. et al. 2003, AJ, 126, 1131
- (58) Savaglio, S. et al. 2005, ApJ, 635, 260
- (59) Schaye, J. 2001, ApJ, 562, L95
- (60) Schulte-Ladbeck. R. E., Konig, B., Miller, C. J., Hopkins, A. M., Drozdovsky, I. O., Turnshek, D. A., Hopp, U. 2005, ApJ, 625, L79
- (61) Srianand, R., Petitjean, P. 2001, A&A, 373, 816
- (62) Tremonti, C. A. et al. 2004, ApJ, 613, 898
- (63) Vanden Berk, D. E., Quashnock, J. M., York, D. G., Yanny, B. 1997, ApJ, 469, 78
- (64) Vladilo, G., & Péroux, C. 2005, A&A, 444, 461
- (65) Wild, V., Hewett, P. C., & Pettini, M. 2006, MNRAS, 367, 211
- (66) Wolfe, A. M., Gawiser, E., & Prochaska, J. X. 2005, ARAA, 43, 861
- (67) York, D. G., et al. 2006, MNRAS, 367, 945
- (68) Zwaan, M. A., & Prochaska, J. X. 2006, ApJ, 643, 675
- (69) Zwaan, M. A., van der Hulst, J. M., Briggs, F. H., Verheijen, M. A. W., & Ryan-Weber, E. V. 2005, MNRAS, 364, 1467