Hydrogen and helium line formation in OB dwarfs and giants ††thanks: Based on observations collected at the European Southern Observatory, Chile (ESO N∘ 074.B-0455(A)) and at the Centro Astronómico Hispano Alemán at Calar Alto, operated jointly by the Max-Planck Institut für Astronomie and the Instituto de Astrofísica de Andalucía.,††thanks: Table 1 and Figs. 16–19 are only available in electronic form at http://www.edpsciences.org
Abstract
Aims. Hydrogen and helium line spectra are crucial diagnostic features for the quantitative analysis of OB stars. Hybrid non-LTE line-formation calculations for these elements have not been discussed thoroughly so far, despite their wide use for analyses of metal line spectra. We compute synthetic spectra based on a hybrid non-LTE approach in order to test the ability of these models to reproduce high-resolution and high-S/N spectra of dwarf and giant stars and also to compare them with published grids of non-LTE (OSTAR2002) and LTE (Padova) models.
Methods. Our approach solves the restricted non-LTE problem based on classical line-blanketed LTE model atmospheres. State-of-the-art model atoms and line-broadening theories are employed to model the H and He i/ii spectra over the entire optical range and in the near-IR.
Results. A comparison with published line-blanketed non-LTE models validates the suitability of the LTE approximation for modelling the atmospheric structure of late O to early B-type dwarf and giant stars at metallicities down to (at least) 1/5 solar. Our hybrid non-LTE synthetic spectra simultaneously match almost all measurable hydrogen and helium lines observed in six test stars over a wide spectral range from the Balmer limit to the near-IR, except for only a few well-understood cases. A robust starting point for studies of the metal spectra is thus established. Our approach reproduces other published non-LTE calculations, but avoids inconsistencies in the modelling of the He i singlets. These have recently been discussed in the literature in the context of O-type stars and we show that they persist in the early B-types. Our approach improves on published pure LTE models – widely applied for OB star analyses – in many aspects: non-LTE strengthening and the use of improved line-broadening data result in significant differences in the line profiles and equivalent widths of the Balmer and helium lines. Where possible, systematic effects on the stellar parameter determination are quantified, e.g. gravities derived from the H wings may be overestimated by up to 0.2 dex for dwarfs at our upper temperature boundary of 35 000 K in LTE.
Key Words.:
Line: formation – Line: profiles – Stars: atmospheres – Stars: early type – Stars: fundamental parameters1 Introduction
Massive stars are the main drivers for the dynamical and chemical evolution of the interstellar medium (ISM), and thus for the evolution of entire galaxies. They are important sites of nucleosynthesis and main contributors to the energy and momentum budget of the ISM, as sources of ionizing UV radiation, through stellar winds and their final explosion as supernovae.
Quantitative analyses of O- and B-type stars can provide observational constraints on both stellar and galactochemical evolution. In the first case, information on basic stellar parameters and mixing with nuclear-processed matter (abundances of the light elements) facilitates empirical evaluation of the quality of different evolutionary models (see e.g. Maeder & Meynet MaMe00 (2000)). In the second case, information on the spatial distribution of present-day elemental abundances allows Galactic metallicity gradients to be derived (e.g. Gummersbach et al. Gummersbachetal98 (1998); Rolleston et al. Rollestonetal00 (2000); Daflon & Cunha DaCu04 (2004)) as the basis for galactochemical evolution modelling (e.g. Hou et al. Houetal00 (2000); Chiappini et al. Chiappinietal01 (2001); Cescutti et al. Cescuttietal06 (2006)). Stellar data can hereby complement and independently verify analogous abundance studies of H ii regions (e.g. Shaver et al. Shaveretal83 (1983)). Using the present generation of large telescopes and high-resolution spectrographs, pristine abundances can be derived not only for Galactic early-type stars, but also for objects in the metal-poor environments of the Magellanic Clouds (e.g. Korn et al. Kornetal02 (2002), Kornetal05 (2005); Rolleston et al. Rollestonetal03 (2003); Hunter et al. Hunteretal06 (2006)).
In order to be meaningful, the parameter and abundance determination for individual objects has to be unbiased by systematic error. Early and mid O-type stars pose considerable challenges to model atmosphere analyses, because of sphericity, mass-outflow, and non-LTE line-blocking/blanketing effects. For these reasons the least luminous (but most numerous) massive stars, late O and early B-type (OB) stars (Jaschek & Jaschek jj90 (1990)), have been at the focus of abundance studies for a long time (e.g. Gies & Lambert GiLa92 (1992); Kilian Kilian92 (1992); Cunha & Lambert CuLa92 (1992); and numerous similar studies ever since). Overall, the atmospheres of OB dwarf and giant stars are supposed to be described reasonably well by one-dimensional, plane-parallel, homogeneous, and hydrostatic line-blanketed LTE models in radiative equilibrium. However, this does not imply that quantitative analyses of the spectra of OB dwarfs and giants are trivial.
Most of the published quantitative analyses follow two approaches. Either they are based on pure LTE analyses (e.g. Rolleston et al. (Rollestonetal00 (2000)), and references therein) or they solve the restricted non-LTE problem on prescribed line-blanketed LTE model atmospheres. Typically, metal ions are considered in this case. A simultaneous treatment of H and He is exceptional (e.g. Gummersbach et al. Gummersbachetal98 (1998); Morel et al. Moreletal06 (2006)). A few studies use unblanketed non-LTE atmospheres with subsequent non-LTE line formation (e.g. Rolleston et al. Rollestonetal00 (2000)), and only recently have grids of fully line-blanketed non-LTE models become available (Lanz & Hubeny la-hu03 (2003): concentrating on O-type stars but extending into the B star regime; Dufton et al. Duftonetal05 (2005): concentrating on B-type stars, not publically available). A thorough test of the models regarding their ability to reproduce the H and He spectra via direct comparison with observation throughout the entire visual range and in the near-IR in OB dwarfs and giants covering a broad parameter range has not been published so far (note their availability – at least for subsets of lines – for O stars: Bouret et al. Bouretetal03 (2003); Repolust et al. Repolustetal04 (2004), Repolustetal05 (2005); Mokiem et al. Mokiemetal05 (2005), Mokiemetal06 (2006); Heap et al. Heapetal06 (2006)). Having this kind of test available would help the user of grids to understand the strengths and the limitations of the models. Usually, only one or two hydrogen Balmer lines and selected helium lines in the optical blue are considered in the literature.
Hydrogen and helium are of major interest in the astrophysical context, as they constitute practically all light-emitting plasma. The lines of hydrogen and helium are the strongest spectral features in OB stars. Inasmuch as they are primary diagnostic tools for stellar analyses throughout the Hertzsprung-Russell diagram, they sample the plasma conditions throughout large parts of the stellar atmosphere, to a far greater extent than do the metal lines. However, the information on the temperature and density structure encoded in the spectra has to be interpreted. This is done by comparison with synthetic spectra, which requires that the basic atmospheric structure equations in combination with the radiative transfer problem be solved. The model predictions may differ, depending on the approximations made and on the atomic data used. Their quality can be assessed by their ability to reproduce observation. In the optimum case all observational constraints (continua/spectral energy distribution, line profiles) should be reproduced simultaneously, indicating the absence of systematic error (assuming a unique solution). A thorough reproduction of the hydrogen and helium line spectra should therefore be viewed as a precondition for all further studies.
Non-LTE effects play a dominant rôle in the formation of the hydrogen and helium line spectra in early-type stars, as known since the seminal work by Auer & Mihalas (AuMi72 (1972), AuMi73 (1973)). Despite the enormous progress made over the past thirty years, some notorious problems have remained. Observations in the (near-)infrared provide one key to improving the situation via extension of our observational database to a domain of amplified non-LTE effects (in OB stars). Some of the problems have been related recently to the remaining inaccuracies in the atomic data. Thus, the modelling of the hydrogen Paschen, Brackett, and Pfund series in early-type stars could be improved, resulting in corrections of equivalent widths by as much as a factor 2–3 (Przybilla & Butler przyb-but04 (2004); but see also Repolust et al. Repolustetal05 (2005)). Also, the observed behaviour of the He i 10 830 Å transition in OB dwarfs could be reproduced for the first time (Przybilla przyb05 (2005)). In other cases, the reasons for shortcomings in the non-LTE modelling can be subtler. An example of this is the He i singlet line problem in early-type stars: computations with non-LTE model-atmosphere codes reveal discrepancies not only between theory and observation but also between different theoretical calculations. The overlap of an He i resonance transition with Fe iv lines results in high sensitivity to the model assumptions (Najarro et al. Najarroetal06 (2006)).
The aim of this paper is to evaluate the status of non-LTE line-formation computations for the two most abundant elements in the most common targets of massive star analyses, OB dwarf and giant stars. This work constitutes the basis for further studies of the metal line spectra (e.g. Nieva & Przybilla 2006b , np07 (2007)). First, we test our hybrid non-LTE approach (Sect. 2) thoroughly on high-quality spectra of six stars in the solar vicinity (Sects. 3 & 4). In contrast to typical studies from the literature, we investigate the entire hydrogen and helium line spectra in the optical range, plus some additional near-IR data, taking advantage of our recently improved non-LTE model atoms. After making sure that excellent agreement between theory and observation can be obtained (i.e. also avoiding the aforementioned He i singlet line problem), we compare our modelling with libraries of synthetic fluxes from the literature (Sect. 5). This is done in order to test their suitability for quantitative analyses of OB dwarfs and giants. Such libraries are required for (automatised) analyses of large observational datasets obtained with existing or future multi-object spectrographs (e.g. the VLT-FLAMES survey of massive stars: Evans et al. Evansetal05 (2005); GAIA: Perryman et al. Perrymanetal01 (2001)). It is shown that reliable modelling of the line spectra of the two most basic elements is not straightforward. On the contrary, considerable systematic errors may result for quantitative analyses of OB stars when applying these libraries blindly. Finally, the results of our investigation are discussed (Sect. 6) and the main conclusions summarised (Sect. 7).
2 Model calculations
The hybrid non-LTE approach solves the restricted non-LTE problem on the basis of prescribed LTE model atmospheres. The approach is physically less elaborate than fully self-consistent non-LTE calculations, as more approximations are involved. However, at the same time it is superior to the pure LTE approximation. In particular, it provides an efficient way to compute realistic synthetic spectra in all cases where the atmospheric structure is close to LTE (which puts restrictions on the parameter space coverage). The hybrid non-LTE approach also allows extensive non-LTE model atoms to be implemented, facilitating a highly detailed treatment of the atomic processes involved (e.g. account for the resolved resonance structure in photoionizations, avoidance of the – powerful, however also approximate – superlevel formalism).
We compute line-blanketed, plane-parallel, homogeneous, and hydrostatic LTE model atmospheres using the ATLAS9 code (Kurucz 1993b ). Non-LTE population numbers and synthetic spectra are then obtained with recent versions of DETAIL and SURFACE (Giddings gid81 (1981); Butler & Giddings but_gid85 (1985)). The coupled radiative transfer and statistical equilibrium equations are solved with DETAIL, employing the Accelerated Lambda Iteration (ALI) scheme of Rybicki & Hummer (rh91 (1991)). Synthetic spectra are calculated with SURFACE, using refined line-broadening theories.
The non-LTE model atoms for hydrogen and He i/ii adopted in the present work are described in detail by Przybilla & Butler (przyb-but04 (2004)) and Przybilla (przyb05 (2005)), respectively. Use of improved atomic data for electron impact excitations, in particular from ab-initio computations, allows consistent results from the hydrogen lines in the visual and near-IR to be derived throughout the entire range of early-A to O stars . A 15-level model is used for modelling main sequence stars, as well as a 20-level model for the giants. The He i/ii model atom considers all He i -coupled terms up to the principal quantum number individually, and packed levels up to separately for the singlet and triplet spin system. All levels up to are considered in the He ii model. This model atom has been successfully used to reproduce observed trends of the highly non-LTE-sensitive He i 10 830 Å transition in early-type main sequence stars (Przybilla przyb05 (2005)). The He i/ii model was also employed to analyse the visual/near-IR spectra of extreme helium stars (Przybilla et al. Przybillaetal05 (2005)) and subluminous B stars (Przybilla et al. 2006a ).
Radiative transitions in DETAIL are treated with simplified line broadening formalisms: for transitions between hydrogen levels with approximate Stark-broadening (Griem Griem60 (1960), following the implementation of Auer & Mihalas AuMi72 (1972), Appendix) is considered, while for all other transitions, also in He i/ii, depth-dependent Doppler profiles are assumed. Microturbulence is explicitly accounted for by including the appropriate term in the Doppler width
| (1) |
where is the rest wavelength of the transition, the speed of light, the thermal velocity for the chemical species of interest and the microturbulent velocity. Both continuous absorption and line blocking (via Kurucz’ opacity distribution functions, ODFs, Kurucz 1993a , using the ‘little’ wavelength interval versions) are accounted for as background opacities in solving the radiation transfer. In this regard the hybrid non-LTE approach has an advantage over present-day ‘exact’ non-LTE computations: all species responsible for metal line blocking and blanketing can be considered, though approximately. The ‘exact’ non-LTE methods, on the other hand, are constrained to several abundant light elements and typically iron (and nickel), i.e. only the major line opacity sources are covered. Note that these ODFs were calculated for solar abundances according to Anders & Grevesse (AnGr89 (1989)). The latter have been revised in more recent work such as Grevesse & Sauval (gre_sauv98 (1998)). In particular the reduction of the abundance of iron (the most important line opacity source) by 0.2 dex should be considered. This is done in our work by adopting the Kurucz (1993a ) ODFs for appropriately reduced metallicity; see Sect. 5.1 for further discussion.
| Sco | HR 3055 | HR 1861 | HR 2928 | HR 3468 | HR 5285 | |||||||
|---|---|---|---|---|---|---|---|---|---|---|---|---|
| (K) | 32 000 | 300 | 31 200 | 300 | 27 000 | 400 | 26 300 | 400 | 22 900 | 400 | 21 500 | 400 |
| (cgs) | 4.30 | 0.05 | 3.95 | 0.05 | 4.12 | 0.05 | 4.15 | 0.05 | 3.60 | 0.05 | 4.20 | 0.05 |
| (km s-1) | 5 | 1 | 8 | 1 | 3 | 1 | 3 | 1 | 5 | 1 | 4 | 1 |
| (km s-1) | 4 | 2 | 29 | 4 | 12 | 1 | 14 | 1 | 11 | 3 | 18 | 1 |
| (km s-1) | 4 | 2 | 37 | 8 | … | 20 | 2 | 20 | 2 | … | ||
| (by number) | 0.089 | 0.01 | 0.080 | 0.01 | 0.089 | 0.01 | 0.089 | 0.01 | 0.089 | 0.01 | 0.089 | 0.01 |
The resulting non-LTE populations are then used to compute realistic line profiles with SURFACE. The same microturbulent velocity as in DETAIL and in the model structure computations with ATLAS9 is adopted. In this step of the calculation detailed Stark-broadening data are employed, as summarised in Table 1 (available in the online version). All other important data relevant to line formation are also given there: wavelengths, lower and upper levels involved in the transition, oscillator strengths , their accuracies, and sources.
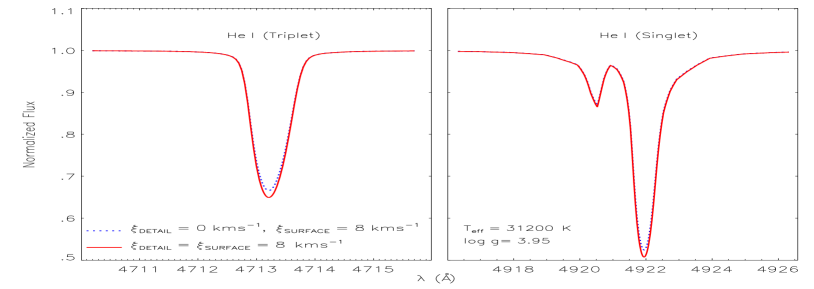
Note that, in typical non-LTE computations for OB stars, microturbulence is only included in the final profile calculation. Our choice is based on test calculations that indicate line-profile fits are improved if microturbulence is also included in computing the level populations. The net effect is a slight strengthening of the lines (Fig. 1). However, the effect is far less pronounced than described by McErlean et al. (McErleanetal98 (1998)), who investigated unblanketed non-LTE models for B-type supergiants at slightly higher microturbulence; cf. their Figs. 3 & 4.
Our hybrid non-LTE approach involving the codes ATLAS9, DETAIL, and SURFACE (henceforth abbreviated ADS) is tested here for early B-type dwarfs and giants, supplemented by LTE computations with ATLAS9 and SURFACE (AS). Our methodology may be applied to a wider range of stellar parameters (i.e. effective temperature and surface gravity ). Line-blanketed, static, and plane-parallel LTE models provide an even more realistic description of stellar atmospheres at lower temperatures and higher gravities (excited He ii states should be ignored at lower in order to avoid numerical inconsistencies). Slightly higher temperatures (late O-types) and lower surface gravities (less-luminous supergiants) may also be covered, until the hybrid non-LTE approach meets its limitations when non-LTE effects on the atmospheric structure and/or hydrodynamic mass-outflow may no longer be neglected.
3 Observational data
We test our analysis technique on six bright Galactic objects in the entire optical range and also for near-IR lines when available. The programme stars sample the parameter space in effective temperature and surface gravity covered by typical applications.
High-S/N Echelle spectra of Sco (HR 6165), HR 3055, HR 1861, HR 2928, HR 3468, and HR 5285 were obtained by M. Altmann using FEROS (Fiberfed Extended Range Optical Spectrograph, Kaufer et al. Kauferetal99 (1999)) on the ESO 2.2m telescope in La Silla. The data reduction was performed within the FEROS context in the ESO MIDAS package, using optimum extraction. The spectra were normalised by fitting a spline function to carefully selected continuum points. This suffices to retain the line profiles of the Balmer lines in these early-type stars. Finally, the spectra were brought to the wavelength rest frame by cross-correlation with an appropriate synthetic spectrum. Of the entire wavelength range covered by FEROS, only the part between 3800 and 8000 Å meets our quality criteria for further analysis. The spectra are compromised by the lower sensitivity of the instrument at shorter wavelengths, and the reduced stellar fluxes in the far red. FEROS provides a resolving power 48 000, with 2.2 pixels per resolution element. An S/N of up to 800 is achieved in . With respect to resolution and signal-to-noise ratio, the spectra available to us are of much higher quality than in typical studies of OB stars, basically excluding observational uncertainties from the error budget.

A supplementary high-S/N spectrum of HR 1861, also covering the higher Paschen series, was obtained using FOCES (Fibre Optics Cassegrain Echelle Spectrograph, Pfeiffer et al. Pfeifferetal98 (1998)) on the Calar Alto 2.2m telescope. The data were processed in a standard way, using the data reduction routines described by Pfeiffer et al. (Pfeifferetal98 (1998)). An 40 000 (2 pixels per resolution element) was achieved. In addition, a high-S/N spectrum in the -band of Sco taken with Subaru/IRCS ( 12 000) is available for analysis; see Hanson et al. (Hansonetal05 (2005)) for details on the observations and data reduction. Finally, a high-S/N spectrum in the 2.058 m region of Sco taken with UKIRT/CGS4 ( 19 000) is also available for analysis (Zaal et al. zaal99 (1999)).
4 Applications to observations
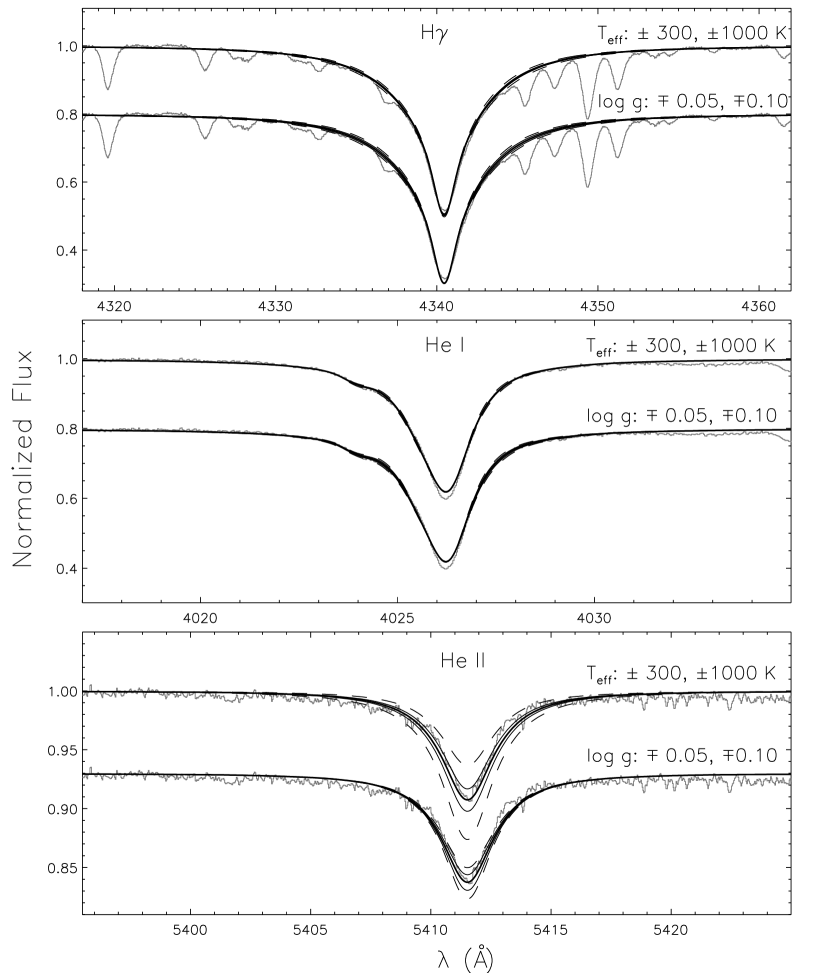
Theoretical profiles were fitted to observations in an iterative procedure summarised in Fig. 2. The final atmospheric parameters and , projected rotational velocities , and micro- and macroturbulent velocities (, ) coincide with those derived in Nieva & Przybilla (2006a ), which are further refined by use of the C ii/iii and C ii/iii/iv ionization equilibria (Nieva & Przybilla 2006b ,c), see Table 2. The impact of stellar parameter variations on non-LTE profile fits to H, He i 4026 Å, and He ii 5411 Å in the hot giant HR 3055 is visualised in Fig. 3. Two values for the parameter variations are adopted, according to our uncertainties of 300 K/0.05 dex in / and typical values from the more recent literature (1000 K/0.10 dex). All other hydrogen Balmer and helium lines react in a similar way. The sensitivity of the hydrogen and He i lines to parameter variations is low, such that the uncertainties cannot be reduced much below the typical values even for high-S/N observations like ours. Only the He ii lines are highly sensitive to changes in and, to a lesser degree, in . However, by taking metal ionization equilibria into consideration (e.g. C ii/iii or C ii/iii/iv), which are even more sensitive than He ii lines, the parameters can be constrained more accurately.
Projected rotational velocities, micro- and macroturbulence values have also been verified by fitting the carbon lines. Note that the comparatively high macroturbulence in HR 3055 amounts to less than twice the sound speed in the atmospheric plasma. The macroturbulent broadening may thus be explained by a pattern of ascending and descending surface elements caused by (higher-order) nonradial oscillations (see e.g. Lucy Lucy76 (1976)). The microturbulence values are typically lower than found in previous work (e.g. Kilian Kilian92 (1992)). Differences in and are also found. Solar helium abundances (by number) are found in all cases.
4.1 Visual
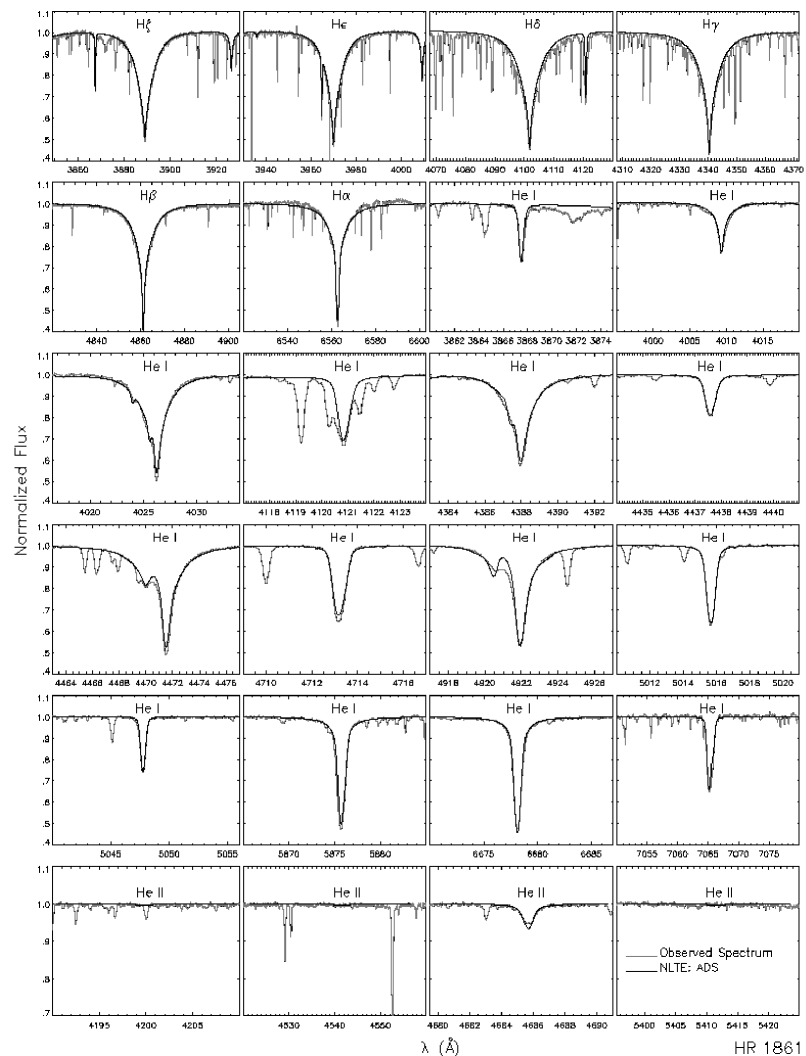
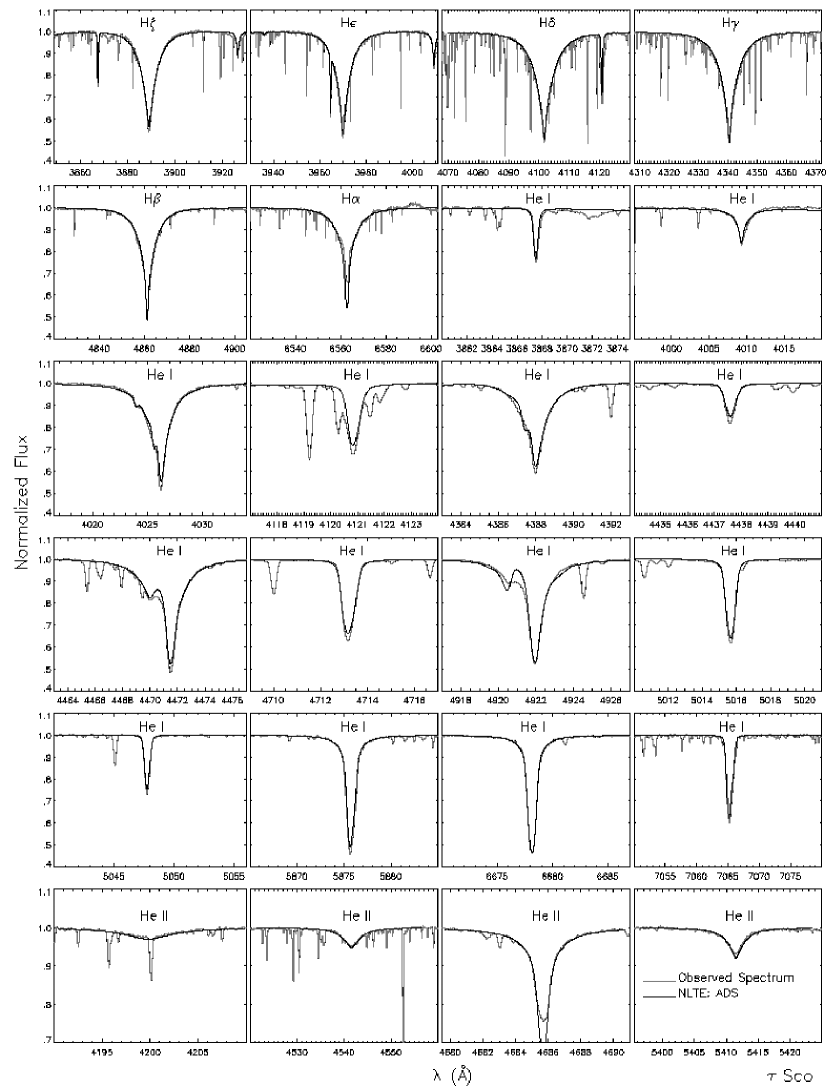
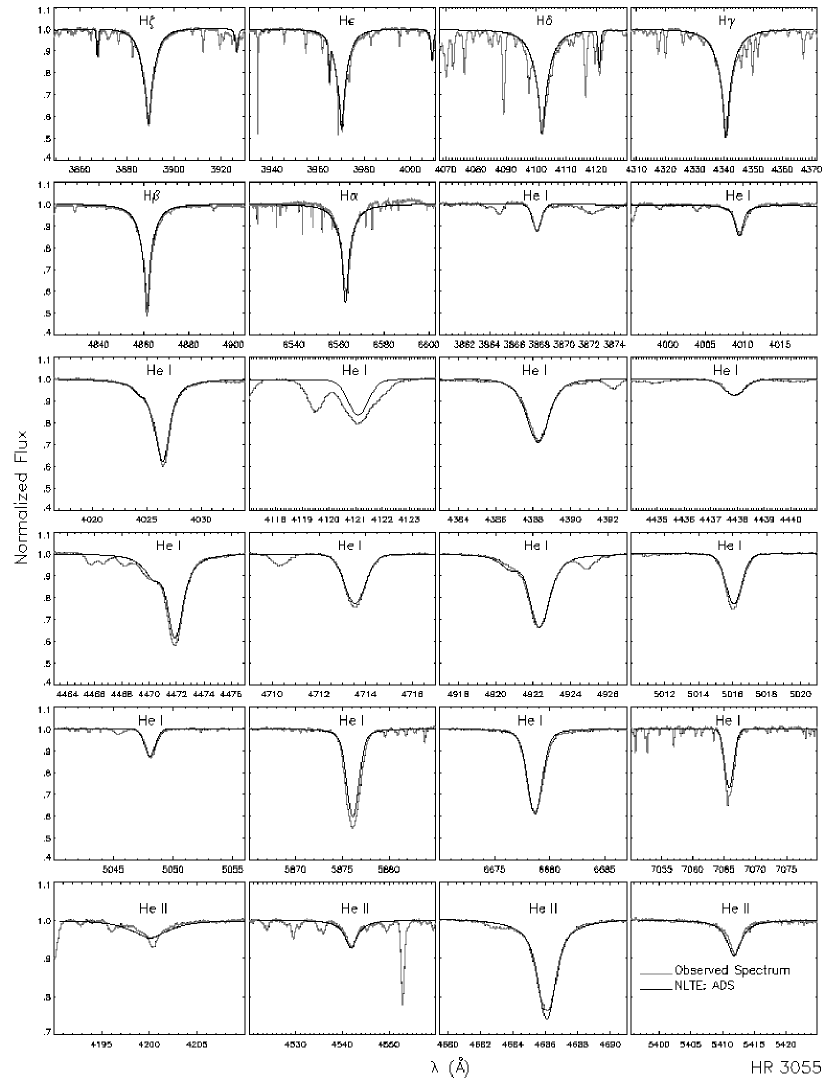
Synthetic profiles for a selection of 6 hydrogen Balmer and 18 He i/ii lines in the visual are compared with observation for the sample stars in Figs. 4 and 5 and in Figs. 16–19 (available in the online edition). They constitute our best simultaneous fits to the measurable H and He lines in the available spectra. Preference for our selection has been given to (mostly) unblended features with good broadening data. A summary of all available lines is given in Table 1, where blending species are also identified. Our hybrid non-LTE approach (ADS) allows us to reproduce the hydrogen Balmer and He i/ii lines in the visual more precisely, with few (well-understood) exceptions. The ionization equilibrium of He i/ii puts tight constraints on in the two hotter stars.
For the hottest dwarf of our sample, Sco, a very good match between model and observation is achieved (Fig. 4), except for the cores of H and He ii 4686 Å. This is because of the neglect of the stellar wind; see Przybilla & Butler (przyb-but04 (2004)) and Mokiem et al. (Mokiemetal05 (2005)) for results of hydrodynamic computations. The discrepancies in He i 4121 Å occur because of blends with metal lines (O ii, C iii, and Fe iii; unaccounted for in our computations), which can be nicely resolved at this low . An improved fit to He i 4921 Å may be obtained with better broadening data for the forbidden component.The spectral region around H suffers from artifacts introduced by CCD defects that can only partially be compensated for in the data reduction process.
Line fits to the hot giant HR 3055 are displayed in Fig. 5. Excellent agreement between theory and observation is also found in this case, with a significantly improved fit quality of H and He ii 4686 Å, because of an apparently weaker wind. This star shows a higher and than Sco. Therefore the He i 4121 Å blend is no longer resolved, leading to an apparently worse fit.
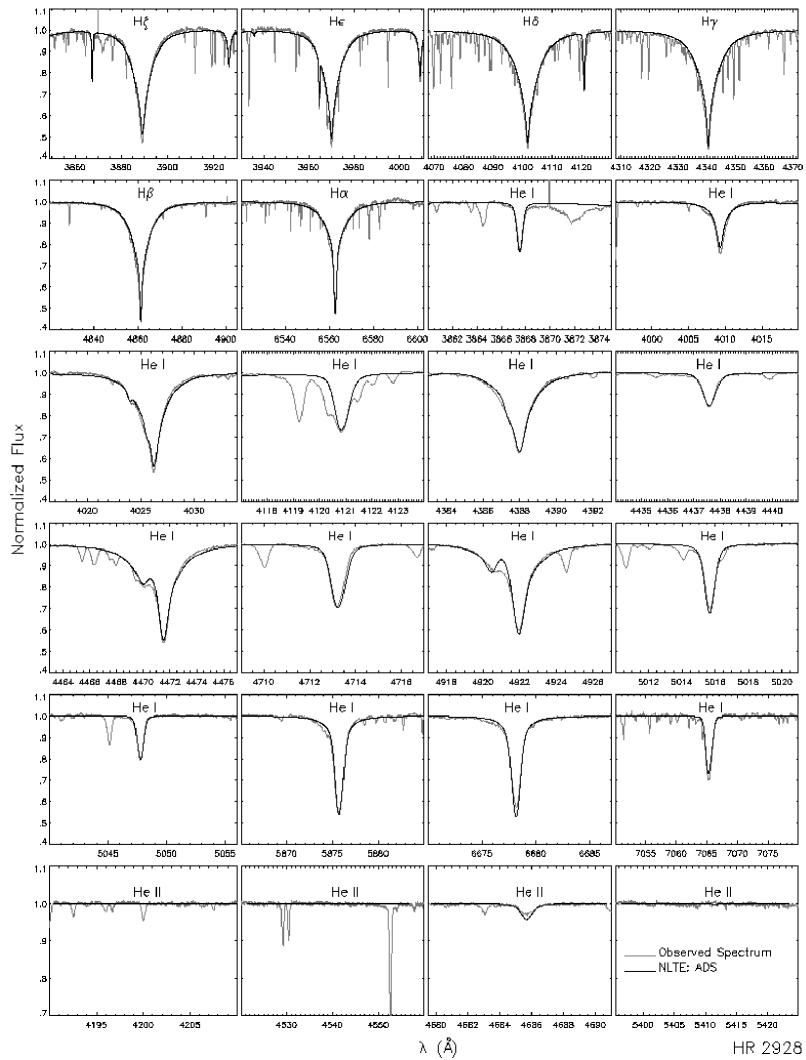
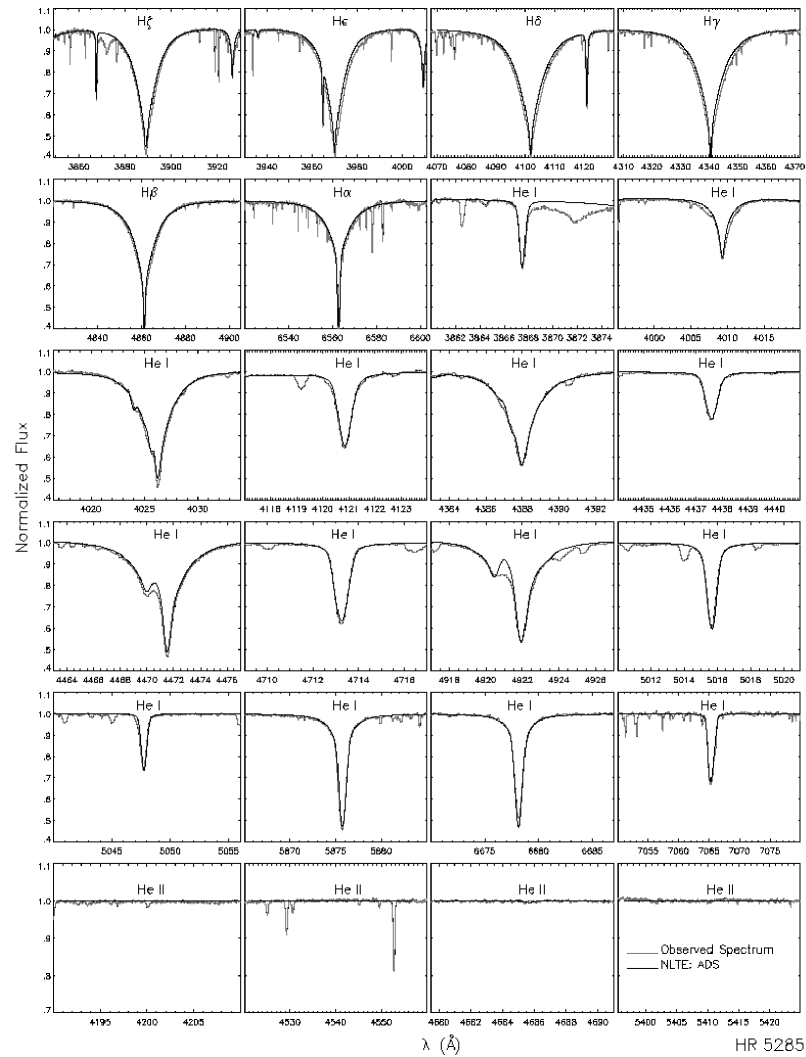
He ii 4686 Å is the only visible (weak) feature of He ii in the intermediate temperature stars HR 1861 and HR 2928; see Figs. 16 and 17. Good fits are obtained for this line and the features of He i (i.e. establishing the ionization equilibrium) and hydrogen. Lines of He ii are absent at even lower temperatures, HR 3468 and HR 5285 in our sample, see Figs. 18 and 19.
4.2 Near-IR
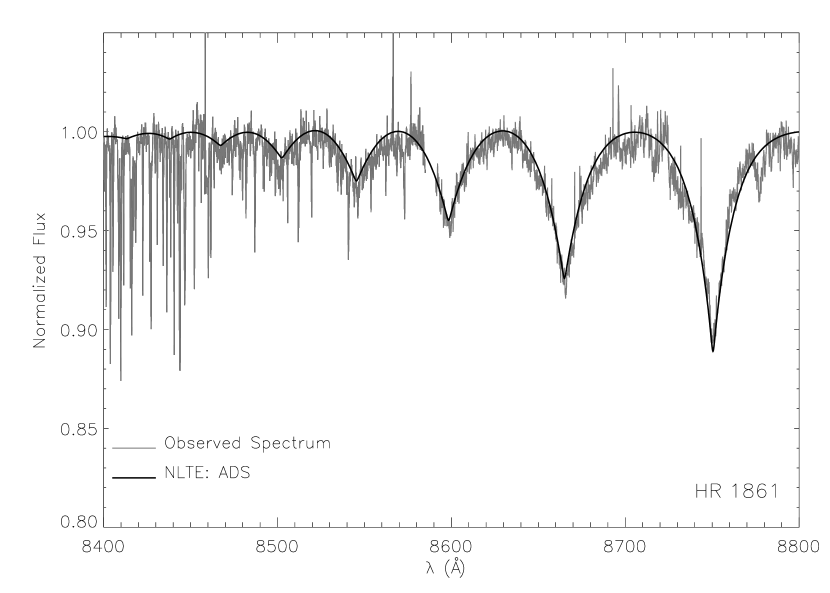
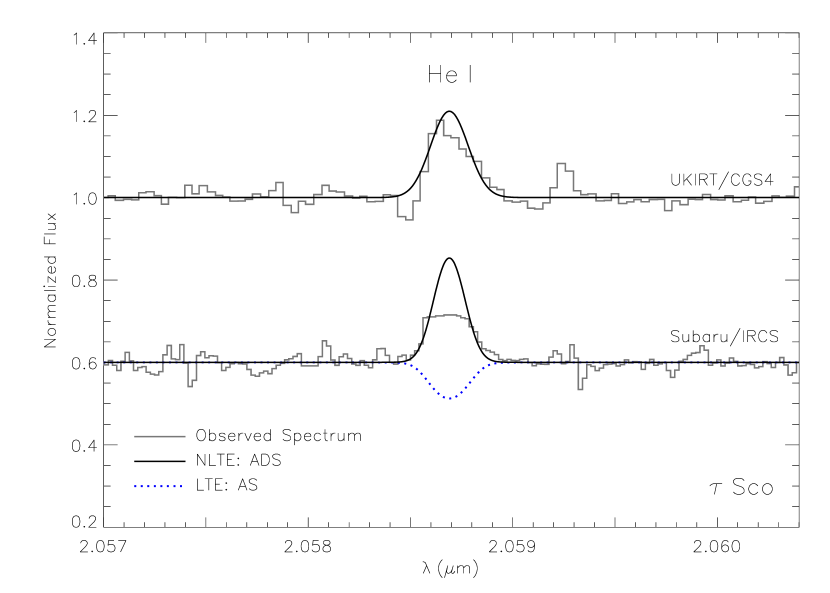
Additional spectra are available in the near-IR for two stars. An excellent fit to the higher Paschen series is obtained for HR 1861 in non-LTE, despite the relatively low S/N and the presence of telluric lines, see Fig. 6. Good agreement between the non-LTE spectrum synthesis and observation can also be obtained for the He i 2.058 m feature and practically perfect agreement for the 2.11 m lines in Sco, see Figs. 7 and 8. Note that the 2.058 m transition is situated in an atmospheric window with a series of strong telluric lines, therefore its shape is highly sensitive to the detailed approach in the data reduction process (see e.g. Zaal et al. zaal99 (1999)). The two different observations in Fig. 7 may exemplify the difficulty of accurate telluric line removal in the data reduction process (or alternatively an intrinsic time variability of the feature). Good agreement with our model is obtained in the case of the higher-resolution UKIRT/CGS4 spectrum. The LTE approach is not even able to reproduce the observation qualitatively. The line fits in the near-IR are based on the same atmospheric parameters (Table 2) as used for the modelling of the optical spectra.
Non-LTE effects can be amplified in the Rayleigh-Jeans part of the spectral energy distribution, as demonstrated in this case. See e.g. Przybilla & Butler (przyb-but04 (2004)) for a discussion and for line fits to Br in the -band and to additional Brackett and Pfund lines in this star. The case of He i 10 830 Å has been discussed by Przybilla (przyb05 (2005)).
5 Comparison with other model predictions
In this section we compare our hybrid non-LTE computations (ADS) with four other approaches. Two of them are available grids from the literature, and to understand their discrepancies to our ADS computations we calculate additional non-LTE and LTE models.
i) We replace the ATLAS9 models by line-blanketed, plane-parallel, and hydrostatic non-LTE model atmospheres taken from the publically available OSTAR2002 grid (Lanz & Hubeny la-hu03 (2003), LH03) and carry out the non-LTE line formation calculation with DETAIL and SURFACE as described above.

ii) We use the non-LTE calculations from the OSTAR2002 grid (TLUSTY and non-LTE line formation with SYNSPEC), published by LH03.
iii) We calculate LTE spectra based on ATLAS9 atmospheres and subsequent LTE spectrum synthesis with SURFACE (AS).
iv) We use the Padova grid (Munari et al. mu03 (2005)), based on ATLAS9 atmospheres and LTE spectrum synthesis performed with the SYNTHE code (Kurucz & Avrett kav81 (1981); Kurucz 1993c ).
5.1 Atmospheric structures, SEDs: LTE vs. non-LTE
A comparison of LTE (ATLAS9) and non-LTE (TLUSTY) atmospheric structures and spectral energy distributions (SEDs) computed with ATLAS9DETAIL and TLUSTY is made in Fig. 9. Models for a hot giant and a dwarf ( 32 500 K, 3.75 and 4.25, respectively) are considered, approximately delineating the upper temperature boundary of our observations ( Sco). Reduced non-LTE effects can be expected for cooler models.
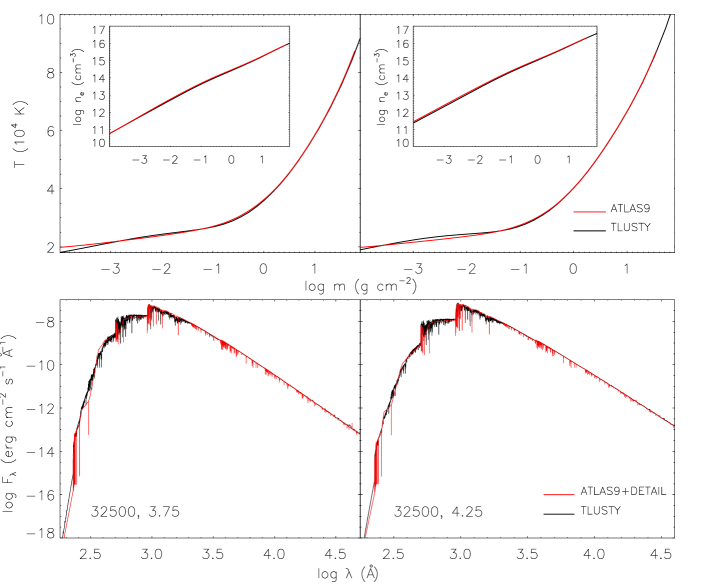
Excellent agreement is found for the temperature and density structures. This is a basic requirement for successful application of the hybrid non-LTE approach for spectrum synthesis. The temperature structures deviate by less than 1% in the inner atmosphere, including the regions where the weaker lines and the wings of the stronger features are formed ( 1; see Sect. 5.3). At the formation depths of the cores of the stronger H and He lines (3 1.5) the differences may increase to 2–3%. Stronger deviations may occur only in the outermost parts of the atmosphere, outside the line-formation depths. Note that this good a match is obtained only if the effects of metal line-blanketing are correctly accounted for. In particular, the computations should be made for identical metal abundances. This is complicated by the fact that the ODFs of Kurucz (1993a ) were computed assuming scaled solar abundances from Anders & Grevesse (AnGr89 (1989)), while the TLUSTY computations assume abundances from Grevesse & Sauval (gre_sauv98 (1998)). The most important difference is a downward revision of the iron abundance by 0.2 dex in the later work. Consequently, we use ODFs with correspondingly ‘sub-solar’ metallicity in order to correct for the discrepancies in the line opacities, with Fe/H as a metallicity substitute. See also Przybilla et al. (2006b ) for a discussion of such ‘empirical’ corrections. We should note that while the differences are small at (near-)solar abundances the non-LTE effects on the atmospheric structure will increase with decreasing metallicity. Nevertheless, our hybrid non-LTE methodology for OB star analyses should be applicable down to SMC metallicity, as indicated by an analogous comparison for models at 1/5 solar abundances.
The SEDs computed with ATLAS9+DETAIL and TLUSTY show excellent agreement over almost the entire wavelength range. Small differences occur in the EUV, most notably in the He ii continuum. This is a significant improvement over the comparison of TLUSTY with ATLAS9 model fluxes (not shown here), which predict much lower fluxes in the Lyman and helium continua. The LTE computations neglect the non-LTE overionization of the hydrogen and He i ground states. This overionization reduces the bound-free continuum opacity; see Sect. 5.3 for a more comprehensive discussion.
5.2 Spectra: hybrid non-LTE vs. full non-LTE and LTE
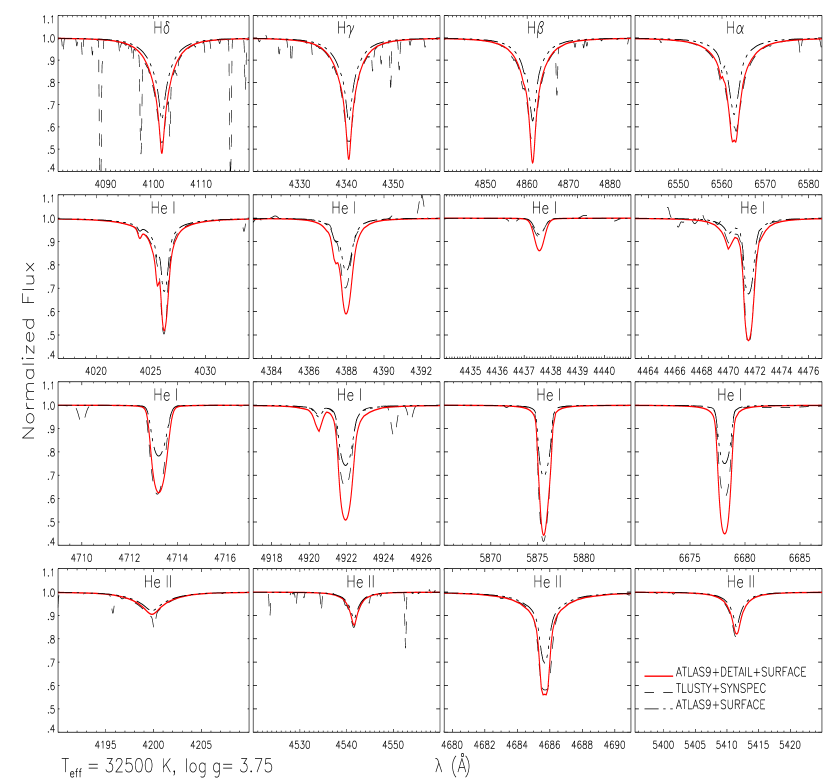
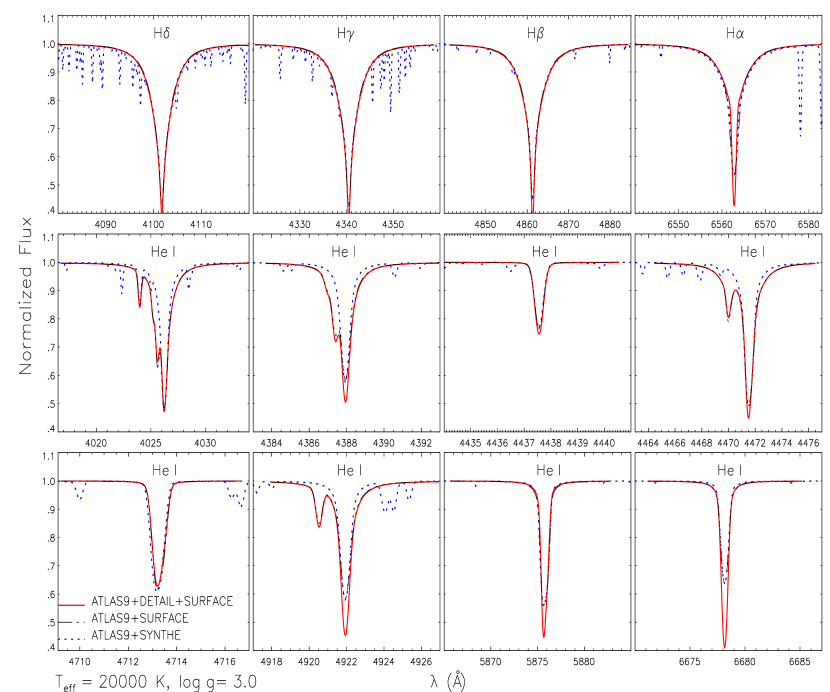
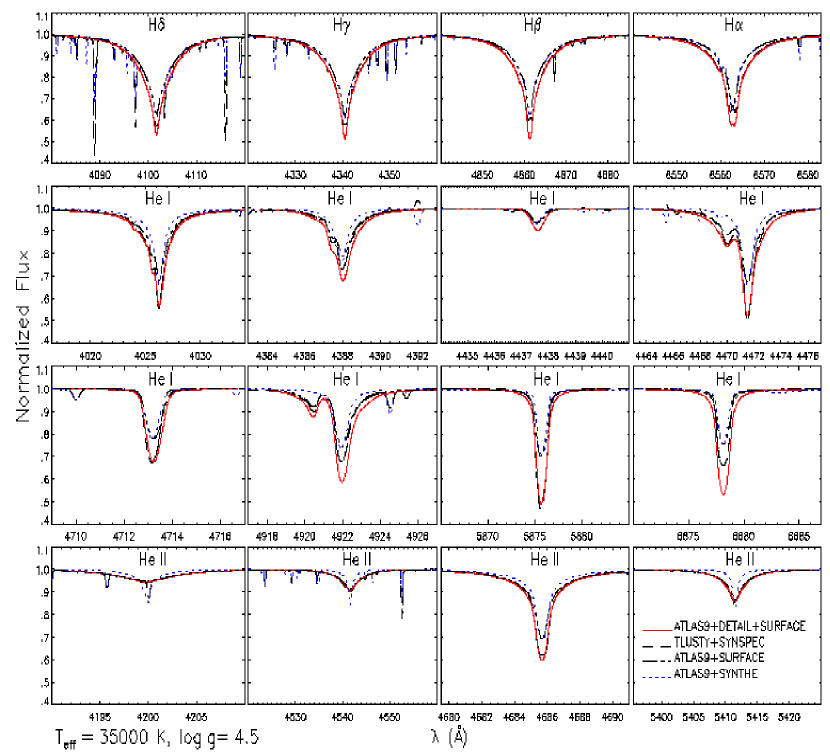
Comparisons of synthetic profiles of several strategic lines of hydrogen and He i/ii are made for three test cases, where models are available from the published grids. These frame the parameter space studied in the present paper. The test cases comprise a hot dwarf model ( 35 000 K, 4.5), at slightly higher than covered by our observations111We expect our approach to be valid at slightly hotter temperatures, at least in main sequence stars where the stellar wind does not influence the photospheric layers strongly., shown in Fig. 11; a hot giant model (32 500, 3.75), with similar temperature to Sco, see Fig. 12; a cool giant model (20 000, 3.00), with both and lower than covered by our observations, Fig. 13. In order to be consistent with the published grids, our computations consider solar metal abundances (Grevesse & Sauval gre_sauv98 (1998)) and solar helium abundance. Our synthetic spectra and those of the OSTAR2002 grid are degraded to the highest resolution ( 20 000) available from the Padova grid. Note that metal lines are neglected when we calculate the emergent spectrum, and they are considered indirectly via line blanketing/blocking effects.
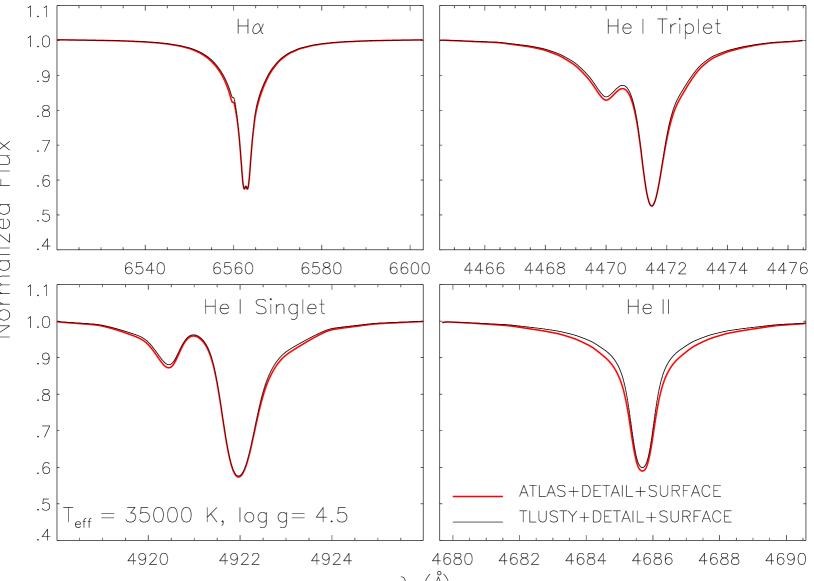
i) ADS vs. TLUSTY-DS. This comparison allows effects caused by differences in the model atmosphere structures to be disentangled. A practically perfect match for the (35 000,4.5) model (see Fig. 10) is obtained in the ADS and TLUSTY-DS computations, which share the same model atom. This indicates good agreement of the LTE and non-LTE atmospheric structures at even slightly higher temperatures than discussed in Fig. 9. We refrain from presenting further comparisons of these two approaches, as the discrepancies are even smaller at lower temperatures.
ii) ADS vs. TLUSTYSYNSPEC (LH03). These results are obtained using two independent methods (model atmospheres, model atoms, numerical solution). Nonetheless, good agreement is found on the whole for the (35 000,4.5) and (32 500,3.75) models from an inspection of Figs. 11 and 12, respectively. Notable differences between ADS and TLUSTYSYNSPEC occur in the line cores of the Balmer lines (the latter filled in by emission) and in the He i singlet lines, which are systematically weaker in the case of TLUSTYSYNSPEC, in contrast to observation (see Figs. 4 and 5). The He i triplet lines derived from both approaches agree well. Small discrepancies occur in the line wings of the He i lines because of different broadening data. A good match is also obtained for the He ii lines, with small differences arising in He ii 4686 Å.
From the comparison of the TLUSTYSYNSPEC and TLUSTY-DS results, which match our ADS, we can conclude that the aforementioned discrepancies arise because of subtle differences in solving the statistical equilibrium and radiative transfer problem. While our approach uses line opacities averaged over the ODF wavelength bins, the TLUSTYSYNSPEC computations employ a more sophisticated opacity sampling technique. This however introduces a strong dependency on the model assumptions for Fe iv222In particular on the oscillator strengths of the Fe iv transitions involved. A reduction of the -values may alleviate the discrepancy between the He i singlet and triplet line strengths, seen, for example, in the OSTAR2002 grid. (a highly complex ion), which has lines overlapping with an He i resonance transition (Najarro et al. Najarroetal06 (2006))333As a further test we have calculated synthetic spectra for the (35 000,4.5) and (32 500,3.75) models on the basis of unified, line-blanketed non-LTE model atmospheres (FASTWIND, Puls et al. Pulsetal05 (2005)). Excellent agreement with our ADS results is found for both the He i singlet and triplet lines. Note that FASTWIND also uses an approximate treatment of line blocking.. The same model atmosphere (TLUSTY) is used and both model atoms should be sufficiently robust for modelling the lines in the visual; see Przybilla & Butler (przyb-but04 (2004)) and Przybilla (przyb05 (2005)) for a discussion of this.
iii) ADS vs. ATLAS9SURFACE. LTE computations with AS produce narrower Balmer lines for the (35 000,4.5) and (32 500,3.75) models (the differences reducing progressively from H to the higher series members), which leads to overestimated surface gravities in that case. At the same time, all He i lines are too shallow in LTE, the trend increasing from blue to red and showing larger discrepancies at lower gravity. On the other hand, rather good agreement is found for the He ii lines, the LTE predictions being slightly weaker than ADS for the hot giant. In Fig. 13 a comparison of our hybrid non-LTE with our pure LTE prediction is made for a (20 000,3.0) model with a temperature slightly below than the lower limit of our programme stars, and at significantly reduced surface gravity. Here, the wings of the Balmer lines show much better agreement than at higher temperatures (cf. Fig. 11), as well as the He i 4437 and 4713 Å lines. The line cores are also discrepant, increasingly so from H to H. Many of the He i lines experience significant non-LTE strengthening, in particular those in the red. The line broadening data is the same in ADS and AS, so the He i wings are very similar. The forbidden components are also accounted for in both approaches.
iv) ADS vs. ATLAS9SYNTHE (Munari et al. mu03 (2005)). The differences of these approaches were quantified for the (35 000,4.5) model, when possible. The Balmer lines from the Padova model present similar characteristics as the LTE AS approach (in Fig. 11 they coincide), resulting in lower equivalent widths by up to 30% relative to ADS. When using the H wings as a surface-gravity indicator, this translates to a systematic error in by 0.2 dex, implying even larger errors for fits to the H and H wings. The He i lines are generally too weak, by up to a factor of more than 2 in equivalent width, and the He ii lines too narrow. For the most part, these discrepancies stem from the neglect of non-LTE effects on the line-formation process, as the differences in the atmospheric structures are practically insignificant.
Another limiting factor of the
ATLAS9SYNTHE computations is the use of insufficient Stark broadening
data (Voigt profile with constant Stark damping parameter).
Our AS and ADS approaches improve
on this, as realistic
broadening data is used
(see Table 1). In the ATLAS9SYNTHE approach, it will not be possible to
obtain reasonable agreement for the He i and He ii spectra at the same time.
For the (20 000,3.0) model, the Padova profiles are more similar to the AS approach.
However, the diffuse He i lines still suffer from inappropriate
broadening data,
in particular the forbidden components are unaccounted for.
The He i lines are affected by non-LTE strengthening, increasing to the red.
Only few He i lines are quite similar in the three
approaches:
4437 and 4713 Å match quite well, as do
3867, 4121 (despite blends with metallic lines) and 5015 and 5047 Å,
not displayed here.
We should mention that the published libraries of synthetic spectra were computed with different values of microturbulent velocity (OSTAR2002: 10 km s-1; Padova: 2 km s-1). The ADS and TLUSTY-DS calculations with 10 km s-1 were adopted for the comparison in Fig. 11. We made tests with a reduced 2 km s-1, resulting in only small changes in the He ii profiles – the most sensitive to modifications of . The differences between the Padova grid and the other approaches are indeed due to the neglect of non-LTE effects and to additionally insufficient broadening data and not because of discrepant microturbulences. The ADS and AS computations in Figs. 12 and 13 were performed using the of the respective libraries.
5.3 Line formation: hybrid non-LTE vs. full non-LTE

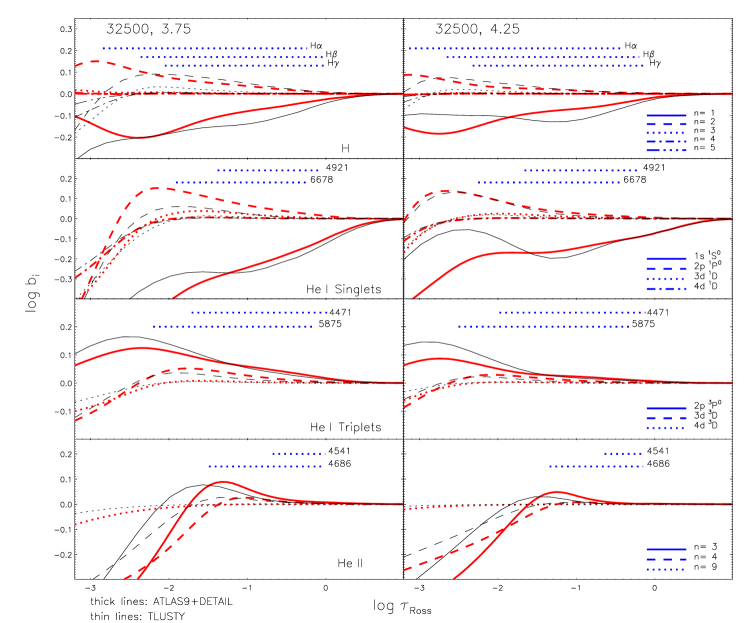
We now try to identify the physical reasons for the differences in the non-LTE line profiles of hydrogen and helium in the last comparisons by a closer study of the underlying line-formation processes. For this we investigate non-LTE departure coefficients and line source functions for three representative hydrogen and six He i/ii lines, as derived in our ATLAS9DETAIL and the TLUSTY computations. We choose the same models as discussed in Fig. 9. For the (32 500, 3.75) model, a direct comparison with the resulting line profiles is facilitated by inspection of Fig. 12.
For the levels involved in the transitions of interest and the hydrogen and helium ground states, departure coefficients (referred to the ground state of the next higher ion) are displayed in Fig. 14. The non-LTE effects on the level occupations give rise to departures of the line source function from the Planck function ; see Fig. 15 for a comparison of from the ATLAS9+DETAIL and TLUSTY computations. We recall that
| (2) |
with the Planck and the Boltzmann constant, the transition frequency, and the local temperature. For given the non-LTE effects are strengthened with decreasing surface gravity, implying lower particle densities and thus larger mean-free-paths between photon absorptions.
Hydrogen.
We study three hydrogen lines, H, H and H. Departure coefficients for levels 5 behave similarly to those for 5, which already traces the behaviour of the continuum closely. Consequently, the line source functions for the higher Balmer lines are similar to that of H. The non-LTE depopulation of the H ground state (Fig. 14) reduces the Lyman continuum opacity, giving rise to higher EUV fluxes than in LTE. The Lyman lines are expected to experience non-LTE weakening. Note that the TLUSTY calculations indicate a slightly stronger non-LTE depopulation of the ground state at continuum formation depths than in our case. Good agreement of the departure coefficients for 2 is found, which is overpopulated at line formation depths. In combination with the higher H states being close to LTE, this explains the non-LTE strengthening of the Balmer lines. At the formation depths of the line cores, in particular for H, the TLUSTY results show a less pronounced overpopulation, eventually leading to an underpopulation of the 2 state in the outer atmosphere. This explains the shallower lines from the TLUSTY computations relative to ADS, which is a consequence of the upturn of (Fig. 15). The effect decreases from H to the higher Balmer lines, as the core formation depths shift to deeper atmospheric layers.
He i Singlets.
We investigate two representative features: 4921 and 6678 Å. In general, the departure coefficients
for most of the levels show rather good agreement, in qualitative behaviour as well as
quantitatively. Notable differences in the ground-state overionization occur in
the outer atmosphere. More relevant is the behaviour of the
2p 1Po level, the lower level of practically all He i
singlet transitions in the visual. The non-LTE overpopulation in the TLUSTY
results is far less-pronounced than in our case (Fig. 14), in particular for the giant
model. This gives rise to discrepant line source functions (Fig. 15) and consequently
differing line profiles (Fig. 12) in the two
approaches, with the ADS computations correctly predicting the non-LTE
strengthening and thus reproducing observation (Sect. 4). The states
at higher excitation energies ( 4) are in LTE relative to
the He ii ground state at line-formation depths.
He i Triplets.
We investigate two representative lines: 4471 and 5875 Å. The departure coefficients from the two approaches differ only slightly at line-formation depths (Fig. 14). As a consequence, the source functions (Fig. 15) are also similar, resulting in negligible differences of the line profiles (Fig. 12). Again, the states with 4 are in detailed balance relative to the He ii ground state at depths relevant for the line formation.
He ii.
Two features were studied: 4541 and 4686 Å. The higher He ii levels are close to LTE with the continuum state at line-formation depths. Only the 3 level shows a relevant overpopulation, resulting in a non-LTE strengthening of the 4686 Å line. The differences in the ADS and TLUSTY departure coefficients give slightly shallower profiles for this line in the OSTAR2002 model (Fig. 12). The source function for 4541 Å is essentially Planckian in the relevant region.
6 Discussion
Quantitative spectroscopy has to avoid systematic errors in order to be meaningful. A correct interpretation requires simultaneous reproduction of all observational constraints (continua/spectral energy distribution, line profiles). The line spectra of the most abundant elements, hydrogen and helium, are particularly important in this.
We have investigated the suitability of hybrid non-LTE line-formation computations for quantitative analyses of the hydrogen and helium line spectra of OB dwarf and giant stars. Our computations simultaneously reproduce the line spectra throughout the visual and near-IR (where available) at high quality, as well as the measured spectral energy distributions from the UV to near-IR, as discussed by Nieva & Przybilla (2006a ). The only exceptions in our observational sample are the cores of H and He ii 4686 Å in Sco, because our computations do not account for stellar winds. For two He i lines blueward of the traditionally analysed spectral region (4000–5000 Å), appropriate Stark broadening data is unavailable at present (see Table 1).
Comparisons with other approaches, including the representative libraries of synthetic spectra computed in non-LTE (OSTAR2002 grid of Lanz & Hubeny la-hu03 (2003)) and LTE (Padova grid by Munari et al. mu03 (2005)) were also made. We find good overall agreement between hybrid and full non-LTE calculations within the parameter space investigated here: for the model atmosphere structures, spectral energy distributions, and many detailed line profiles. Our hybrid approach is able to simultaneously reproduce the He i singlets and triplets, confirmed by comparison with observations. This is not trivial and becomes important in particular when only few He i lines are available in the observed spectra.
A comparison of TLUSTYSYNSPEC with other state-of-the-art non-LTE codes (FASTWIND and CMFGEN) for O-type stars by Najarro et al. (Najarroetal06 (2006)) implies differences in all modelling results for the He i singlets. However, while motivated by the problems with accurately reproducing observations, this study does not present a detailed comparison of models and observed spectra444Our own tests indicate that both the ADS calculations and FASTWIND provide high-quality fits to observation of the He i singlet and triplet spectra in the parameter space of interest here.. Our work indicates that the He i singlet problem also persists in the hotter early B-type stars at solar metallicity (note that a significant reduction of metallicity alleviates the problem, as Heap et al. (Heapetal06 (2006)) find a simultaneous match of singlets and triplets in SMC O stars).
Computations in LTE from the Padova grid, on the other hand, systematically predict too shallow and/or too narrow line profiles. In particular, the differences in the H wings – a common surface gravity indicator – result in systematically overestimated gravities by up to 0.2 dex in LTE (for fixed ). The differences in the equivalent widths of the H lines can amount to up to 30% and in the He i/ii lines up to a factor 2 compared to our non-LTE calculations, with the discrepancies increasing with effective temperature. Nevertheless we are not able to quantify the differences in effective temperature determinations from non-LTE and LTE ionization equilibria of He i/ii, as some of the profiles of the Padova grid do not reproduce observations even qualitatively.
In terms of parameter range and the underlying physics, the hybrid non-LTE approach is certainly restricted. It may be of limited use at higher temperatures (early and mid-O-type stars), lower gravities (early B-type and O-type supergiants), stars with strong winds, or extremely low metallicities. Nevertheless, the hybrid non-LTE approach is sufficient for studying normal OB dwarfs and giants, as it allows the observed line spectra to be reproduced in the visual and near-IR over a wide range of atmospheric parameters. Here it has advantages over other more sophisticated non-LTE techniques: I) allows highly robust and detailed model atoms to be implemented and to be tested efficiently (i.e. concentration on atomic data while avoiding further complications like stellar winds), e.g. for metals with hundreds of levels and thousands of transitions; and II) the model calculations are fast: the computation of one H & He i/ii model with DETAILSURFACE takes only a few minutes on a modern PC (as of 2006).
7 Conclusions
A hybrid non-LTE approach, such as is often employed in the literature for analyses of metal line spectra, has been thoroughly tested for hydrogen and helium line formation in OB stars for the first time, using recently improved model atoms. The synthetic spectra simultaneously match almost all measurable hydrogen and helium lines in the optical and (where available) also in the near-IR spectral range of six test stars covering a wide range of stellar parameters.
The comparison of state-of-the-art line-blanketed non-LTE and LTE models confirms that the atmospheric structure of OB dwarf and giant stars is described well under the assumption of LTE, but not their spectral energy distribution and also not their line spectra. For these stars in the range 20 000 K 35 000 K and 3.0 4.5 (far from the Eddington limit), our hybrid non-LTE approach is equivalent to full hydrostatic non-LTE computations.
It succeeds also in providing synthetic spectra that correctly reproduce the observed He i singlet lines, avoiding inconsistencies recently reported in the literature.
In contrast to this, pure LTE modelling based on the Padova grid (or equivalent computations with ATLAS9SYNTHE) may give rise to considerable systematic errors in the atmospheric parameter determination (, ) and to subsequent elemental abundance studies for the hotter stars in particular. The problems with this approach may be remedied at least near the lower temperature boundary by implementing proper line broadening data.
Finally, we suggest that the He i triplet be preferred for analyses over the singlet lines from the OSTAR2002 grid in order to avoid systematic uncertainties, in agreement with the findings of Najarro et al. (Najarroetal06 (2006)). Hydrogen and helium line profiles from the Padova grid may be useful for quantitative analyses of stars cooler than 22 000 K. Preference should be given to the He i 3867, 4121, 4437, 4713, 5016, and 5048 Å transitions, which are least affected by non-LTE effects.
Acknowledgements.
The authors wish to thank U. Heber and K. Cunha for their interest and their support of the project. We further thank K. Butler for making DETAIL and SURFACE available; M. Altmann, J. Puls, and P. A. Zaal for kindly providing the FEROS, the -band, and the 2.058 m data, respectively; and H. Edelmann for helping with the data reduction. A special thanks go to U.H., K.B., K.C., J.P. and the anonymous referee of this paper for careful reading of the manuscript and their comments and suggestions. M.F.N. acknowledges a DAAD scholarship.References
- (1) Anders, E., & Grevesse, N. 1989, Geochim. Cosmochim. Acta, 53, 197
- (2) Auer, L. H., & Mihalas, D. 1972, ApJS, 24, 193
- (3) Auer, L. H., & Mihalas, D. 1973, ApJS, 25, 433
- (4) Barnard, A. J., Cooper, L., & Shamey, L. J. 1969, A&A, 1, 28
- (5) Bouret, J.-C., Lanz, T., Hillier, D. J., et al. 2003, ApJ, 595, 1182
- (6) Butler, K.& Giddings, J. R. 1985, in: Newsletter of Analysis of Astronomical Spectra, No. 9 (Univ. London)
- (7) Cescutti, G., Matteucci, F., Francois, P., & Chiappini, C. 2007, A&A, 462, 943
- (8) Chiappini, C., Matteucci, F., & Romano, D. 2001, ApJ, 554, 1044
- (9) Cowley, C. 1971, Observatory, 91, 139
- (10) Cunha, K., & Lambert, D. L. 1992, ApJ, 399, 586
- (11) Daflon, S., & Cunha, K. 2004, ApJ, 617, 1115
- (12) Dimitrijević, M. S., & Sahal-Bréchot, S. 1990, A&AS, 82, 519
- (13) Dufton, P. L., Ryans, R. S. I., Trundle, C., et al. 2005, A&A, 434, 1125
- (14) Evans, C. J., Smartt, S. J., Lee, J.-K., et al. 2005, A&A, 437, 467
- (15) Fernley, J. A., Taylor, K. T., & Seaton, M. J. 1987, J. Phys. B, 20, 6457
- (16) Giddings, J. R. 1981, Ph.D. Thesis, University of London
- (17) Gies, D. R., & Lambert D. L. 1992, ApJ, 387, 673
- (18) Green, L. C., Rush, P. P., & Chandler, C. D. 1957, ApJS, 3, 37
- (19) Grevesse, N. & Sauval, A. J. 1998, Space Sci. Rev., 85, 161
- (20) Griem, H. R. 1960, ApJ, 132, 883
- (21) Griem, H. R. 1964, Plasma Spectroscopy (New York: McGraw-Hill)
- (22) Griem, H. R. 1967, ApJ, 147, 1092
- (23) Griem, H. R., Baranger, M., Kolb, A. C., & Oertel, G. 1962, Phys. Rev., 125, 177
- (24) Gummersbach, C. A., Kaufer, A., Schäfer, D. R., Szeifert, T., & Wolf, B. 1998, A&A, 338, 881
- (25) Hanson, M. M., Kudritzki, R. P., Kenworthy, M. A., Puls, J., & Tokunaga A. T. 2005, ApJS, 161, 154
- (26) Heap, S., Lanz, T., Hubeny, I. 2006, ApJ, 638, 409
- (27) Hou, J. J., Prantzos, N., & Boissier, S. 2000, A&A, 362, 921
- (28) Hunter, I., Dufton, P. L., Smartt, S. J., et al. 2006, A&A, in press (astro-ph/0609710)
- (29) Jaschek, C. & Jaschek, M. 1990, The Classification of Stars (Cambridge: Cambridge University Press)
- (30) Kaufer, A., Stahl, O., Tubbesing, S., et al. 1999, ESO Messenger, 95, 8
- (31) Kilian, J. 1992, A&A, 262, 171
- (32) Korn, A. J., Keller, S. C., Kaufer, A., et al. 2002, A&A, 385, 143
- (33) Korn, A. J., Nieva, M. F., Daflon, S., & Cunha, K. 2005, ApJ, 633, 899
- (34) Kurucz, R. L. 1993a, CD-ROM No. 2–12 (Cambridge, Mass.: SAO)
- (35) Kurucz, R. L. 1993b, CD-ROM No. 13 (Cambridge, Mass.: SAO)
- (36) Kurucz, R. L. 1993c, CD-ROM No. 18 (Cambridge, Mass.: SAO)
- (37) Kurucz, R. L., & Avrett, E. H. 1981, SAO Spec. Rep., 391
- (38) Lanz, T., & Hubeny, I. 2003, ApJS, 146, 417 (LH03)
- (39) Lucy, L. B. 1976, ApJ, 206, 499
- (40) Maeder, A., & Meynet, G. 2000, ARA&A, 38, 143
- (41) McErlean, N. D., Lennon, D. J., & Dufton, P. L. 1198, A&A, 329, 613
- (42) Mokiem, M. R., de Koter, A., Puls, J., et al. 2005, A&A, 441, 711
- (43) Mokiem, M. R., de Koter, A., Evans, C. J., et al. 2006, A&A, 456, 1131
- (44) Morel, T., Butler, K., Aerts, C., Neiner, C., & Briquet, M. 2006, A&A, 457, 651
- (45) Munari, U., Sordo, R., Castelli, F., & Zwitter, T. 2005, A&A, 442, 1127
- (46) Najarro, F., Hillier, D. J., Puls, J., Lanz, T., & Martins, F. 2006, A&A, 456, 659
- (47) Nieva, M. F., & Przybilla, N. 2006a, ApJ, 639, L39
- (48) Nieva, M. F., & Przybilla, N. 2006b, in Nuclei in Cosmos IX, Proceedings of Science, PoS(NIC-IX)150 (astro-ph/060922)
- (49) Nieva, M. F., & Przybilla, N. 2007, in preparation.
- (50) Perryman, M. A. C., de Boer, K., Gilmore, G., et al. 2001, A&A, 369, 339
- (51) Pfeiffer, M. J., Frank, C., Baumüller, D., Fuhrmann, K., & Gehren, T. 1998, A&AS, 130, 381
- (52) Przybilla, N. 2005, A&A, 443, 293
- (53) Przybilla, N., & Butler, K. 2004, ApJ, 609, 1181
- (54) Przybilla, N., Butler, K., Becker, S.R., & Kudritzki, R.P. 2006b, A&A, 445, 1099
- (55) Przybilla, N., Butler, K., Heber, U., & Jeffery, C.S. 2005, A&A, 443, L25
- (56) Przybilla, N., Nieva, M. F., & Edelmann, H. 2006a, Baltic Astronomy, 15, 107
- (57) Puls, J., Urbaneja, M.A., Venero, R., et al. 2005, A&A, 435, 669
- (58) Repolust, T., Puls, J., & Herrero, A. 2004, A&A, 415, 349
- (59) Repolust, T., Puls, J., Hanson, M. M., Kudritzki, R.P., & Mokiem, M. R. 2005, A&A, 440, 261
- (60) Rolleston, W. R. J., Smartt, S. J., Dufton, P. L., & Ryans, R. S. I. 2000, A&A, 363, 537
- (61) Rolleston, W. R. J., Venn, K., Tolstoy, E., & Dufton, P.L. 2003, A&A, 400, 21
- (62) Rybicki, G. B., & Hummer, D. G. 1991, A&A, 245, 171
- (63) Schiff, B., Pekeris, C. L., & Accad, Y. 1971, Phys. Rev. A, 4, 885
- (64) Schöning, T., & Butler, K. 1989, A&AS, 78, 51
- (65) Shamey, L. J. 1969, Ph.D. Thesis, University of Colorado
- (66) Shaver, P. A., McGee, R. X., Newton, L. M., Danks, A. C., & Pottasch, S. R. 1983, MNRAS, 204, 53
- (67) Stehlé, C., & Hutcheon, R. 1999, A&AS, 140, 93 (SH99)
- (68) Zaal, P. A., de Koter, A., Waters, L. B. F. M., et al. 1999, A&A, 349, 573
| (Å) | Transition | Acc. | Src. | Broad. | Comment | ||
|---|---|---|---|---|---|---|---|
| H i: | |||||||
| 3797.90 | 2 – | 10 | 1.511 | AA | GRC | SH | |
| 3835.38 | 2 – | 9 | 1.362 | AA | GRC | SH | |
| 3889.05 | 2 – | 8 | 1.192 | AA | GRC | SH | |
| 3970.07 | 2 – | 7 | 0.993 | AA | GRC | SH | blend with interstellar Ca ii H |
| 4101.73 | 2 – | 6 | 0.753 | AA | GRC | SH | |
| 4340.46 | 2 – | 5 | 0.447 | AA | GRC | SH | |
| 4861.32 | 2 – | 4 | 0.020 | AA | GRC | SH | |
| 6562.80 | 2 – | 3 | 0.710 | AA | GRC | SH | |
| 8413.32 | 3 – | 19 | 1.823 | AA | GRC | SH | |
| 8437.96 | 3 – | 18 | 1.748 | AA | GRC | SH | |
| 8467.26 | 3 – | 17 | 1.670 | AA | GRC | SH | |
| 8502.49 | 3 – | 16 | 1.586 | AA | GRC | SH | |
| 8545.39 | 3 – | 15 | 1.495 | AA | GRC | SH | |
| 8598.39 | 3 – | 14 | 1.398 | AA | GRC | SH | |
| 8665.02 | 3 – | 13 | 1.292 | AA | GRC | SH | |
| 8750.47 | 3 – | 12 | 1.175 | AA | GRC | SH | |
| He ii: | |||||||
| 3796.34 | 4 – | 20 | 1.487 | AA | GRC | G60, G67 | blend with H |
| 3813.50 | 4 – | 19 | 1.414 | AA | GRC | G60, G67 | |
| 3833.81 | 4 – | 18 | 1.337 | AA | GRC | G60, G67 | blend with H |
| 3858.08 | 4 – | 17 | 1.255 | AA | GRC | G60, G67 | |
| 3887.45 | 4 – | 16 | 1.166 | AA | GRC | G60, G67 | blend with H |
| 3923.49 | 4 – | 15 | 1.071 | AA | GRC | SBa | blend with He i |
| 3968.44 | 4 – | 14 | 0.967 | AA | GRC | SBa | blend with H |
| 4025.61 | 4 – | 13 | 0.852 | AA | GRC | SBa | blend with He i |
| 4100.05 | 4 – | 12 | 0.725 | AA | GRC | SB | blend with H |
| 4199.84 | 4 – | 11 | 0.582 | AA | GRC | SB | blend with N iii |
| 4338.67 | 4 – | 10 | 0.417 | AA | GRC | SB | blend with H |
| 4541.59 | 4 – | 9 | 0.223 | AA | GRC | SB | |
| 4685.70 | 3 – | 4 | 1.181 | AA | GRC | SB | |
| 4859.32 | 4 – | 8 | 0.014 | AA | GRC | SB | blend with H |
| 5411.52 | 4 – | 7 | 0.321 | AA | GRC | SB | |
| 6560.09 | 4 – | 6 | 0.759 | AA | GRC | SB | blend with H |
a unpublished, priv. comm.; b vacuum wavelengths
accuracy indicators – uncertainties within: AA: 1%; A: 3%
sources of -values:
FTS: Fernley et al. (Fernleyetal87 (1987));
GRC: Green et al. (Greenetal57 (1957));
SPA: Schiff et al. (Schiffetal71 (1971))
sources for Stark broadening parameters:
BCS69: Barnard et al. (Barnardetal69 (1969));
C: Cowley (Cowley71 (1971));
DSB: Dimitrijević & Sahal-Bréchot (DiSa90 (1990));
G60: Griem (Griem60 (1960));
G64: Griem (Griem64 (1964));
G67: Griem (Griem67 (1967));
GBKO: Griem et al. (Griemetal62 (1962));
S: Shamey (Shamey69 (1969));
SB: Schöning & Butler (SchBu89 (1989));
SH: Stehlé & Hutcheon (sh99 (1999))
Table 1. continued
(Å)
Transition
Acc.
Src.
Broad.
Comment
He i:
3819.60
2p 3Po –
6d 3D
0.931
A
FTS
DSB
broadening data to be improved, forbidden components missing
3819.61
2p 3Po –
6d 3D
1.153
A
FTS
DSB
…
3819.76
2p 3Po –
6d 3D
1.630
A
FTS
DSB
…
3867.47
2p 3Po –
6s 3S
2.037
A
FTS
DSB
3867.48
2p 3Po –
6s 3S
2.260
A
FTS
DSB
3867.63
2p 3Po –
6s 3S
2.737
A
FTS
DSB
3888.60
2s 3S –
3p 3Po
1.668
AA
SPA
G64
near core of H
3888.65
2s 3S –
3p 3Po
0.765
AA
SPA
G64
…
3926.54
2p 1Po –
8d 1D
1.652
A
FTS
DSB
broadening data to be improved, blends by Si iii & S ii/iii
3935.95
2p 1Po –
8s 1S
2.772
A
FTS
DSB
3964.73
2s 1S –
4p 1Po
1.290
A
FTS
G64
in wing of H
4009.26
2p 1Po –
7d 1D
1.449
A
FTS
DSB
4023.98
2p 1Po –
7s 1S
2.572
A
FTS
DSB
4026.18
2p 3Po –
5d 3D
2.600
A
FTS
S
4026.19
2p 3Po –
5d 3D
0.633
A
FTS
S
4026.20
2p 3Po –
5d 3D
0.851
A
FTS
S
4026.36
2p 3Po –
5d 3D
1.328
A
FTS
S
4120.81
2p 3Po –
5s 3S
1.722
A
FTS
GBKO
blends with O ii, C iii, & Fe iii
4120.82
2p 3Po –
5s 3S
1.945
A
FTS
GBKO
…
4120.99
2p 3Po –
5s 3S
2.422
A
FTS
GBKO
…
4143.76
2p 1Po –
6d 1D
1.203
A
FTS
DSB
numerous blends with O ii & N ii
4168.97
2p 1Po –
6s 1S
2.332
A
FTS
DSB
strong blend with O ii
4387.93
2p 1Po –
5d 1D
0.886
A
FTS
S
4437.55
2p 1Po –
5s 1S
2.026
A
FTS
GBKO
continuum may be affected by diffuse interstellar band
4471.47
2p 3Po –
4d 3D
0.210
A
FTS
BCS69
4471.49
2p 3Po –
4d 3D
0.432
A
FTS
BCS69
4471.68
2p 3Po –
4d 3D
0.909
A
FTS
BCS69
4713.14
2p 3Po –
4s 3S
1.276
A
FTS
G64
4713.16
2p 3Po –
4s 3S
1.498
A
FTS
G64
4713.38
2p 3Po –
4s 3S
1.976
A
FTS
G64
4921.93
2p 1Po –
4d 1D
0.442
A
FTS
BCS69
treatment of forbidden component to be improved
5015.68
2s 1S –
3p 1Po
0.820
AA
SPA
G64
5047.74
2p 1Po –
4s 1S
1.600
A
FTS
GBKO
5875.60
2p 3Po –
3d 3D
1.511
A
FTS
G64
5875.61
2p 3Po –
3d 3D
0.480
A
FTS
G64
5875.63
2p 3Po –
3d 3D
0.338
A
FTS
G64
5875.64
2p 3Po –
3d 3D
0.138
A
FTS
G64
5875.97
2p 3Po –
3d 3D
0.214
A
FTS
G64
6678.15
2p 1Po –
3d 1D
0.328
A
FTS
G64
7065.18
2p 3Po –
3s 3S
0.458
A
FTS
GBKO
weak telluric line contamination
7065.22
2p 3Po –
3s 3S
0.680
A
FTS
GBKO
…
7065.71
2p 3Po –
3s 3S
1.157
A
FTS
GBKO
…
7281.35
2p 1Po –
3s 1S
0.854
A
FTS
GBKO
strong telluric line contamination
10829.09
2s 3S –
2p 3Po
0.745
AA
SPA
G64
10830.25
2s 3S –
2p 3Po
0.268
AA
SPA
G64
10830.34
2s 3S –
2p 3Po
0.046
AA
SPA
G64
20586.92b
2s 1S –
2p 1Po
0.424
AA
SPA
DSB
strong telluric line contamination
21125.79b
3p 3Po –
4s 3S
0.138
A
FTS
DSB
21125.89b
3p 3Po –
4s 3S
0.360
A
FTS
DSB
21127.09b
3p 3Po –
4s 3S
0.837
A
FTS
DSB
21137.80b
3p 1Po –
4s 1S
0.527
A
FTS
DSB