Karl-Schwarzschild str. 1, Garching, 85741 Germany
11email: brent@mpa-garching.mpg.de 22institutetext: Research School of Astronomy & Astrophysics, The Australian National University,
Cotter Road, Weston Creek, ACT 2611, Australia
Introduction Active galactic nuclei (AGN) are well known to emit strongly at all wavelengths, from gamma-rays and X-rays to the infrared and radio. Their emission characteristics at each wavelength gives us insight into the central engine of these galaxies, whether observed directly, such as at X-ray wavelengths, or indirectly through reprocessed emission, such as by study of the emission lines from the narrow line region (NLR).
One area that has seen recent rapid advances is studies of the mid– and far–infrared characteristics of AGN, with space telescopes such as IRAS, ISO and Spitzer making this wavelength regime readily accessible. As the continuum in this wavelength region is dominated by warm and hot dust re-emission, it is particularly useful in testing the paradigm of the unified model, which argues for a dense equatorial band of dust surrounding the black hole central engine (Antonucci & Miller, 1985).
Various attempts have been made to model the mid– and far–IR emission. These range from simple empirical fits of dust grey-body emission to the observations (Edelson & Malkan, 1986; Blain et al., 2003), to more complicated distributions of dust which include the stochastic heating of dust by an AGN power-law continuum (Dullemond & van Bemmel, 2005). With the prevalence of the unified model, most analyses of the IR from AGN have concentrated on the emission from dust lying in a dense torus surrounding a nuclear heating source (Pier & Krolik, 1992, 1993; Granato & Danese, 1994; Efstathiou & Rowan-Robinson, 1995; Granato et al., 1997; van Bemmel & Dullemond, 2003; Nenkova et al., 2002). However, there have been some authors who have considered different geometries (i.e. Siebenmorgen et al., 2004) or have considered in more detail the collisional heating and destruction of dust (Contini et al., 2004).
Often ignored in the considerations of AGN IR emission is the contribution from the narrow line region (NLR). This region is known to contain dust (e.g. Radomski et al., 2003) and, like the dusty torus, will be heated by the central engine and re-emit at IR wavelengths (Netzer & Laor, 1993). With lower densities than found in the central torus, the NLR also emits strong forbidden lines such as the [O iii] 500.7 nm line. Such lines are often one of the main diagnostics for the presence of an AGN, and also provide important constraints on the form and intensity of the radiation field which excites them. They also provide insight into the physical conditions such as density or pressure, and constraints on the metallicity of the circum-nuclear ISM.
As AGN are often heavily dust-embedded, much of the line emission from the near nuclear parts of the NLR may be totally obscured at optical wavelengths. To penetrate this circum-nuclear dust while retaining adequate spatial resolution to investigate the structure of the dense parts of the NLR, we need to observe at mid-IR wavelengths. Instruments such as the IRS instrument of the Spitzer Space Telescope are finally providing the data needed to study this region. In order to interpret this data we need both line and continuum diagnostics in the mid-IR.
Here, we will explore the expected characteristics of the infrared emission from the NLR, examine the dependence of this emission on the parameters that define the NLR, and investigate possible diagnostics that can be used to define these parameters and so give us insight into the NLR and the AGN as a whole.
2 Modelling the Dust in Narrow Line Regions
The effects of dust on the structure of the NLR and its influence of the emission line spectrum has been discussed in detail in previous papers (Groves et al., 2004a, b). Here we extend this work using a more realistic distribution of dust and considering in addition the stochastic heating of the dust to investigate the nature of the far-IR dust re-emission spectrum and its relationship to the line spectrum of the NLR.
The existence of dust around AGN is well accepted. Indeed, it forms an integral component of the unification scenario of active galaxies (Antonucci, 1992). That dust specifically exists within the NLR of AGN is also suggested by theoretical models (Netzer & Laor, 1993; Dopita et al., 2002) and is well supported by recent high resolution IR observations of nearby AGN (Alloin et al., 2000; Bock et al., 2000; Packham et al., 2005; Galliano et al., 2005; Mason et al., 2006).
Both the composition and size distribution of the dust in the NLR are still uncertain. Current observations (Gaskell et al., 2004) suggest that the properties of dust in the vicinity of AGN may differ to that found in our Galaxy. This would be unsurprising considering the gas pressure, UV radiation field and dynamics of this environment are all much more extreme than those found in the solar vicinity. Polycyclic aromatic hydrocarbons (PAHs), while common in our Galaxy and are observed in starforming galaxies, are not expected in the excited regions of active galaxies. This is because of the strong EUV and X-ray emission from the AGN, which are thought to effectively destroy PAHs though photo-dissociation (Voit, 1991, 1992). In the cases where PAH emission is seen in the nuclear regions of AGN, the emission is thought to arise from nuclear starbursts. The starbursts supply the Far-UV needed to excite the PAH emission, but would be shielded from the X-ray emission of the AGN by intervening dusty, obscuring material (Imanishi, 2003; Imanishi & Wada, 2004).
The lack of these planar linked benzene-ring molecules may also extend to small grains, with the smallest graphite and silicate grains possibly being similarly destroyed by the strong radiation field. As first suggested by Laor & Draine (1993), the idea that larger grains dominate the dust in AGN relative to that found in the Galaxy has been supported by observations such as the recent work of Gaskell et al. (2004), which demonstrated the much flatter attenuation curves in AGN in the UV. Maiolino et al. (2001a, b) explored the observational evidence for different dust properties within AGN and came to the conclusion that the most favorable scenario was one where large dust grains dominated the distribution of AGN dust. However, flatter attenuation curves may also arise in a highly clumpy dust distribution (Fischera & Dopita, 2004, 2005).
The composition of dust within AGN is also poorly constrained by observation. Metals appear to be depleted within the NLR gas, although the magnitude of this depletion is uncertain. In terms of extinction, the standard silicate + graphite dust appears to reproduce the observations reasonably well (Laor & Draine, 1993; Maiolino et al., 2001a, b), although additional dust components, such as diamond dust have also been suggested (Binette et al., 2005).
Using this information we have tried to construct a simple yet physically plausible model for the dust in the NLR clouds. We assume two types of dust: graphitic dust and silicaceous dust. The optical data for these are taken from work of Draine & Lee (1984), Laor & Draine (1993) and Weingartner & Draine (2001).
The grain size distribution of both types of dust is taken to be a power-law, with the index arising from grain shattering. Grain shattering has been shown to lead naturally to the formation of a power-law size distribution of grains with index (Jones, Tielens & Hollenbach, 1996). This is within the bounds of the standard Mathis, Rumpl, & Nordsieck (1977) value of . Such a grain size distribution can also hold only between certain limits in size, the minimum size being determined by natural destruction processes such as photodestruction, and the upper limit being determined by limits on the growth by condensation and sticking. These may occur within the AGN or previous to the dusty gas entering the energetic region. To capture these elements of the physics, we have adopted a modified grain shattering profile with the form;
| (1) |
This creates a smooth exponential cut-off in terms of the grain mass at both the minimum and maximum grain size of the distribution. This smooth cut removes any edge effects in either the emission or extinction by dust that arise due to the sharp cut-offs in the other distributions. To implement the larger grain dominated distribution discussed above, we have assumed that the smallest grains have been destroyed due to the energetic environment, and used a larger minimum grain size relative to Galactic of .
The constant k is determined by the total dust-to-gas mass ratio, which is determined by the depletion of the heavy elements onto dust. Our models use a solar abundance set (as modified by the latest abundance determinations Allende Prieto et al. (2001, 2002); Asplund (2000); Asplund et al. (2000)). The depletion factors are those used by Dopita et al. (2000) for starburst and active galaxy photoionization modeling and are similar to those found by Jenkins, Jura & Loewenstein (1987) and Savage & Sembach (1996) in the local ISM using the UV absorption lines to probe various local lines of sight.
Within the MAPPINGS iiir code, the dust grain size distribution is divided into 80 bins spaced logarithmically between 0.001–10 . The number of grains of each type in each bin is then determined by equation 1. The absorption, scattering and photoelectric heating is calculated for each size bin. This is then used to establish the temperature probability distribution for computation of the FIR re-emission spectrum with quantum fluctuations.
3 Calculating the IR Emission from Dust
In energetically active regions such as found around starbursts and AGN it is essential to take stochastic quantum heating of dust grains properly into account. In particular, the temperature fluctuations of grains serves to provide a population of small grains which are hotter than their equilibrium temperature and thus which show an excess in their mid-IR emission.
Temperature fluctuations and stochastic heating processes have been considered by several authors since Greenberg first proposed these ideas (e.g. Duley, 1973; Greenberg & Hong, 1974; Purcell, 1976; Dwek, 1986). The most detailed work on dust and temperature fluctuations has been a series of papers by Draine & co–authors (Draine & Anderson, 1985; Guhathakurta & Draine, 1989) culminating in a set of papers with Li (Draine & Li, 2001; Li & Draine, 2001).
The FIR emission treatment used in the MAPPINGS iiir code is based on the algorithms of Guhathakurta & Draine (1989) (GD89) and Draine & Li (2001) (DL01). The code provides an optimized solution of their algorithms to determine the dust grain temperature distributions for each grain size according to the both the strength and detailed spectrum of the local radiation field. The code then integrates the resultant FIR emission of the ensemble of dust grains to provide the local re-emission spectrum, which is itself integrated through the model in the outward-only approximation (Groves, 2004).
In general, the average temperature of dust grains decreases from the front of a photoionized cloud exposed to the radiation to the back as expected. However the average dust temperature is not an exact representation of the grains, with the largest grains at lower temperatures, then the temperature of the grains increasing with decreasing grain size. At a certain size stochastic heating becomes important and the probability distribution of the dust peaks at a temperature below the total average dust temperature, but with a tail extending to very high temperatures.
4 Narrow Line Region Models
The physical details of the dusty, radiation-pressure dominated photoionization models used here to model the IR continuum of the narrow line region clouds have been discussed in depth in previous papers (Groves et al., 2004a, b). Here we only provide a brief overview of the different input parameters and the parameter space explored.
4.1 Input Ionizing Spectrum
A simple power-law radiation field, with an index around and extending from the FUV to X-ray, is able to reproduce the dominant features observed in NLRs (see e.g. Osterbrock, 1989). However, when the full spectral energy distribution of the NLR is being considered a more physical representation of the ionizing spectrum is required. The main problem here is that the intrinsic spectrum emitted by the NLR is generally heavily obscured by the circum-nuclear interstellar matter in the active galaxy before it reaches the observer. This is especially true in the extreme-UV.
Our understanding of this region of the spectrum relies predominantly on photoionization theory and on the theory of accretion disk models (see eg. Alexander et al., 1999, 2000). This method gives insight into the spectrum, but is somewhat dependent upon the modelling used and the other model parameters.
However, recent work from Scott et al. (2004) and Shang et al. (2005) looked at QSOs beyond the Lyman limit using space telescopes, exploring not only the peak of the big blue bump of the QSO spectra but also the slope beyond this into the EUV. These new observations help to constrain the general shape of the AGN spectrum and thus the photoionization and accretion disk models.
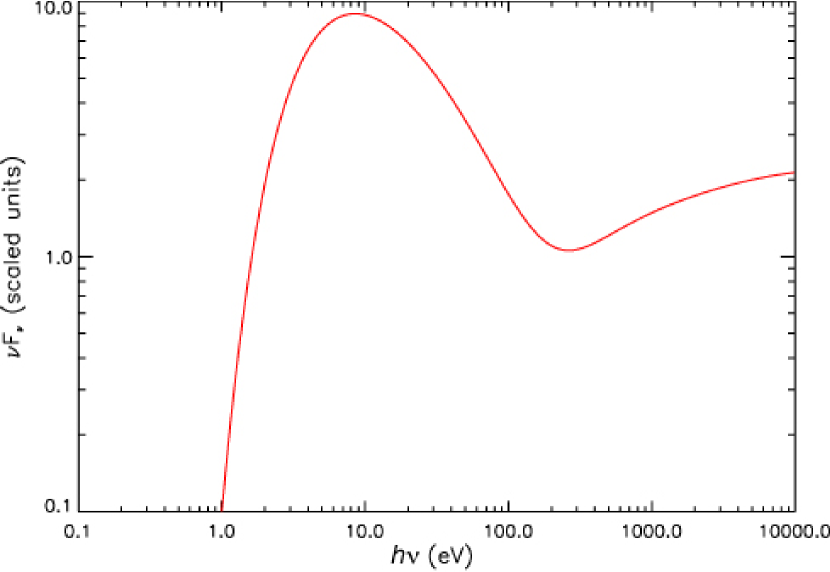
We have chosen here to base our input ionizing spectrum predominantly on the observations of Elvis et al. (1994), while still taking note of the Scott et al. (2004) and Shang et al. (2005) data. To fit the data we use a combination of two power-laws with exponential cut-offs (Nagao et al., 2001; Ferland, 1996),
| (2) |
The parameters are chosen to give the most plausible fit, concentrating on the ionizing spectrum. The final spectrum, shown in figure 1, is similar to the 3-part broken power-law often used in photoionization models. The first parameter, , is defined as the EUV power-law index, and hence controls the dominant part of the spectrum. It is chosen here to be , which gives a smooth fit from the peak of the big blue bump (BBB) and the soft X-ray. This fit is made smooth by the UV cut-off, with eV. The parameter defines the peak of the BBB, and is set to eV, which gives a peak around 110.0 nm, as found by Shang et al. (2005).
The second component of equation 2 represents the X-ray part of the AGN spectrum, which has an index of and an upper cut-off simply chosen to be eV to prevent errors. The parameter sets the scaling between the two components of the AGN spectrum, and is set to , which gives not only a good fit to the Elvis et al. (1994) data but also gives an optical-X-ray slope111Defined as in equation 1 from Nagao et al. (2001) of index , fitting in with previous photoionization models.
4.2 Narrow Line Region Metallicity and Dust Depletion
In previous work (Groves et al., 2004a, b) we found that the observed line ratios for NLR are consistent with a heavy element abundance of between solar and twice solar metallicity. Here, for simplicity, we compute models with solar metallicity, using the abundances from Dopita et al. (2005, with references therein). For the depletion factors, we follow our previous work and use those found in the local ISM due to our ignorance about what these factors are within the AGN environment. The solar abundances and depletion factors used are given in table 1.
| Element | Abundance222All abundances are logarithmic with respect to Hydrogen | Depletion333Depletion given as |
|---|---|---|
| H ……………………………. | 0.000 | 0.00 |
| He……………………………. | 0.987 | 0.00 |
| C ……………………………. | 3.61 | 0.30 |
| N ……………………………. | 4.20 | 0.22 |
| O ……………………………. | 3.31 | 0.22 |
| Ne……………………………. | 3.92 | 0.00 |
| Na……………………………. | 5.68 | 0.60 |
| Mg…………………………… | 4.42 | 0.70 |
| Al……………………………. | 5.51 | 1.70 |
| Si…………………………….. | 4.49 | 1.00 |
| S ……………………………. | 4.80 | 0.00 |
| Cl……………………………. | 6.72 | 0.30 |
| Ar…………………………… | 5.60 | 0.00 |
| Ca…………………………… | 5.65 | 2.52 |
| Fe……………………………. | 4.54 | 2.00 |
| Ni……………………………. | 5.75 | 1.40 |
4.3 Choice of Variables
The density and ionization structure of dusty, radiation-pressure dominated photoionization models used to represent the NLR has been described in detail in Groves et al. (2004a). Here, we follow this prescription in most respects. However, we here define the initial parameters in a slightly different manner in order to provide the clearest distinction in distinguishing the effects of each parameter upon the infrared emission.
As discussed in the previous work, it is the total pressure of the system which defines the density structure of the ionized plasma. The total pressure is the sum of both the local gas pressure and the incident radiation pressure and can be set as a parameter through setting both of these quantities. In a static cloud, assumed here, the (negative) gradient of the local radiation pressure must match the (positive) gradient of the gas pressure. The effective radiation pressure imparted as gas pressure at any point in the cloud depends upon both the local ionizing spectrum (both shape and flux density) and the optical depth (a function of both the column density and the opacity of the gas). As our models have the same ionizing spectral shape, the only parameter at a given optical depth is the incident flux density of the ionizing radiation.
Thus at a given optical depth, such as near the ionization front (where the dominant ionizing radiation has been absorbed), we have:
| (3) |
is the initial gas pressure of the NLR cloud, is a constant which includes the effect of spectral shape and gas and dust opacity, and is the incident ionizing flux density upon the NLR cloud.
This results in the same density structure as shown in Dopita et al. (2002) and Groves et al. (2004a), however with a much better defined input. The definition of density structure is important as it allows us to distinguish which variations in the IR emission arise from changes in the ionizing flux or the NLR density structure.
4.4 Parameter Space of Models
Within this work we explore three different total pressures, , , and K, which simulate [S ii] densities of approximately and respectively.
For each pressure regime we have investigated a range of ionizing flux densities. This range has been chosen to give a reasonable representation of the typical ionization conditions found within the NLR. The values of the input flux densities and corresponding initial gas pressures are given in table 2. The total flux density has been normalised by the factor 3.8098( (or for ionizing flux density by 2.0864(). This factor results in a ionizing photon density centered around for the models, giving a range of ionization parameters centered approximately around .
Traditionally, the ionization parameter 444The ionization parameter is a dimensionless measure of the number density of ionizing photons (), over the gas density; . has been used to describe photoionization equilibrium conditions. However in isobaric systems this parameter is harder to define. So we present here two parameters for comparison. The standard ionization parameter as a reference to previous work, and the parameter,
| (4) |
a more suitable parameter to describe the ionization equilibrium in isobaric systems (Krolik et al., 1981). To convert to include the total incident flux density rather than just the ionizing flux, multiply by 1.826.
As the initial density is uncertain in isobaric models, we define the ionization parameter in terms of a normalised initial ionization parameter, . This parameter assumes a temperature of K to obtain the initial density from the input gas pressure. As the initial temperature usually exceeds K, and the initial temperature increases with ionization parameter, the normalised initial ionization parameter underestimates the true initial ionization parameter. This becomes increasingly so for higher values. The value of both and for each model are given in table 2.
| 4.0 | 1.00 | 20.16 | -0.40 |
| 3.0 | 3.20 | 4.73 | -1.03 |
| 2.0 | 5.40 | 1.87 | -1.43 |
| 1.0 | 7.60 | 0.66 | -1.88 |
| 0.5 | 8.70 | 0.29 | -2.24 |
| 0.25 | 9.25 | 0.14 | -2.57 |
| 0.1 | 9.58 | 0.05 | -2.98 |
The models are truncated at a column density of (H i), a reasonable estimate for the NLR clouds (e.g. Crenshaw et al., 2003), which means that we are comparing like absorbing columns when determining the IR emission.
5 Narrow Line Region SEDs
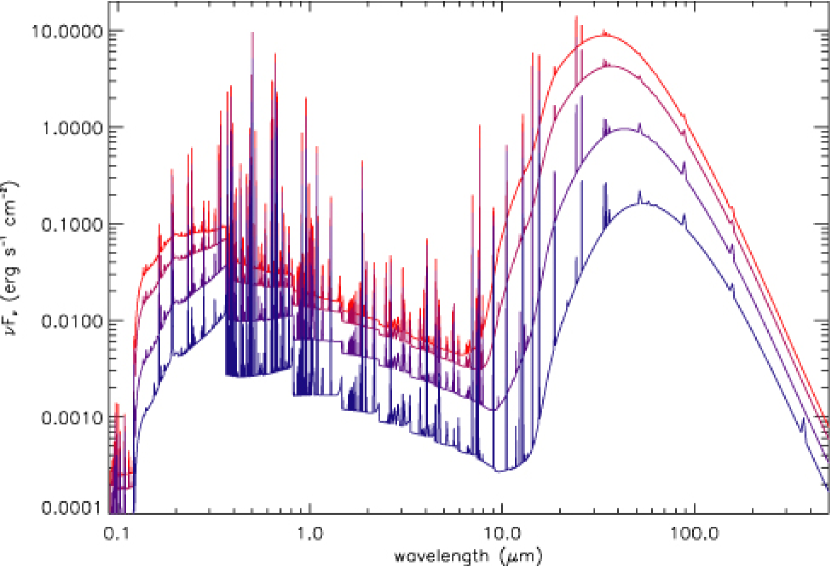
The resulting Spectral Energy Distributions (SEDs) for the model are shown in figure 2. The figure shows four SEDs corresponding to .
In this figure we see several features which arise due to the combination of the changing ionizing flux density and the changing ionization parameter. The offset between the SEDs arises due to the difference in input flux density. A greater incident ionizing flux density results in a greater nebular suface brightness. However, the correlation between the resulting nebula surface brightness or emission measure and incident ionizing flux density is not one to one, due to the varying ratios of dust absorbtion compared with absorption in the gaseous phase.
The ionization parameter is one of the main determinants of a nebula emission spectrum (see e.g. Dopita & Sutherland, 2003), and also relates to the dust dominance of ionizing photon absorption (Dopita et al., 2002). This parameter has a strong effect on the overall shape of the final nebula spectrum.
The effect of this parameter on the gaseous emission can be seen, in particular, in the stronger H i (eg. Balmer) edges as we move to lower ionization parameters. This is predominantly due to the lower electron temperatures which characterize the models with lower ionization parameter. The effect of dust can also be seen in several ways. For example, the greater overall extinction by dust, the greater flux in the UV arising from the input continuum scattered by dust, and the intensity of the dust far-IR emission bump.
As we increase in ionization parameter, the fraction of UV flux absorbed by dust increases, and this combined with the increase in the ionizing intensity results in a greater total of IR emission by dust. It also results in hotter dust on average, which means the peak of the IR feature is shifted to shorter wavelengths and the flux in the mid-IR is greater.
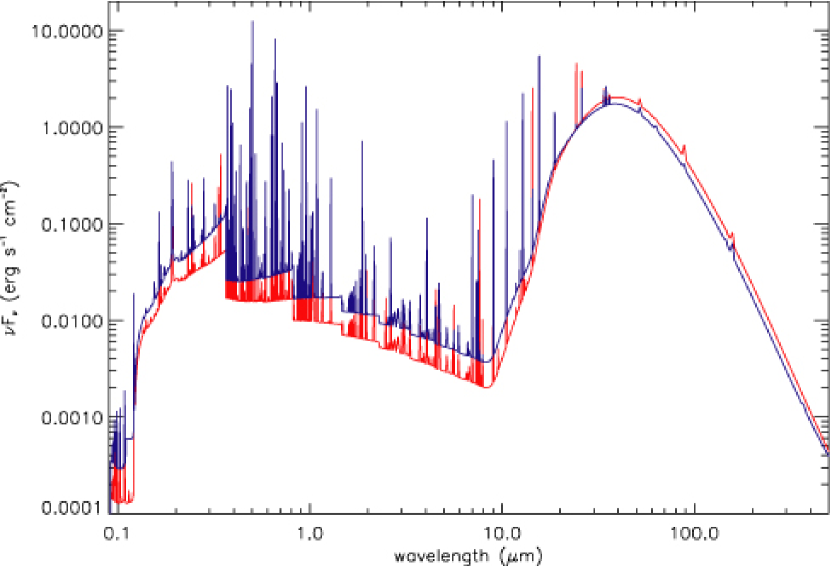
The effect of ionization parameter is more clearly seen in figure 3, which shows two models with the same input ionizing intensity, but different total pressures, giving different ionizing parameters. The higher ionization parameter model (with K ) shows a stronger IR dust feature relative to the lower ionization parameter model ( K ). The dominance of dust absorption is most obvious however in the mid-IR to the optical-UV, where the log-scale emphasizes the separation in the models. This arises predominantly due to the loss of ionizing photons to dust in the higher model which results in a weaker free-free and free-bound continuum. This increased absorption also produces more prominent FUV absorption.
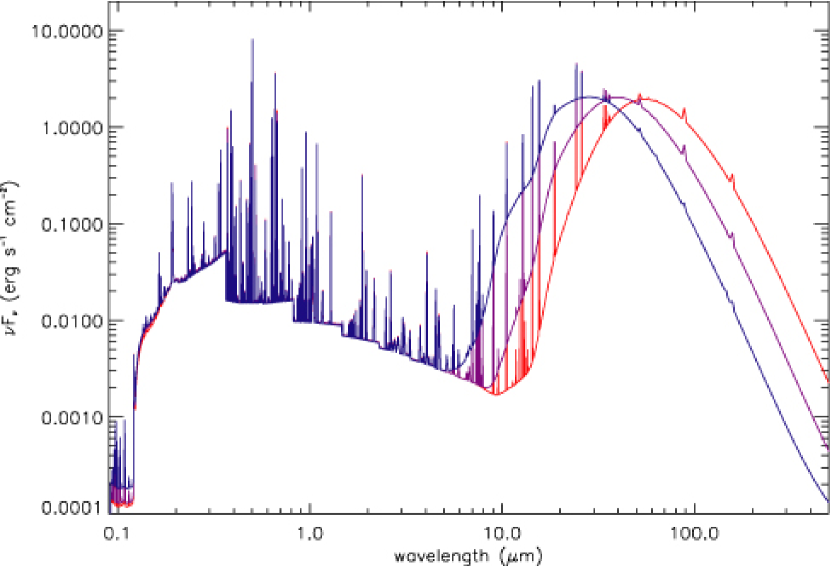
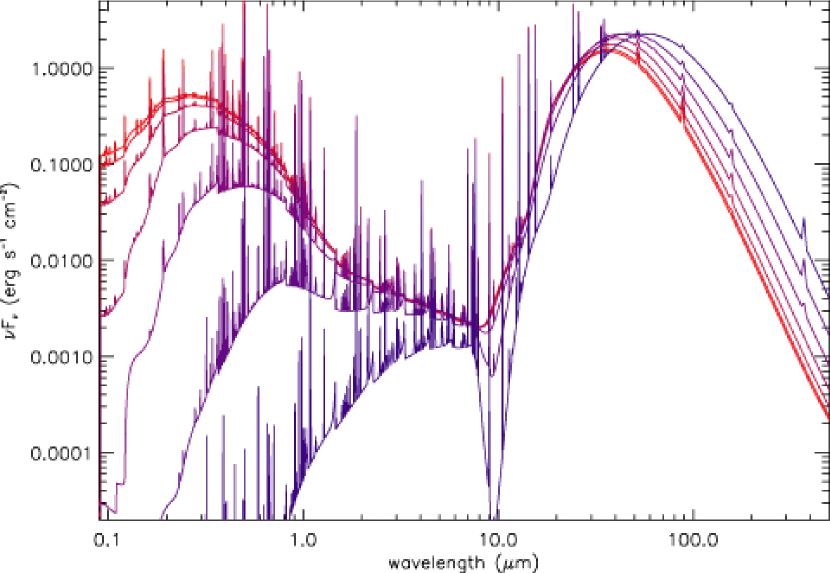
To demonstrate the relative features that arise due to pressure changes, figure 4 shows three model SEDs with the same initial ionization parameter () but with different . To account for the different input flux densities, the models have been scaled by 10.0, 1.0, and 0.1 for the models of and K respectively.
Since they have the same ionization parameter, the gaseous line and continuum emission spectra of the models are very similar. However, the progression of the dust IR re-emission bump feature to shorter wavelengths as we increase in is very marked. This progression can be explained by the increasing flux density experienced by the NLR cloud as the pressure increases to maintain the constant ionization parameter. The increasing incident flux density leads to higher average grain temperatures in the absorption region and thus stronger short wavelength emission.
The UV spectra show that the same optical depth characterizes all three models. With the same fraction of the absorbed UV light heating the dust, the relative flux emitted by the dust in all three models is the same, as can be determined from figure 4.
When the models are allowed to continue to greater optical depths, the lower flux densities mean that the dust emits at longer wavelengths. However, once the UV flux from the source is lower than the IR peak on a plot, we don’t get much more far-IR emission, rather the dust peak merely becomes a little wider (see next section). Thus the dust is hotter at all optical depths for a greater incident flux density.
Of special note is the presence of silicate emission features in the models with the highest incident flux densities. This indicates that in the most luminous AGN or most nuclear narrow line regions, such emission is possible.
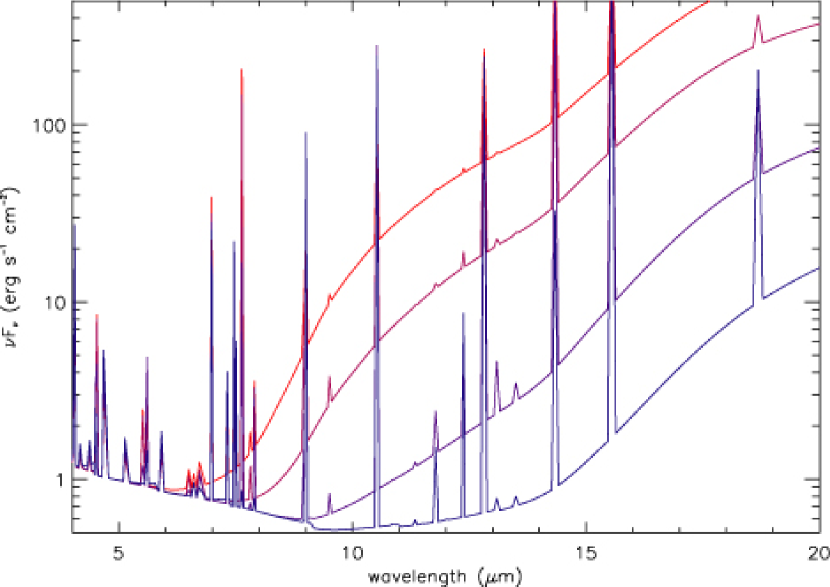
Figure 5 zooms in on the mid-IR region of the K SEDs of figure 2. This figure reveals in more detail the silicate features, especially that at 10 . The 18 feature is less visible due to the shape of the IR continuum and its relative weakness. The figure also demonstrates more clearly the increasing maximum temperature achieved with higher incident fluxes, with the decreasing wavelength or the IR feature edge.
5.1 The Effect of Column Depth
One final parameter to consider in the determination of NLR dust emission is the total column density of the narrow line region. The previous models were all calculated to a total column of H i, such that they were predominantly ionization bounded. The column density affects the final line emission spectrum from the models as we either encompass (with increasing column density) or truncate (with lower column density) the various emission regions for each species.
As far as the dust is concerned, the greater the column density, the greater the optical depth of dust. At large column densities, most of the UV radiation field has been absorbed, and therefore the dust is at lower temperatures and emits weakly at longer wavelengths. Figure 6 shows the effect of increasing the final column depth in a model with pressure of K and ionization parameter of . The column density is increased from to in steps of 0.5 dex.
As expected, the low H i column depth models show less extinction by dust and have a narrower and hotter dust emission bump. The highest column depth models have most of their optical absorbed by dust and show a much broader and stronger dust emission feature. The emission from the coolest dust arises predominantly from the largest optical depths in the models. This emission comes from the absorption of the low flux density visible and near-IR photons.
The spectrum in the 10-30 is almost invariant with increasing optical depth until absorption becomes important, especially in the strong 10 Silicate feature. This is because the flux here is entirely contributed by the hottest dust in the ionized gas or just behind the ionization front. Strictly speaking, as these models are 1-D the results become unrealistic for high column densities. More realistic 3-D treatments of the dust radiative transfer is required in these cases, especially as we are most likely viewing the NLR at various angles and do not in general have a direct line of sight through the obscuring material to the emitting edge of the NLR clouds.
6 Discussion
6.1 The Shape of the NLR IR spectrum
It is only in recent times that the resolution of infrared telescopes has been high enough to begin to spatially resolve the emission from narrow line region, and only in the nearest of active galaxies (Bock et al., 2000; Galliano et al., 2005). In all other active galaxies it is difficult to distinguish the relative contributions of starbursts and of AGN in the nuclear regions. Nonetheless, it is important to try to do this, in order to understand the energetics of the nucleus as a whole, as well as the proposed AGN - starburst connection.
A comparison of the model spectra shown in the previous section with the recent high spatial resolution spectroscopy of NGC 1068 by Mason et al. (2006) reveal several similarities. The observed NGC 1068 NLR spectra (Mason et al., 2006, Fig. 2,), show that the wavelength of the spectral break between the nebula and dust continuum decreases with closer to the nucleus. This indicates hotter dust temperatures with increasing incident flux, exactly as in the models. The more nuclear spectra also show increasing silicate absorption due to increasing optical depth. This probably precludes the detection of any silicate emission from the inner NLR or nucleus itself.
However the observed NLR spectra also reveal much flatter Mid-IR spectral slopes than obtained in most of the NLR models. The observations also indicate that the dust is hotter than found in our simple models discussed here. This suggests that there is some component of dust that the models are missing. This is supported by the measurements of Gratadour et al. (2006) who find constant high temperatures of 500 K out to 70pc from the nucleus of NGC 1068, where the NLR lies. This is much hotter than can be predicted from simple NLR models (Barvainis, 1987).
The NLR of AGN most likely obtains a greater range of density and ionization than seen in our single cloud models which would soften this slope with the combination of both high and low temperature dust. More importantly it would also contain a mix of density-bounded (low H ii column density) and ionization bounded (low final H ii fraction, as in the models presented here) clouds. This mix would allow the contribution of hot dust emission without significant absorption, as well as the stronger cool dust emission. This can also be accomplished though the combination of low covering factor hot dust, and large covering factor cool dust in a 3-D geometry.
Smaller dust grains may provide another possible way for the models to reach higher temperatures. Currently, the average dust temperature of the front of the ionized cloud in the higher ionization is 250 K, and cooler temperatures as we step into the cloud. The smallest grains in the model, while having an average temperature lower than this, occasionally reach much higher temperatures due to stochastic effects, and provide the hottest IR. They also tend to dominate the emission due to the grain distribution and larger surface area to mass. Thus, extending the distribution to even smaller sizes increases the hottest dust emission, although it does not assist greatly in flattening the Mid-IR slope.
Another possible explanation for the difference between the model and observed slope is alternative heating mechanisms not considered within these models, such as shocks. Although collisional heating is taken account of in the models, shock heating and destruction of dust grains can result in a much hotter IR spectrum, as considered in detail by Contini et al. (2004). Even though emission line ratios indicate that photoionization is the dominant ionization mechanism of the NLR in most AGN, the correlation of jets with the NLR and high gas temperatures and velocities observed within the NLR all indicate the shocks play a part in this region (see eg Almudena Prieto et al., 2005). The combination of shock and radiation heating of dust may explain the observed slope and dust temperatures observed in the NLR of NGC 1068 and other AGN.
6.2 The IR flux from the NLR
While the contribution of the nucleus to the IR emission will presumably scale with the luminosity of the nucleus itself, the contribution of the NLR to the total IR emission of a galaxy will depend upon both the AGN luminosity and the NLR covering factor. The models presented here allow, in principle, an estimation of the contribution of the NLR to the far-IR continuum. This exploits the coupling that exists between far-IR dust emission of the NLR and the emission lines generated within the NLR.
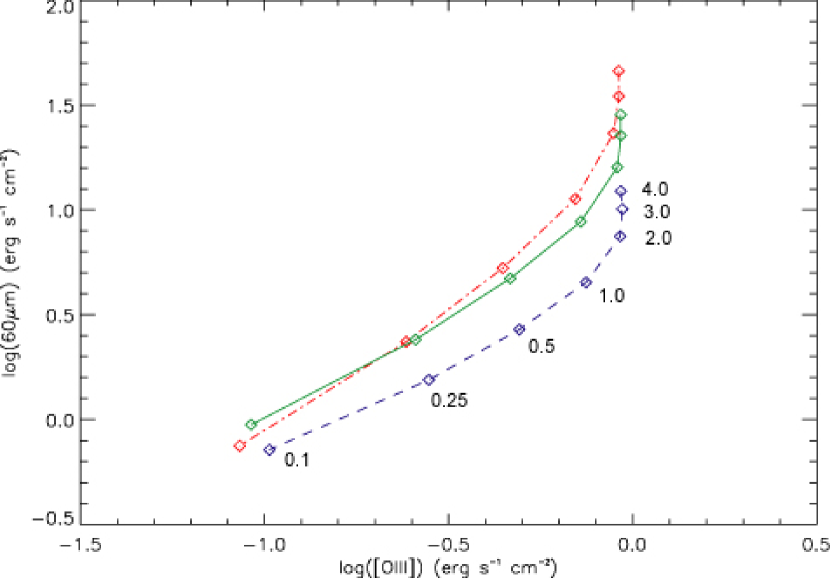
Figure 7 shows the relationship between the strongest emission line indicator for NLRs and AGN, the [O iii] 500.7 nm line, and the IRAS 60 flux (broadly equivalent to the the Spitzer MIPS 70 band). Note that the models have been scaled to remove the effect of source intensity, as an increase in source luminosity will result in both higher [O iii] and 60 luminosity, when other parameters are kept constant. The ratio of the two fluxes shows some variation due to pressure, but more due to changing ionization parameter. At low ionization parameter, , but at the highest ionization parameter . However both pressure and ionization parameter can be estimated through the measurement of other emission lines such as [S ii] and H (see e.g. Groves et al., 2004b), reducing the possible range of the [O iii]/60 ratio.
A potential problem in comparing the two fluxes is that the [O iii] line may be heavily extinguished by dust along some lines of sight. In these cases, the theoretical ratio of the 60 flux to the [O iii] 500.7 nm line can be used to provide an upper estimate of the NLR luminosity. However, a better measure of the AGN luminosity absorbed by the NLR may be obtained using IR emission lines such as [Ne v] 14.3 or [O iv] 25.8 .
The 60 flux is also affected by the extent of the absorbing column of the NLR, with greater columns giving greater IR flux. A better measure would be to use the 25 band as it remains much less affected by the column depth, at least up to the point where Silicate absorption becomes important (H i, figure 6). At these columns the IR emission lines will likewise be affected by dust extinction. The 25 band is also where the NLR flux is most likely to dominate, lying between the 12 band, dominated by hot torus-like dust, and the FIR bands (60 and 100 bands) where star formation is most likely to dominate.
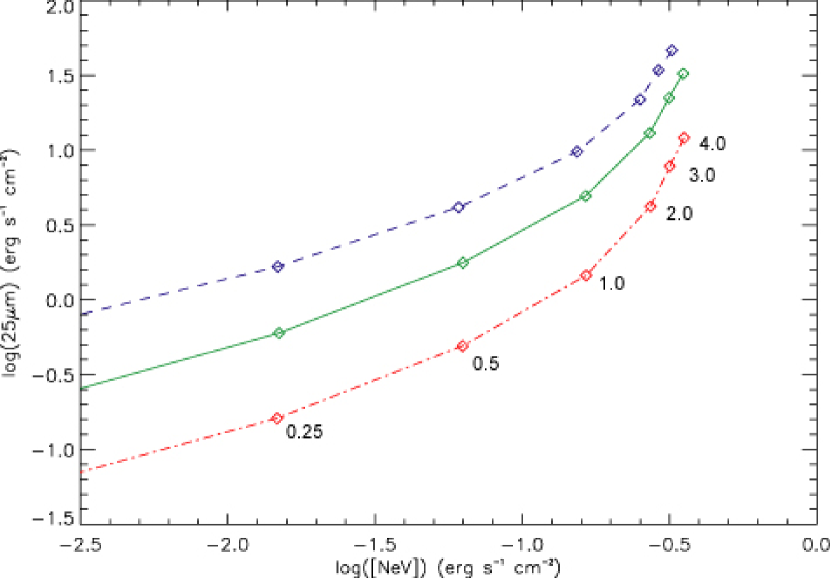
The [Ne v] 14.3 flux is plotted against the IRAS 25 flux in figure 8. The 25 continuum shows a much greater sensitivity to pressure due to the changing temperature of the hottest dust. The [Ne v] line is much more sensitive to the ionization parameter than the [O iii] line. Together, these effects are expected to produce a scatter of ten in the correlation between the [Ne v] 14.3 and the IRAS 25 fluxes.
If we combine these lines we can get a good diagnostic for both the fraction of infrared emission arising from the NLR and the extinction experienced in the optical. Figure 9 demonstrates this with the ratio of [Ne v] 14.3 /25 versus [O iii] 500.7 nm/25 . The first ratio gives an estimate of the NLR contribution to the 25 flux. If the observed value of this ratio is less than that given by the models, then it suggests that not all of the 25 flux arises from the NLR. However, the 25 flux is strongly affected by the pressure of the models, or more precisely the incident flux density at a given ionization parameter. At a given ionization parameter, as the pressure and incident flux are increased, the [Ne v] 14.3 line remains approximately constant, at least for the lower densities. However with the increase in incident flux, the 25 flux is increased, decreasing the [Ne v]/25 ratio. Thus the pressure or incident flux must be determined to give an accurate estimate of this ratio. In the IR this can be done using the density sensitive ratio of [Ne v] 14.3/24.3 (see figure 10), thus connecting directly with this diagram.
The [O iii]/25 ratio can also provide an estimate for the NLR contribution to the IR, but in addition gives an indication of the obscuration of the NLR. As the NLR becomes more heavily obscured this ratio will be reduced by the loss of the [O iii] line.
This can be seen in the two observational points in this diagram. NGC 1068 and NGC 4151 are two of the closest and most studied active galaxies. Respectively these are quite often used as the representative Type-2 and Type 1 AGN, corresponding to strongly obscured, edge-on, and lightly obscured, face-on AGN in the unified model.
NGC 4151 appears to the lower left of the region occupied by the models. The observed mid-IR [Ne v] and [S ii] lines give a density of (figure 10), indicating the ratios are less by 1.0 to 1.5 dex. This suggests that the NLR contributes only about 3 – 10% to the total 25 emission, depending on the ionization state of the gas.
NGC 1068 has a similar [Ne v]/25 ratio to NGC 4151, [O iii]/25 ratio of NGC 1068 appears less by dex compared to NGC 4151. While the higher density of NGC 1068 indicated by the mid-IR lines ( , figure 10) and a differences in the average ionization parameter can possible explain this difference, some part of the difference may also arise from the attenuation of the [O iii] flux. This would fit within the Type-1 and 2 paradigm and is supported by the NGC 1068 emission line asymmetries (Lutz et al., 2000) and estimates of low reddening in NGC 4151 (Kriss et al., 1995).
Assuming a higher density of and higher ionization parameter figure 9 suggests that the NLR of NGC 1068 has a similar contribution of about 3 – 10% to the total 25 emission.
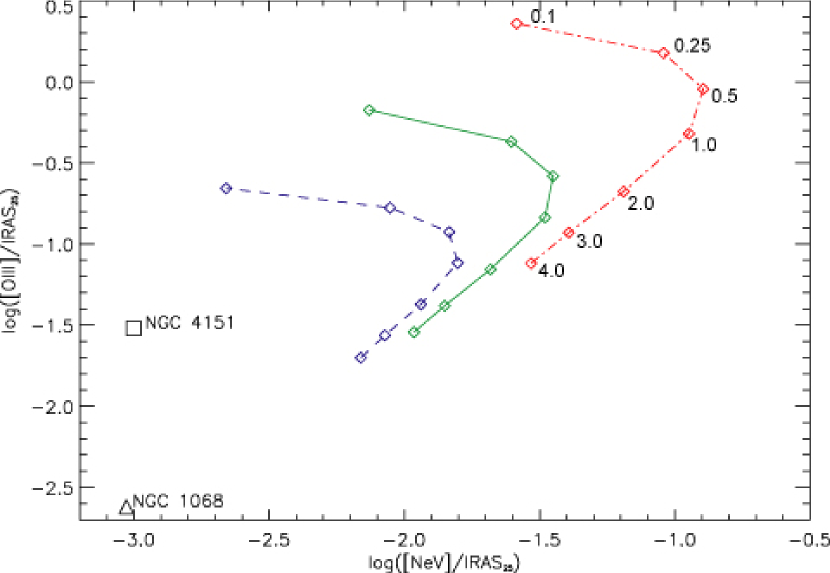
Obviously this is a low contribution, and means that there are other effects not considered within the simple models presented here.
One possible consideration is the effect of aperture. The [Ne v] emission line arises only from the AGN, and likewise the [O iii] is dominated by the AGN contribution. By contrast, the IRAS aperture is large and can include the contribution of star formation in both NGC 1068 and NGC 4151. Recent high spatial resolution observations suggest that this contribution is not large, approximately 10% or less (Bock et al., 2000; Radomski et al., 2003). This does not preclude any nuclear star formation contribution within the resolution of these observations.
Another possibility is that the NLR of these objects is a different metallicity to that considered here. Most AGN NLR appear to be best fit by metallicities of about Z⊙ (Groves et al., 2004b). An increase in metallicity would increase the dust absorption relative to the gas and hence the IR emission. The increase relative to the [Ne v] line is more uncertain as it is not depleted onto dust, but will be weaker due to the lower gas temperature in higher metallicity gas. In addition to metallicity differences, an increase of the dust to gas ratio through increased depletion could also increase the contribution of the NLR to the total IR, though it must be balanced with the line emission.
However the most likely possibility is that there are other components of IR emission not contained within our simple models. The most obvious of these is the putative torus, or more precisely, the equatorial dusty gas that is needed to explain the unified model, and probably associated with the accreting gas. This gas must be of a high enough density that it has no associated forbidden emission lines, such as [O iii], are emitted and close enough to the nucleus that hot dust temperatures are achieved.
In addition to this there may also be dusty coronal gas, within the NLR that is so hot that species such as O iii have been ionized. While dust may have only a short lifetime within this region due to sputtering, the covering fraction of this gas may be large enough to contribute to the total IR emission.
Connected with this is the possibility of shock dust heating. As mentioned in the previous section, shocks are known to exist within AGN, and may contribute to the total IR emission. Contini et al. (2004) were able to explain the IR spectrum and flux of several AGN using shocks alone, suggesting that they may be a viable contribution to the total IR.
One other source of dust heating may be nuclear star formation. Nuclear starformation is known to exist in several AGN through the presence of PAH emission features (Imanishi & Wada, 2004, eg), and will contribute to the total IR emission without contributing to the [Ne v] emission. Nuclear star formation may contribute to other emission lines however such as [O iii], though the optical-UV lines may be heavily attenuated.
6.3 Mid-IR Emission Line Diagnostics
Any nuclear star formation will also produce emission lines, although not of as high ionization potential as Ne v. A potential means to separate the contribution to the IR originating from AGN and that coming from circum-nuclear star formation is therefore to examine IR line flux ratios. Diagnostic ratios from ISO, such as that of polycyclic aromatic hydrocarbon (PAH) features against the hot dust continuum or strong emission lines (Lutz et al., 1998; Genzel et al., 1998; Lutz et al., 2003), have also been considered for this purpose. Here, we restrict our examination to the IR emission lines found in both starforming galaxies and AGN.
The choice of IR emission line diagnostics is similar to that in the optical regime. The chosen emission line ratios must be strong, and generally obtainable within the same spectral range. One important difference is that extinction and reddening of the lines is no longer a strong criterion for line choice. Several good diagnostic ratios have previously been suggested by Alexander et al. (1999) and Sturm et al. (2002).
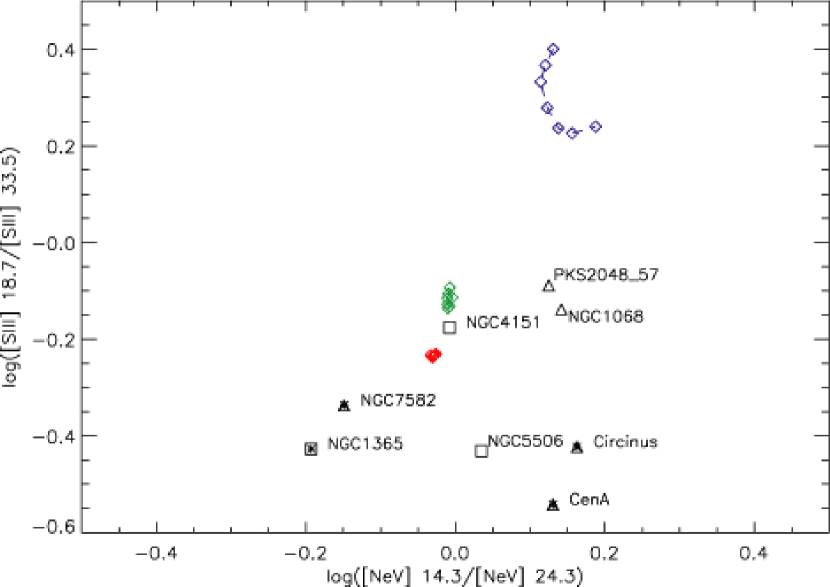
Two such ratios discussed in previous works are the density sensitive line ratios [Ne v] 14.3/[Ne v] 24.3 , and [S ii] 18.7/[S ii] 33.5 , as shown in figure 10 (see Alexander et al., 1999, for a description of density sensitivity). These ratios can help remove some of the uncertainty seen in the previous diagrams. In this figure (and figures 10 and 12) the observational data is from Sturm et al. (2002), with relevant discussions on the precision of the data found within.
Both ratios consist of strong IR lines and remove direct ionization and metallicity effects. As [Ne v] is such a high ionization species, it arises purely from the NLR, and in particular gives an indication of the densities in the hot, highly ionized regions. The [S ii] ratio gives an idea of the densities in the cooler parts of the NLR, but can also be contaminated by emission from nuclear star formation.
Such a contribution may explain the offset between the observed AGN and the models, where the [Ne v] ratio suggests a higher density than the [S ii] ratio for several objects. However, no coincidence with associated starbursts is seen (starred objects). Another possibility is that the region of the NLR where the [S ii] lines arise is at a lower density than the [Ne v] region. Like previous work, we use the [Ne v] ratio for our estimated density.
To separate the nuclear starformation from AGN activity, the line ratio diagnostics generally depend upon lines that have either an ionization beyond that found in star forming regions, such as [Ne v] 14.3, or are sensitive to the extended partially ionized region found around AGN, like [Si ii] 34 . Such examples are shown in Sturm et al. (2002). The problem with the high ionization potential lines is that they are very sensitive to the ionization conditions of the nebulae. Similarly, the lines arising in the partially ionized region are generally matter bounded, and are sensitive to the total column depth of the emitting region.
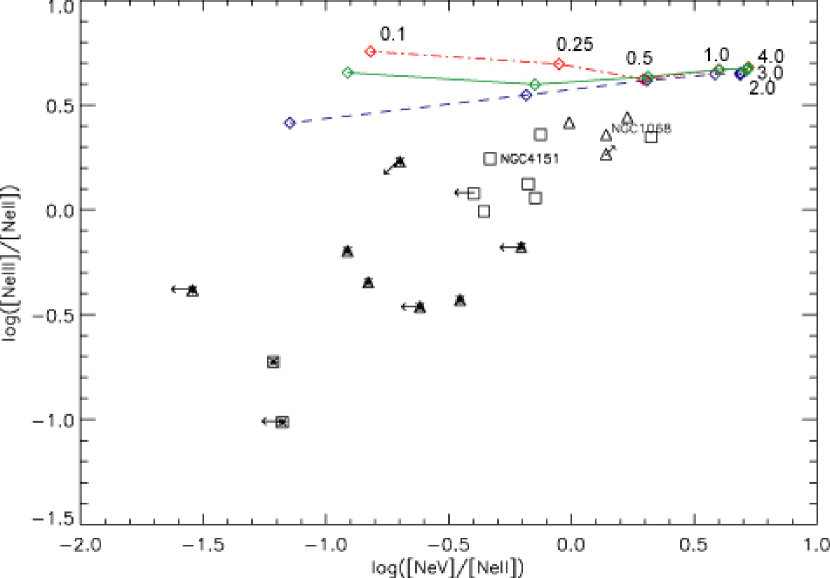
Figure 11 shows a diagram which partly avoids these problems. It uses three close proximity, strong neon emission lines; [Ne ii] 12.8 , [Ne v] 14.3 and [Ne iii] 15.5 . The [Ne v]/[Ne ii] ratio is a strong indicator of the AGN contribution, as a nuclear starburst (SB) will only contribute to the [Ne ii] line and thus only weakens this ratio. Typical NLR values for this ratio are 3 – 10. However as seen from the model curves in figure 11 this ratio is very sensitive to the ionization conditions, thus is degenerate between AGN-SB mixing and ionization. The second neon ratio, [Ne iii]/[Ne ii], helps to remove this degeneracy. As shown by the model curves, it is much less sensitive to the ionization state of the gas. While starbursts produce both these emission lines, the ratio is much lower than found in AGN (depending upon the metallicity of the SB).
The usefulness of this diagram can be seen in the distribution of the observed AGN, with all objects with a known starburst component lying to the lower left of the diagram. A possible empirical dividing line for starburst affected AGN then suggested by this diagram is
| (5) |
A more theoretical mixing diagram will be presented in future work.
One possible source of error in this diagram in stronger starbursting galaxies, is the proximity of the neon emission lines to the PAH emission bands, which may make measurement of these lines difficult (see e.g. Weedman et al., 2005).
6.4 Distinguishing the NLR and Dusty Torus in IR Emission
While the line diagnostic ratio diagrams are a good way to separate the contribution of starformation and AGN to a spectrum, separating the contribution of the NLR and the putative inner, dusty torus is more difficult. The only possible way is to use line–continuum ratios, either as equivalent widths or line–band ratios. Figure 9 shows one possible diagnostic diagram, though this requires the subtraction of any star formation contribution to the 25 flux to properly determine the torus contribution.
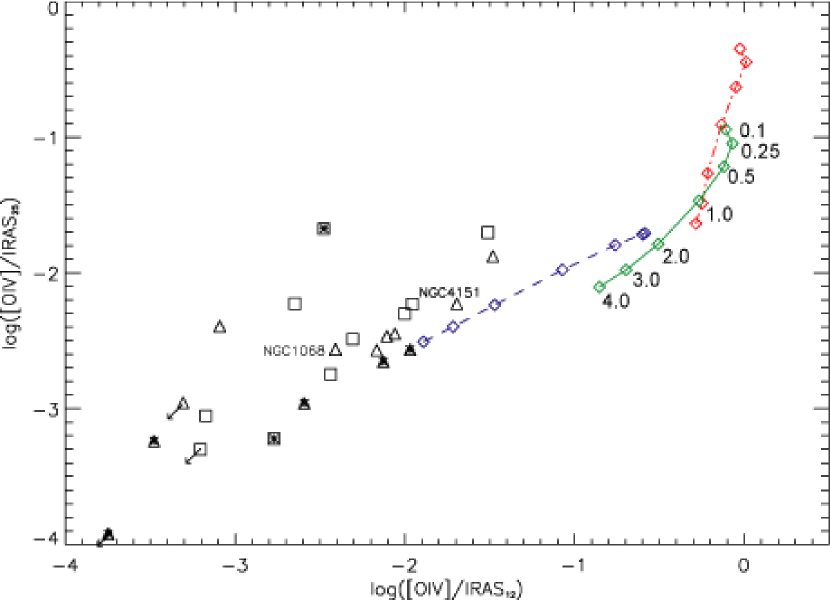
A possible alternative to this is shown in figure 12. It uses a strong, high ionization emission line, in this case [O iv] 25.9 , against the 25 and 12 IRAS fluxes. This diagram is similar to the IRAS colour–colour diagrams (see eg Dopita et al., 1998), but includes the Mid-IR emission line to account for the IR emission from the NLR. We expect the dusty torus to be significantly hotter than the NLR, and thus show stronger emission at shorter wavelengths. Therefore the emission at 12 should be less correlated with the [O iv] emission line than the 25 flux.
The observations support this, with the observed AGN appearing 0.5 to 1 dex lower than the models in [O iv]/25 , but approximately 1 to 2 dex lower in the [O iv]/25 ratio. This diagram also gives an indication of a much greater contribution of the NLR to the IR flux, and reveals the need to use several line ratios to get a good indication of the NLR contribution. Depending on the density assumed, the [O iv]/25 ratio indicates a NLR contribution of 10–50% to the 25 flux, and a weaker contribution to the 12 flux. Determining the exact contribution of the NLR to the total IR will depend upon both the shape of the torus IR feature and the diffuse IR emission.
A NLR contribution of 10–20% to the mid-IR flux is not unreasonable and fits in with observations. High resolution observations also show the dominance of the torus, with sub-arcsecond images of NGC 1068 indicating that around 75% of the Mid-IR emission arises from the unresolved core where the torus lies (Bock et al., 2000).
In terms of energetics, the contribution of the NLR depends critically to the covering fraction of the NLR which is an unknown quantity. If dust is ignored, a H line emission analysis of nearby Seyferts gives a covering fraction of only – (Netzer & Laor, 1993). However, when dust is included it competes with Hydrogen for the ionizing photons (Dopita et al., 2002), and thus much greater covering fractions are possible. Likewise, observations of nearby Seyfert galaxies appear to support a covering fraction greater than a few percent (Netzer & Laor, 1993).
Another indicator that the NLR may have a large covering fraction is the observations of UV or “associated” absorbers. These absorption systems are believed to have a covering fraction 50% (Crenshaw et al., 2003), and several observation indicate a possible connection between these and the NLR (Cecil et al., 2002; Crenshaw & Kraemer, 2005). While these systems do not have the column density observed in the NLR, figure 6 shows that such systems can still contribute to the IR emission if they contain dust. Thus a NLR contribution of to the total IR flux in AGN is not unfeasible.
As a last point, while these models do not represent in any form the putative torus around the AGN from the unified model, this work can be extended to this region, albeit without the consideration of geometry. As we increase the density and incident flux onto the models we start to reach the possible physical conditions within the torus, as the appearance of silicate emission in figure 5 shows.
7 Conclusion
We have explored within this work a series of Dusty Narrow Line Region (NLR) models, covering a range of realistic pressures and ionization parameters, with the aim of investigating the Infrared emission from dust in these regions.
The presented spectral energy distributions (SEDs) for these models reveal the possible range of the IR emission from the NLR, and the correlation of this emission with the ionization parameter and the intensity of the ionizing radiation. An increase in either of these parameters will increase both the total IR flux from the dust and the peak temperature of the dust.
Comparisons with observed NLR IR spectra show that simple 1-D photoionization models are not enough to represent the complexity of the NLR. Combinations of different NLR clouds and NLR dynamics may be needed to represent a more accurate model of the NLR IR emission.
While examining the spectral energy distributions of these models gives an idea of both the overall emission from the NLR of active galaxies, the greatest benefit of these models is that they give a direct connection between the emission by dust and the line emission from the photoionized gas. A selection of correlations between line and dust emission are presented here to give possible diagnostics for the IR emission from AGN and galaxies. In addition we have explored further possible IR emission line diagnostics to assist in the determination of the NLR physical conditions, and to help distinguish the contribution that starformation makes to the total spectrum.
Comparisons of the models with the nearby AGN, NGC 1068 and NGC 4151, appear to show that only 10% of the 25 emission arises from the [O iii] line emitting region. This means a significant fraction must arise from either the putative torus, nuclear star formation, coronal–shock excited region, or some combination thereof.
While the fraction the NLR contributes to the overall infrared continuum of an active galaxy may be small, it is important to consider this component when trying to understand the full spectral energy distribution of AGN. The final aim will be to connect the emission from the NLR with what is occurring in the central engine and thus connect the emission lines with the total IR output of the AGN.
Acknowledgements.
M. Dopita acknowledges the support of both the Australian National University and of the Australian Research Council (ARC) through his ARC Australian Federation Fellowship. Dopita & Sutherland recognize the financial support of the ARC through Discovery project grant DP0208445.References
- Alexander et al. (1999) Alexander, T., Sturm, E., Lutz, D., Sternberg, A., Netzer, H., & Genzel, R. 1999, ApJ, 512, 204
- Alexander et al. (2000) Alexander, T., Lutz, D., Sturm, E., Genzel, R., Sternberg, A., & Netzer, H. 2000, ApJ, 536, 710
- Allende Prieto et al. (2001) Allende Prieto, C., Lambert, D. L. & Asplund, M. 2001, ApJ, 556, L63
- Allende Prieto et al. (2002) Allende Prieto, C., Lambert, D. L., & Asplund, M. 2002, ApJ, 573, L137
- Allamandola, Hudgins, & Sandford (1999) Allamandola, L. J., Hudgins, D. M., & Sandford, S. A. 1999, ApJ, 511, L115
- Alloin et al. (2000) Alloin, D., Pantin, E., Lagage, P. O., & Granato, G. L. 2000, A&A, 363, 926
- Almudena Prieto et al. (2005) Almudena Prieto, M., Marco, O., & Gallimore, J. 2005, MNRAS, 364, L28
- Asplund (2000) Asplund, M., Nordlund, A., Trampedach, R. & Stein, R. F. 2000, A&A, 359, 743
- Asplund et al. (2000) Asplund, M. 2001, A&A, 359, 755.
- Antonucci (1992) Antonucci, R. 1992, American Institute of Physics Conference Series, 254, 486
- Antonucci & Miller (1985) Antonucci, R. R. J., & Miller, J. S. 1985, ApJ, 297, 621
- Barvainis (1987) Barvainis, R. 1987, ApJ, 320, 537
- Binette et al. (2005) Binette, L., Magris C., G., Krongold, Y., Morisset, C., Haro-Corzo, S., de Diego, J. A., Mutschke, H., & Andersen, A. C. 2005, ArXiv Astrophysics e-prints, arXiv:astro-ph/0505587
- Blain et al. (2003) Blain, A. W., Barnard, V. E., & Chapman, S. C. 2003, MNRAS, 338, 733
- Bock et al. (2000) Bock, J. J., et al. 2000, AJ, 120, 2904
- Cecil et al. (2002) Cecil, G., Dopita, M. A., Groves, B., Wilson, A. S., Ferruit, P., Pécontal, E., & Binette, L. 2002, ApJ, 568, 627
- Contini et al. (2004) Contini, M., Viegas, S. M., & Prieto, M. A. 2004, MNRAS, 348, 1065
- Crenshaw & Kraemer (2005) Crenshaw, D. M., & Kraemer, S. B. 2005, ApJ, 625, 680
- Crenshaw et al. (2003) Crenshaw, D. M., Kraemer, S. B., & George, I. M. 2003, ARA&A, 41, 117
- Dopita et al. (2002) Dopita, M. A., Groves, B. A., Sutherland, R. S., Binette, L., & Cecil, G. 2002, ApJ, 572, 753
- Dopita et al. (2005) Dopita, M. A., et al. 2005, ApJ, 619, 755
- Dopita et al. (1998) Dopita, M. A., Heisler, C., Lumsden, S., & Bailey, J. 1998, ApJ, 498,570
- Dopita et al. (2000) Dopita, M. A., Kewley, L. J., Heisler, C. A., & Sutherland, R. S. 2000, ApJ, 542, 224
- Dopita & Sutherland (2003) Dopita, M. A., & Sutherland, R. S. 2003, Astrophysics of the diffuse universe, Berlin, New York: Springer, 2003. Astronomy and astrophysics library, ISBN 3540433627,
- Draine & Anderson (1985) Draine, B. T. & Anderson, N. 1985, ApJ, 292, 494
- Draine & Lee (1984) Draine, B. T. & Lee, H. M. 1984, ApJ, 285, 89
- Draine & Li (2001) Draine, B. T. & Li, A 2001, ApJ, 551, 807
- Dwek (1986) Dwek, E. 1986, ApJ, 302, 363
- Dullemond & van Bemmel (2005) Dullemond, C.P. & van Bemmel, I.M. 2005, astro-ph/0501570
- Duley (1973) Duley, W. W. 1973, Ap&SS, 23, 43
- Edelson & Malkan (1986) Edelson, R. A., & Malkan, M. A. 1986, ApJ, 308, 59
- Efstathiou & Rowan-Robinson (1995) Efstathiou, A., & Rowan-Robinson, M. 1995, MNRAS, 273, 649
- Elvis et al. (1994) Elvis, M., et al. 1994, ApJS, 95, 1
- Ferland (1996) Ferland, G. J. 1996, Hazy: A Brief Introduction to Cloudy (Lexington: Univ. Kentucky Dept. Phys. Astron.)
- Fischera & Dopita (2004) Fischera, J., & Dopita, M. A. 2004, ApJ, 611, 919
- Fischera & Dopita (2005) Fischera, J., & Dopita, M. 2005, ApJ, 619, 340
- Galliano et al. (2005) Galliano, E., Pantin, E., Alloin, D., & Lagage, P. O. 2005, MNRAS, 363, L1
- Gaskell et al. (2004) Gaskell, C. M., Goosmann, R. W., Antonucci, R. R. J., & Whysong, D. H. 2004, ApJ, 616, 147
- Genzel et al. (1998) Genzel, R., et al. 1998, ApJ, 498, 579
- Granato & Danese (1994) Granato, G. L., & Danese, L. 1994, MNRAS, 268, 235
- Granato et al. (1997) Granato, G. L., Danese, L., & Franceschini, A. 1997, ApJ, 486, 147
- Gratadour et al. (2006) Gratadour, D., Rouan, D., Mugnier, L. M., Fusco, T., Clénet, Y., Gendron, E., & Lacombe, F. 2006, A&A, 446, 813
- Greenberg & Hong (1974) Greenberg, J. M. & Hong, S.-S. 1974, IAU Symp. 60: Galactic Radio Astronomy, 60, 155
- Groves (2004) Groves, B. A. 2004, Dust in Photoionized Nebulae, Thesis
- Groves et al. (2004a) Groves, B. A., Dopita, M. A., & Sutherland, R. S. 2004, ApJS, 153, 9
- Groves et al. (2004b) Groves, B. A., Dopita, M. A., & Sutherland, R. S. 2004, ApJS, 153, 75
- Guhathakurta & Draine (1989) Guhathakurta, P. & Draine, B. T. 1989, ApJ, 345, 230
- Hao et al. (2005) Hao, L., et al. 2005, ApJ, 625, L75
- Imanishi (2003) Imanishi, M. 2003, ApJ, 599, 918
- Imanishi & Wada (2004) Imanishi, M., & Wada, K. 2004, ApJ, 617, 214
- Jenkins, Jura & Loewenstein (1987) Jenkins, E. B., Jura, M., & Loewenstein, M. 1987, ApJ, 270, 88
- Jones, Tielens & Hollenbach (1996) Jones,A. P., Tielens, A. G. G. M. & Hollenbach, D. J. 1996, ApJ, 469, 740
- Kriss et al. (1995) Kriss, G. A., Davidsen, A. F., Zheng, W., Kruk, J. W., & Espey, B. R. 1995, ApJ, 454, L7
- Krolik et al. (1981) Krolik, J. H., McKee, C. F., & Tarter, C. B. 1981, ApJ, 249, 422
- Laor & Draine (1993) Laor, A., & Draine, B. T. 1993, ApJ, 402, 441
- Li & Draine (2001) Li, A. & Draine, B. T. 2001, ApJ, 554, 778
- Lutz et al. (1998) Lutz, D., Spoon, H. W. W., Rigopoulou, D., Moorwood, A. F. M., & Genzel, R. 1998, ApJ, 505, L103
- Lutz et al. (2000) Lutz, D., Sturm, E., Genzel, R., Moorwood, A. F. M., Alexander, T., Netzer, H., & Sternberg, A. 2000, ApJ, 536, 697
- Lutz et al. (2003) Lutz, D., Sturm, E., Genzel, R., Spoon, H. W. W., Moorwood, A. F. M., Netzer, H., & Sternberg, A. 2003, A&A, 409, 867
- Maiolino et al. (2001a) Maiolino, R., Marconi, A., Salvati, M., Risaliti, G., Severgnini, P., Oliva, E., La Franca, F., & Vanzi, L. 2001, A&A, 365, 28
- Maiolino et al. (2001b) Maiolino, R., Marconi, A., & Oliva, E. 2001, A&A, 365, 37
- Mason et al. (2006) Mason, R. E. et al. 2006, ApJ, 640, 2 (astro-ph/0512202)
- Mathis, Rumpl, & Nordsieck (1977) Mathis, J. S., Rumpl, W., & Nordsieck, K. H. 1977, ApJ, 217, 425 (MRN)
- Nagao et al. (2001) Nagao, T., Murayama, T., & Taniguchi, Y. 2001, ApJ, 546, 744
- Nenkova et al. (2002) Nenkova, M., Ivezić, Ž., & Elitzur, M. 2002, ApJ, 570, L9
- Netzer & Laor (1993) Netzer, H., & Laor, A. 1993, ApJ, 404, L51
- Osterbrock (1989) Osterbrock, D. E., 1989, Astrophysics of Gaseous Nebulae and Active Galactic Nuclei, (University Science Books)
- Packham et al. (2005) Packham, C., Radomski, J. T., Roche, P. F., Aitken, D. K., Perlman, E., Alonso-Herrero, A., Colina, L., & Telesco, C. M. 2005, ApJ, 618, L17
- Pier & Krolik (1992) Pier, E. A., & Krolik, J. H. 1992, ApJ, 401, 99
- Pier & Krolik (1993) Pier, E. A., & Krolik, J. H. 1993, ApJ, 418, 673
- Purcell (1976) Purcell, E. M. 1976, ApJ, 206, 685
- Radomski et al. (2003) Radomski, J. T., Piña, R. K., Packham, C., Telesco, C. M., De Buizer, J. M., Fisher, R. S., & Robinson, A. 2003, ApJ, 587, 117
- Savage & Sembach (1996) Savage, B. D. & Sembach, K. R. 1996, ARA&A, 34, 279
- Scott et al. (2004) Scott, J. E., Kriss, G. A., Brotherton, M., Green, R. F., Hutchings, J., Shull, J. M., & Zheng, W. 2004, ApJ, 615, 135
- Shang et al. (2005) Shang, Z., et al. 2005, ApJ, 619, 41
- Siebenmorgen et al. (2004) Siebenmorgen, R., Freudling, W., Krügel, E., & Haas, M. 2004, A&A, 421, 129
- Sturm et al. (2002) Sturm, E., Lutz, D., Verma, A., Netzer, H., Sternberg, A., Moorwood, A. F. M., Oliva, E., & Genzel, R. 2002, A&A, 393, 821
- van Bemmel & Dullemond (2003) van Bemmel, I. M., & Dullemond, C. P. 2003, A&A, 404, 1
- Voit (1991) Voit, G. M. 1991, ApJ, 379, 122
- Voit (1992) Voit, G. M. 1992, MNRAS, 258, 841
- Weedman et al. (2005) Weedman, D. W., et al. 2005, ApJ, 633, 706
- Weingartner & Draine (2001) Weingartner, J. C. & Draine, B. T. 2001, ApJ, 548, 296