Spectral ageing analysis of the double-double radio galaxy J1453+3308
Abstract
We present new radio observations at frequencies ranging from 240 to 4860 MHz of the well-known, double-double radio galaxy (DDRG), J1453+3308, using both the Giant Metrewave Radio Telescope (GMRT) and the Very Large Array (VLA). These observations enable us to determine the spectra of the inner and outer lobes over a large frequency range and demonstrate that while the spectrum of the outer lobes exhibits significant curvature, that of the inner lobes appears practically straight. The break frequency, and hence the inferred synchrotron age of the outer structure, determined from 16arcsec strips transverse to the source axis, increases with distance from the heads of the lobes. The maximum spectral ages for the northern and southern lobes are 47 and 58 Myr respectively. Because of the difference in the lengths of the lobes these ages imply a mean separation velocity of the heads of the lobes from the emitting plasma of 0.036c for both the northern and southern lobes. The synchrotron age of the inner double is about 2 Myr which implies an advance velocity of 0.1c, but these values have large uncertainties because the spectrum is practically straight.
keywords:
galaxies: active – galaxies: nuclei – galaxies: individual: J1453+3308 – radio continuum: galaxies1 Introduction
For radio galaxies and quasars, an interesting way of probing their history is via the structural and spectral information of the lobes of extended radio emission. Such studies have provided useful insights in understanding sources which exhibit precession or changes in the ejection axis, effects of motion of the parent galaxy, backflows from hotspots as well as X-shaped sources and major interruptions of jet activity. A striking example of episodic jet activity is when a new pair of radio lobes is seen closer to the nucleus before the ‘old’ and more distant radio lobes have faded (e.g. Subrahmanyan, Saripalli & Hunstead 1996; Lara et al. 1999). Such sources have been christened as ‘double-double’ radio galaxies (DDRGs) by Schoenmakers et al. (2000a, hereinafter referred to as S2000a). They proposed a relatively general definition of a DDRG as a double-double radio galaxy consisting of a pair of double radio sources with a common centre. S2000a also suggested that the two lobes of the inner double should have an edge-brightened radio morphology to distinguish it from knots in a jet. In such sources the newly-formed jets may propagate outwards through the cocoon formed by the earlier cycle of activity rather than the general intergalactic or intracluster medium after traversing through the interstellar medium of the host galaxy. Approximately a dozen or so of such DDRGs are known in the literature (Saikia, Konar & Kulkarni 2006, and references therein).
Kaiser, Schoenmakers & Röttgering (2000, hereinafter referred to as K2000) presented an analytical model predicting how the new jets give rise to an inner source structure within the region of the old, outer cocoon. Assuming values of a number of free model parameters, e.g. the density of the external environment surrounding the old jets, the exponent of the density distribution as a function of the radial distance from the radio core, the initial energy distribution in the shock caused by the jet, they predicted a lower limit for the power of the old jets, and dynamical ages of the outer (older), , and inner (younger), , double structures of a few selected DDRGs. In particular, for the source J1453+3308 they found Myr and Myr.
In this paper we investigate the radiative ages of particles emitting in different parts of the old cocoon (outer structure) of J1453+3308, as well as in the inner lobes of this DDRG, and compare these with the above dynamical ages. The already available data indicate that the lobes of the outer double are separated by 336 arcsec corresponding to 1297 kpc, while the inner double has a separation of 41 arcsec corresponding to 159 kpc (H∘=71 km s-1 Mpc-1, =0.27, =0.73, Spergel et al. 2003). The 1.4-GHz radio luminosities of the outer and inner doubles are 7.941025 W Hz-1 and 5.881024 W Hz-1 respectively. The luminosity of the outer double is above the FRI/FRII break, while that of the inner double is below it although it has an edge-brightened structure.
To achieve the above objectives we made new radio maps of J1453+3308 at a number of frequencies over a large range from 240 to 4860 MHz. These observations have been made with an angular resolution high enough to image the lobes with at least 6 resolution elements along their axes. The new observations and data reduction are described in Section 2. The observational results, such as the radio maps showing the source structure, spectra and polarisation parameters are presented in Section 3. The standard spectral-ageing analysis for the outer and inner structures is described and the results presented in Section 4, while the concluding remarks are given in Section 5.
2 Observations and data reduction
The analysis presented in this paper is based on radio observations recently conducted with the GMRT and VLA, as well as on VLA archival data. The observing log for both the GMRT and VLA observations is listed in Table 1 which is arranged as follows. Columns 1 and 2 show the name of the telescope, and the array configuration for the VLA observations; columns 3 and 4 show the frequency and bandwidth used in making the images; column 5: the primary beamwidth in arcmin; column 6: dates of the observations. The phase centre for all the observations was near the core of the radio galaxy.
2.1 GMRT observations
The observations were made in the standard manner, with each observation of the target-source interspersed with observations of 3C286 which was used as a phase calibrator as well as flux density and bandpass calibrator. At each frequency the source was observed in a full-synthesis run of approximately 9 hours including calibration overheads. The rms noise in the resulting images range from about 1 mJy beam-1 at 240 MHz to about 0.06 mJy beam-1 at 1287 MHz. Details about the array can be found at the GMRT website at http://www.gmrt.ncra.tifr.res.in. The data collected were calibrated and reduced in the standard way using the NRAO AIPS software package. The flux densities at the different frequencies are based on the scale of Baars et al. (1977).
| Teles- | Array | Obs. | Band- | Primary | Obs. Date |
|---|---|---|---|---|---|
| cope | Conf. | Freq. | width | beam | |
| MHz | MHz | arcmin | |||
| GMRT | 240 | 4.5 | 114 | 2005 Mar 17 | |
| GMRT | 334 | 12.5 | 81 | 2004 Dec 25 | |
| GMRT | 605 | 12.5 | 43 | 2005 Mar 17 | |
| GMRT | 1287 | 12.5 | 26 | 2005 Dec 22 | |
| VLA∗ | A | 1365 | 25 | 30 | 2000 Oct 21 |
| VLA∗ | A | 4860 | 50 | 9 | 2000 Oct 22 |
| VLA∗ | B | 4860 | 50 | 9 | 2001 Apr 02 |
| VLA∗ | AB | 4860 | 100 | 9 | 1998 Jul 29 |
| VLA | CnD | 4860 | 50 | 9 | 2005 Oct 31 |
| VLA∗ | A | 8460 | 50 | 5.4 | 2000 Oct 22 |
| VLA∗ | B | 8460 | 50 | 5.4 | 2001 Apr 02 |
∗: VLA archival data.
2.2 New and archival VLA observations
The source was observed with the CnD array at a frequency of 4860 MHz to image the outer lobes and determine their spectra by comparing with the low-frequency GMRT images. The integration time was about min, which allowed us to reach an rms noise value of about 0.05 mJy beam-1. The interferometric phases were calibrated every 20 min with the phase calibrator J1416+347. The source 3C286 was used as the primary flux density and polarisation calibrator. For the image produced from this data set correction for the primary beam pattern has been done.
As in the case of the GMRT data, the VLA data were edited and reduced using the AIPS package. The polarisation data reduction was done and the maps of the Stokes parameters , and were obtained using the procedures applied in the analysis of polarisation properties in a larger set of giant radio galaxies (Machalski et al. 2006).
To study the inner double-lobed structure of J1453+3308, derive its spectrum and estimate the radiative age, as well as to compare the resulting age with that of the outer lobes of the giant-sized structure, we supplemented our GMRT observations with VLA archival data. These observations which were made in the snap-shot mode in the L (1365 MHz), C (4860 MHz) and X (8460 MHz) bands, also enabled us to study the spectrum and variability of the radio core. All flux densities are on the Baars et al. (1977) scale.
3 Observational results
3.1 Structure
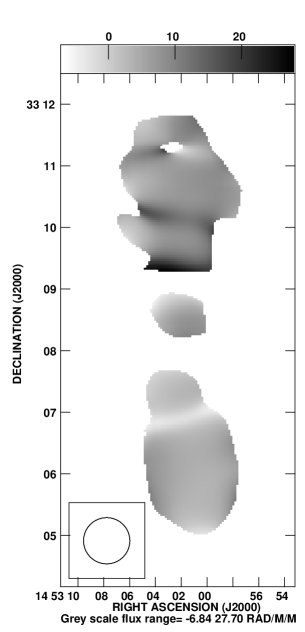
The images of the entire source using the GMRT and the VLA are presented in Figs. 1 and 2, while the observational parameters and some of the observed properties are presented in Table 2 which is arranged as follows. Column 1: frequency of observations in MHz, with the letter G or V representing either GMRT or VLA observations; columns 24: the major and minor axes of the restoring beam in arcsec and its position angle (PA) in degrees; column 5: the rms noise in mJy beam-1; column 6: the integrated flux density of the source in mJy estimated by specifying an area around the source; column 7, 10, 13 and 16: component designation where N1 and S1 indicate the northern and southern components of the outer double, N2 and S2 the northern and southern components of the inner double; columns 8 and 9, 11 and 12, 14 and 15, 17 and 18: the peak and total flux densities of the components in mJy beam-1 and mJy respectively. The flux densities have been estimated by specifying an area around each component. The error in the flux density is approximately 15 per cent at 240 MHz and 7 per cent at the higher frequencies.


All the images of the source show the well-known pair of doubles which are misaligned by 7.5∘. The total luminosity of the outer double is in the FRII category although it has no prominent hotspot. On the other hand, the total luminosity of the inner double is in the FRI class although it has an edge-brightened structure characteristic of FRII sources. Such sources could provide useful insights towards understanding the FRI-FRII dichotomy and it would be useful to enquire whether the observed properties of the inner double might be due to evolutionary effects such as the emissivity increasing with time or due to differences in the environment or the central engine.
The high-resolution GMRT L-band image shows the radio core in addition to the lobes of radio emission. The structure of the inner double is better seen in the VLA A-array image at 1365 MHz and the B-array image at 4860 MHz, made from the archival data (Fig. 4).
The ratio of the separations of the southern lobe from the core to that of the northern one is 1.34 and 1.06 for the outer and inner doubles, respectively. The outer double being more asymmetric is possibly due to asymmetries in the external environment on the scale of the outer double. The flux densities of the lobes are higher on the northern side, the ratio of the flux density of the southern component to that of the northern one for the outer and inner doubles are 0.570.06 and 0.440.05 respectively. This suggests an intrinsic asymmetry on scales ranging from the inner double to that of the outer one.
. Freq. Beam size rms SI Cp Sp St Cp Sp St Cp Sp St Cp Sp St MHz ′′ ′′ ∘ mJy mJy mJy mJy mJy mJy mJy mJy mJy mJy /b /b /b /b /b (1) (2) (3) (4) (5) (6) (7) (8) (9) (10) (11) (12) (13) (14) (15) (16) (17) (18 ) G240 12.8 9.4 35 1.07 1843 N1 53 1055 N2 92 123 S2 31 48 S1 22 602 G334 9.2 8.1 48 0.52 1599 N1 29 902 N2 66 96 S2 23 47 S1 14 563 G605 6.0 5.0 43 0.11 1078 N1 8.3 606 N2 42 69 S2 13 29 S1 4.2 370 G1287 3.8 3.1 47 0.06 504 N1 2.4 272 N2 13 37 S2 3.8 17 S1 1.2 164 V1400 45.0 45.0 0.45 460 N1 121 258 S1 46 145 V4860 15.2 10.0 17 0.05 136 N1 6.5 71 N2+S2 16 32 S1 3.6 32 V1365 1.5 1.3 9 0.02 N2 6.1 38 S2 2.3 14 V4860 1.3 1.2 44 0.02 N2 2.2 16 S2 0.8 4.9 V8460 0.7 0.7 9 0.01 N2 0.5 9.5 S2 0.2 2.6
| Freqency | Component | Error | Component | Error | Component | Error | Reference | |||
|---|---|---|---|---|---|---|---|---|---|---|
| MHz | mJy | mJy | mJy | mJy | mJy | mJy | ||||
| (1) | (2) | (3) | (4) | (5) | (6) | (7) | (8) | (9) | (10) | (11) |
| 74 | total | 2530 | 320 | VLSS | ||||||
| 151 | total | 2387 | 135 | outer | 2165 | 110 | 1 | |||
| 178 | total | 2220 | 220 | outer | 2020 | 200 | 2 | |||
| 240 | total | 1843 | 260 | inner | 176 | 25 | outer | 1667 | 250 | 3 |
| 325 | total | 1510 | 150 | outer | 1365 | 140 | 4 | |||
| 334 | total | 1599 | 113 | inner | 143 | 10 | outer | 1456 | 112 | 3 |
| 408 | total | 1330 | 125 | 5 | ||||||
| 605 | total | 1078 | 76 | inner | 108 | 8 | outer | 970 | 75 | 3 |
| 1287 | total | 504 | 36 | inner | 62 | 9 | outer | 442 | 34 | 3 |
| 1400 | total | 460 | 33 | outer | 426 | 26 | 4,6 | |||
| 4860 | total | 136 | 10 | inner | 32 | 3 | outer | 104 | 8 | 3 |
| 4800 | total | 121 | 18 | 4 | ||||||
| 10500 | total | 70 | 3 | inner | 20 | 4 | 4 |
References: VLSS: VLA Low-frequency Sky Survey; 1: Riley et al. 1999; 2: Pilkington & Scott (1965); 3: Present paper; 4: Schoenmakers et al. (2000b) 5: Colla et al. (1970); 6: Schoenmakers et al. (2000a).
3.2 Spectra
The integrated flux densities of the total source, as well as of the inner and outer doubles, are given in Table 3. All columns are self explanatory, with ‘outer’ and ‘inner’ denoting the outer lobes and the inner double. All the flux densities quoted here are consistent with the scale of Baars et al. (1977). The flux densities of the outer lobes at 151, 178 and 325 MHz (column 9) are derived subtracting flux densities expected for the inner lobes at these frequencies from the total flux densities given in column 3. The former ones are simply determined fitting the form log =a + b log + c exp(log) to the measured flux density values in column 6.
The integrated spectrum is presented in Fig. 3. Clearly there is a distinct steepening in the integrated spectrum at 300 MHz. Our low-frequency measurements show a significant flattening of the spectrum below 300 MHz, consistent with the VLA Low-frequency Sky Survey (VLSS; http://lwa.nrl.navy.mil/VLSS) flux density. Since the low-frequency flattening is unlikely to be due to either synchrotron self-absorption or thermal absorption, the change in curvature must be due to spectral ageing with the low-frequency spectrum probably representing the injection spectrum of the relativistic particles. Further analysis of this aspect is described in Section 5.


3.3 The radio core
The J2000.0 position of the radio core estimated from our high-resolution images is RA: 14 53 02.87 and DEC: 33 08 42.3, which is 2 arcsec away from the position of the optical galaxy (RA: 14 53 02.93 and DEC: 33 08 40.8) listed by Schoenmakers (1999). The radio core has a mildly inverted spectrum (Fig. 5) with only marginal evidence of variability at 4860 MHz but significant variability at 8460 MHz over a similar time scale.
| Telescope | Date of obs. | Freq. | Flux |
|---|---|---|---|
| density | |||
| MHz | mJy | ||
| GMRT | 2005 Mar 17 | 605 | 3.1 |
| VLA-A | 2000 Oct 21 | 1365 | 4.1 |
| VLA-B | 2001 Apr 02 | 4860 | 5.5 |
| VLA-A | 2000 Oct 22 | 4860 | 5.5 |
| VLA-AB | 1998 Jul 29 | 4860 | 4.6 |
| VLA-B | 2001 Apr 02 | 8460 | 6.2 |
| VLA-A | 2000 Oct 22 | 8460 | 3.6 |
The core flux density at 605 MHz is the peak value, due to contamination by the extended flux density, while for the others these are integrated values. The values have been estimated from two-dimensional Gaussian fits.

3.4 Polarisation properties
As in Machalski et al. (2006) the preliminary polarisation properties of J1453+3308 are derived using the NVSS data (Condon et al. 1998) and our VLA CnD-array 4860 MHz measurements. The E-vectors superimposed on the total-intensity as well as polarised-intensity images at 1400 and 4860 MHz are shown in Fig. 6. The lobes of the source show significant polarisation. The mean values of scalar polarisation at 4860 MHz for the northern and southern lobes of the outer double are 8 and 20 per cent respectively. These values are determined after clipping the images at 4 times the rms noise and convolving the image with the NVSS beam of 4545 arcsec2. The average value for the inner double is 5 per cent. The average scalar polarisation at 1400 MHz for the northern and southern lobes of the outer double are 9 and 16 per cent respectively, while the corresponding value for the inner double is 5 per cent. The northern component of the outer double shows no evidence of depolarisation while the southern lobe is depolarised by 20 per cent. The inner double shows no significant evidence of depolarisation.
The rotation measure (RM) image of the source, obtained from the 1400-MHz and 4860-MHz maps by considering only those points which are 4 times above the rms noise, yields RM values within 25 rad m-2 (Fig. 7). Most regions of the source have an RM of only a few rad m-2, the average value for the source being 6 rad m-2. Although from two-frequency measurements it is not possible to resolve any n ambiguities in the PA of the E-vectors, the low value of RM is consistent with known values for large radio sources (e.g. Saikia & Salter 1988 for a review). The Galactic longitude and latitude of the source are 53.3∘ and 63.1∘ respectively. Considering the high Galactic latitude of the source, its RM is similar to other known sources in this direction suggesting that intrinsic contribution to the RM is likely to be less than 20 rad m-2. However these results are preliminary; the RM distribution and the inferred magnetic field need to be determined from more detailed multi-frequency observations.
The inferred magnetic field vectors obtained at present by merely rotating the E-vectors at 4860 MHz by 90∘ shows that the field lines in the relaxed outer northern lobe are nearly circumferential in the outer periphery. The field lines are roughly along the axis of the lobes for both the outer and inner double, although the field lines tend to be orthogonal to the axis of the source in regions of the outer double which are closest to the core or inner double. The field directions for the northern and southern components of the inner double are 30 and 10∘ respectively. Some of the features appear somewhat unusual compared with the field distributions in other radio galaxies (cf. Saripalli et al. 1996; Mack et al. 1997; Lara et al. 2000; Schoenmakers et al. 2000b).


4 Spectral ageing analysis
In order to determine the spectral age in different parts of the lobes, i.e. the time which elapsed since the radiating particles were last accelerated, we apply the standard theory describing the time-evolution of the emission spectrum from particles with an initial power-law energy distribution and distributed isotropically in pitch angle relative to the magnetic field direction. The initial energy distribution corresponds to the initial (injection) spectral index . The spectral break frequency above which the radio spectrum steepens from the injected power law, , is related to the spectral age and the magnetic field strength through
where =0.318(1+)2 is the magnetic field strength equivalent to the inverse-Compton microwave background radiation; and are expressed in units of nT, while is in GHz.
4.1 Determination of and values
In order to determine a value of , we first fitted the CI (continuous injection; Pacholczyk 1970) and JP (Jaffe & Perola 1973) models of radiative losses to the flux densities of the outer lobes, and found that the uncertainties of the fitted values are large. Also there is no evidence for significantly different values of this parameter in the opposite lobes. The typical sizes of hotspots are 10 kpc (e.g. Jeyakumar & Saikia 2000 and references therein) which at the redshift of 0.249 for this source corresponds to an angular size of 3 arcsec. This is similar to our GMRT full-resolution image at 1287 MHz which shows no significant hotspots in either of the outer lobes. We have therefore preferred to use the JP rather than the CI model for the outer lobes. Also the JP model gives an overall better fit to the spectra of the different strips discussed below. The fit of the model to the flux densities of both the outer lobes together (column 9 in Table 3) is shown in Fig. 8a. This fit is used to estimate the value of for the ageing analysis of the outer structure of the source. The corresponding fit, but with the CI model applied to the flux densities of the inner double, is shown in Fig. 8b. It is worth noting that both the fitted values of are similar .
Next, the total-intensity maps at the frequencies of 240, 334, 605, 1287 and 4860 MHz were convolved to a common angular resolution of 15.2 arcsec. Each lobe was then split into a number of strips, separated approximately by the resolution element along the axis of the source, and the spectrum of each strip determined from 235 to 4860 MHz. Using the SYNAGE software (Murgia 1996) we searched for the best fit applying the JP model to the spectra in the six strips covering the outer, northern lobe and the other eight covering the outer, southern lobe. Although the resulting values of for different strips show significant variations, the best fits with the same injection spectrum are achieved for =0.568. The results for a few typical strips are shown in Fig. 9. In cases where the flux density of a particular strip at 235 MHz appeared discrepant from the overall fit, we attempted to determine the values of with and without the discrepant point and found no significant difference. The values of including the 1 errors for the northern and southern lobes are listed in Table 5.
4.2 Magnetic field determination and radiative ages
To determine the age of the particles in particular strips we have to estimate the magnetic field strength in the corresponding strips. The values of the equipartition energy density and the corresponding magnetic field, Beq, are calculated using the revised formula given by Beck & Krause (2005). This formula (their equation (A18)) accounts for a ratio K0 between the number densities of protons and electrons in the energy range where radiation losses are small. Assuming K0=70 implied by their equation (7) for =0.568, we obtain the revised magnetic field strength, , which depends on the low-frequency spectral index in the observed synchrotron spectrum. The revised field, calculated assuming a filling factor of unity, =0.568, the flux densities at 334 MHz and a rectangular box for each strip are listed in Table 5 which is arranged as follows. Column 1: identification of the strip; column 2: the projected distance of the strip-centre from the radio core; column 3: the break frequency in GHz; column 4: the reduced value of the fit; column 5: the revised magnetic field in nT; column 6: the resulting synchrotron age of the particles in the given strip. These latter values as a function of distance are plotted in Fig. 10. We have repeated the calculations using the classical equipartition magnetic field (e.g. Miley 1980) and have also plotted the variation of age with distance using these fields. Within the uncertainties there is no significant difference between the age estimates using the revised and classical equipartition magnetic fields.
As expected the synchrotron age for both the outer lobes increases with distance from the edges of the lobes. The maximum ages for the northern and southern lobes are 47 and 58 Myr respectively. The northern lobe has a higher surface brightness along most of its length, is closer to the nucleus and hence its younger spectral age may be due to a combination of reacceleration of particles and better confinement. A weighted least-squares fit to the ages yields a mean separation velocity of the head from the radio-emitting plasma of 0.036c for both the northern and southern lobes. However, these separation velocities are referred to a region of the last acceleration of emitting particles (shock at the end of the lobe) which advances from the origin of the jets, i.e. the radio core, with an advance speed, . If the backflow has a speed of , and , then an average expansion speed is 0.018c. This would imply an age of the outer structure of 96 and 134 Myr for the northern and southern lobes respectively, significantly smaller than the estimate of 215 Myr given by K2000.
It is worth noting that our derived age estimate for the inner double structure is similar to that of K2000. Indeed, the fit with the CI model (cf. Fig. 8b) gives and GHz (the error is enormous due to the practically straight spectrum). Our calculation of the magnetic field in the inner lobes gives nT which implies its spectral age to be 2 Myr and an apparent advance velocity of 0.1c for the lobe heads. However these values have large uncertainties because the spectrum is practically straight.


| Strip | Dist. | ||||
|---|---|---|---|---|---|
| kpc | GHz | nT | Myr | ||
| S-lobe | |||||
| s1 | 735 | 4.45 | 0.350.07 | ||
| s2 | 673 | 2.06 | 0.360.07 | ||
| s3 | 611 | 1.27 | 0.350.07 | ||
| s4 | 549 | 0.59 | 0.350.07 | ||
| s5 | 487 | 0.33 | 0.360.07 | ||
| s6 | 425 | 2.53 | 0.380.07 | ||
| s7 | 363 | 3.18 | 0.370.07 | ||
| s8 | 301 | 3.15 | 0.310.06 | ||
| N-lobe | |||||
| s9 | 244 | 17.9 | 0.320.06 | ||
| s10 | 286 | 3.69 | 0.370.07 | ||
| s11 | 348 | 2.79 | 0.400.08 | ||
| s12 | 410 | 2.04 | 0.410.08 | ||
| s13 | 472 | 0.46 | 0.420.08 | ||
| s14 | 534 | 0.47 | 0.440.08 |
Nevertheless, while interpreting these numbers caveats related to the evolution of the local magnetic field in the lobes need to be borne in mind (e.g. Rudnick, Katz-Stone & Anderson 1994; Jones, Ryu & Engel 1999; Blundell & Rawlings 2000). While K2000 have suggested that spectral and dynamical ages are comparable if bulk backflow and both radiative and adiabatic losses are taken into account in a self-consistent manner, Blundell & Rawlings (2000) suggest that this may be so only in the young sources with ages much less than 10 Myr. In the study of the FRII type giant radio galaxy, J1343+3758, Jamrozy et al. (2005) find the dynamical age to be approximately 4 times the maximum synchrotron age of the emitting particles.

5 Concluding remarks
We present the results of multifrequency radio observations of the double-double radio galaxy (DDRG), J1453+3308, using both the GMRT and the VLA.
-
1.
The images show more details of the well-known pair of doubles which are misaligned by 7.5∘. The symmetry parameters of the outer- and inner-double lobes suggest intrinsic asymmetries over these length scales. The luminosity of the outer double is in the FRII category although it has no prominent hotspot, while the luminosity of the inner double is below the dividing line although it has an edge-brightened structure characteristic of FRII sources.
-
2.
The radio core has a mildly inverted spectrum, with some evidence of variability. The weak, compact source close to the southern lobe of the outer double is unrelated.
-
3.
The magnetic field lines exhibit significant structure, with the lines being orthogonal to the source axis in the outer lobes closest to the radio core. The rotation measure is only a few rad m-2 over most of the source, with the maximum value being 25 rad m-2. These results are tentative since they are based on observations at only two frequencies and require confirmation from multi-frequency observations.
-
4.
The integrated spectrum is curved with evidence of significant flattening below 300 MHz. Using our images from 235 to 4860 MHz smoothed to a similar resolution of 15 arcsec, we fit the observed spectra of the outer and inner double structures with the models of radiative losses, and we determine the characteristic frequency breaks in fourteen strips cut through the outer lobes and transverse to the source axis. The best fits for the outer lobes are obtained with the JP model and the injection spectrum =0.568, while the best fit to the spectrum of the inner double is obtained with the CI model and =0.566. The injection spectra for both the outer and inner doubles are similar within the uncertainties.
-
5.
The synchrotron age of emitting particles in both the lobes of the outer double increases with distance from the edges of the lobes. The maximum ages for the northern and southern lobes are 47 Myr and 58 Myr respectively. The dependences of the radiative age vs. distance from the core imply a mean separation velocity of the lobe’s head from the radio-emitting plasma of 0.036c for both the northern and southern lobes. However, assuming presence of a backflow with its backward speed comparable to the advance speed of the (jet) head, an average advance speed would be about 0.018c which yields a maximum age of 134 Myr which is significantly smaller than the value suggested by K2000.
-
6.
The spectral age of 2 Myr obtained for the inner double is similar to that estimated by K2000. The value of 2 Myr implies an apparent advance velocity of 0.1c for the lobe heads of the inner structure. However these values have large uncertainties because the spectrum is practically straight.
Acknowledgments
We thank an anonymous referee for his helpful and detailed comments on the manuscript, Bill Cotton and Ger de Bruyn for clarifying the VLSS and WENSS flux density scales, our colleagues for their comments and the staffs of GMRT and VLA for their help with the observations. The Giant Metrewave Radio Telescope is a national facility operated by the National Centre for Radio Astrophysics of the Tata Institute of Fundamental Research. The National Radio Astronomy Observatory is a facility of the National Science Foundation operated under co-operative agreement by Associated Universities Inc. This research has made use of the NASA/IPAC extragalactic database (NED) which is operated by the Jet Propulsion Laboratory, Caltech, under contract with the National Aeronautics and Space Administration. MJ acknowledges the access to the SYNAGE software kindly provided by Dr K.-H. Mack and Dr M. Murgia (Istituto di Radioastronomia, Bologna, Italy). CK and DJS also thank Dr M. Murgia for access to the software and useful discussions. JM and MJ were partly supported by the Polish State funds for scientific research in years 2005–2007 under contract No. 0425/PO3/2005/29.
References
- [] Baars J.W.M., Genzel R., Pauliny-Toth I.I.K., Witzel A. 1977, A&A, 61, 99
- [] Beck R., Krause M., 2005, Astron. Nach., 326, 414
- [] Blundell K.M., Rawlings S., 2000, AJ, 119, 1111
- [] Colla G., et al., 1970, A&AS, 1, 281
- [] Condon J.J., Cotton W.D., Greisen E.W., Yin Q.F., Perley R.A., Taylor G.B., Broderick J.J., 1998, AJ, 115, 1693
- [] Jaffe W.J., Perola G.C., 1973, A&A, 26, 423
- [] Jamrozy M., Machalski J., Mack K.-H., Klein U., 2005, A&A, 433, 467
- [] Jeyakumar S., Saikia D.J., 2000, MNRAS, 311, 397
- [] Jones T.W., Ryu D., Engel A., 1999, ApJ, 512, 105
- [] Kaiser C.R., Schoenmakers A.P., Röttgering H.J.A., 2000, MNRAS, 315, 381 (K2000)
- [] Lara L., Márquez I., Cotton W.D., Feretti L., Giovannini G., Marcaide J.M., Venturi T., 1999, A&A, 348, 699
- [] Lara L., Mack K.-H., Lacy M., Klein U., Cotton W.D., Feretti L., Giovannini G., Murgia M., 2000, A&A, 356, 63
- [] Machalski J., Jamrozy M., Zola S., Koziel D., 2006, A&A, 454, 85
- [] Mack K.-H., Klein U., O’Dea C.P., Willis A.G., 1997, A&AS, 123, 423
- [] Miley G.K., 1980, ARA&A, 18, 165
- [] Murgia M., 1996, Laurea Thesis, University of Bologna
- [] Pacholczyk A.G., 1970, Radio Astrophysics, W.H. Freeman, San Francisco
- [] Pilkington J.D.H., Scott P.F., 1965, MemRAS, 69, 183
- [] Riley J.M.W., Waldram E.M., Riley J.M., 1999, MNRAS, 306, 31
- [] Rudnick L., Katz-Stone D.M., Anderson M.C., 1994, ApJS, 90, 955
- [] Saikia D.J., Salter C.J., 1988, ARA&A, 26, 93
- [] Saikia D.J., Konar C., Kulkarni V.K., 2006, MNRAS, 366, 1391
- [] Saripalli L., Mack K.-H., Klein U., Strom R., Singal A.K., 1996, A&A, 306, 708
- [] Schoenmakers A.P., 1999, PhD thesis, Universiteit Utrecht
- [] Schoenmakers A.P., de Bruyn A.G., Röttgering H.J.A., van der Laan H., Kaiser C.R., 2000a, MNRAS, 315, 371 (S2000a)
- [] Schoenmakers A.P., Mack K.-H., de Bruyn A.G., Röttgering H.J.A., Klein U., van der Laan H., 2000b, A&AS, 146, 293
- [] Subrahmanyan R., Saripalli L., Hunstead R.W., 1996, MNRAS, 279, 257
- [] Spergel D.N. et al., 2003, ApJS, 148, 175