Cyclotron resonance energies at a low X-ray luminosity:
A0535+262 observed with Suzaku
Abstract
The binary X-ray pulsar A0535+262 was observed with the Suzaku X-ray observatory, on 2005 September 14 for a net exposure of 22 ksec. The source was in a declining phase of a minor outburst, exhibiting 3–50 keV luminosity of ergs s-1 at an assumed distance of 2 kpc. In spite of the very low source intensity (about 30 mCrab at 20 keV), its electron cyclotron resonance was detected clearly with the Suzaku Hard X-ray Detector, in absorption at about 45 keV. The resonance energy is found to be essentially the same as those measured when the source is almost two orders of magnitude more luminous. These results are compared with the luminosity-dependent changes in the cyclotron resonance energy, observed from 4U 0115+63 and X0331+53.
1 Introduction
Binary pulsars are considered to have strong surface magnetic fields in the range of Gauss. Their field strengths can be directly measured through energies of cyclotron resonance scattering features (CRSFs), which often appear in their X-ray spectra (e.g Mihara 1995; Makishima et al. 1999). Neglecting the gravitational redshift, the magnetic field strength is then calculated from the resonance energy through a relation of .
Since the magnetic field must be intrinsic to a pulsar, the CRSF energy was believed to be constant in each object. However, a 35 % change in the cyclotron energy was unexpectedly observed with Ginga from the recurrent transient pulsar 4U 0115+63, between its 1990 and 1991 outbursts (Mihara 1995; Mihara et al. 1998, 2004). The change is considered to reflect luminosity-dependent variations in the accretion-column height by several hundred meters, assuming a dipolar field configuration (Mihara et al. 2004). The effect was studied in further detail by Nakajima et al. (2006), using the RXTE data of 4U 0115+63 which continuously covered another outburst in 1999. At that time, the CRSF energy was confirmed to increase from 11 keV to 16 keV, as the 3–50 keV source luminosity (at an assumed distance of 7 kpc; Negueruela & Okazaki 2001) decreased across a relatively narrow range of ergs s-1.
From another source, X0331+53 (V0332+53), a similar effect was detected with INTEGRAL (Mowlavi et al. 2006) and RXTE (Nakajima 2006b). The change in the CRSF energy, however, started in this case at a higher luminosity of ergs s-1, assuming this object to have a distance of 7 kpc as well (Negueruela et al. 1999). Thus, the luminosity-dependent change in the CRSF energy is emerging as a new intriguing issue, of which a unified view is yet to be constructed.
This Letter deals with A0535+262, yet another recurrent transient with a 103 sec pulsation period and a 111 day orbital period, located at a distance of 2.0 kpc (Steele et al. 1998). Its CRSFs were discovered at 50 and 100 keV by the TTM and HEXE instruments onborad Mir-KVANT in a 1989 outburst (Kendziorra et al. 1994), and the 2nd harmonic was later reconfirmed at 110 keV with the CGRO OSSE (Grove et al. 1995). Since this pulsar has the highest measured CRSF energy, it is of particular interest to compare this object with 4U 0115+53, which has the lowest known CRSF energy. However, the previous CRSF measurements from A0535+262 were all limited to very luminous states. Here, we report on a successful detection of the CRSF from this source by Suzaku, made for the first time at a very low luminosity of ergs s-1 (Inoue et al. 2005).
2 Observations and Data Reduction
According to RXTE ASM monitoring, A0535+262 entered outburst twice in 2005. On the first occasion, the 2–10 keV intensity reached a peak of 1.3 Crab ( ergs s-1 in luminosity) on June 6. The second outburst, an order of magnitude smaller, took place about one binary orbital period later, reaching the peak on September 1. On 2005 August 28 when the 2–100 keV luminosity was ergs s-1, the CRSF was detected at keV with the RXTE (Wilson & Finger 2005). The same feature was confirmed with the INTEGRAL SPI at keV on August 31 (Kretschmar et al. 2005). These measurements refer to Gaussian modeling of the observed absorption features.
The fifth Japanese X-ray satellite, Suzaku, was launched on 2005 July 10. It carries onboard the X-ray Imaging Spectrometer (XIS) operating in 0.2–12 keV (Matsumoto et al. 2005), and the Hard X-ray Detector (HXD; Kawaharada et al. 2004) which covers 10–70 keV with PIN diodes and 40–600 keV with GSO scintillators.
We observed A0535+262 with Suzaku from 13:40 UT on 2005 September 14 to 01:00 UT the next day, when the source was in the declining phase of the second outburst. The observation was carried out at “XIS nominal” pointing position, for a net exposure of 22.3 ksec with the XIS and 21.7 ksec with the HXD. The XIS was operated in the normal mode with “1/8 window” option, which gives a time resolution of 1 sec, whereas the HXD was in the nominal mode.
The source was detected with the XIS at an intensity of 10 cts s-1 per sensor. In the XIS analysis, we excluded all the telemetry saturated data portions, and data taken in “low” rate mode. We further removed those time intervals when the source elevation above the earth’s limb was below or the spacecraft was in the South Atlantic Anomaly (SAA). We then accumulated nominal-grade events within 6 mm () of the image centroid. The XIS background spectra were taken from a blank sky observation towards the North Ecliptic Pole region, conducted for 95 ksec on 2005 September 2–4.
The HXD data were screened using the same criteria as for the XIS. In addition, we discarded data taken up to 436 s after leaving the SAA, and those acquired during time intervals where the geomagnetic cutoff rigidity was lower than 8 GeV/c. After this filtering, the final HXD event list was obtained only using events that survived the standard anti-concidence function of the HXD.
The non X-ray background of the PIN diodes was synthesized by appropriately combining night-earth data sets acquired under different conditions (Kokubun et al. 2006). The GSO background was derived from a source-free observation performed on 2005 September 13, namely, immediately before the pointing onto A0535+26. The background GSO events were accumulated over identical orbital phases of Suzaku as the on-source data integration, resulting in an exposure of 19 ksec. Though rather short, this particular dataset is considered best in minimizing systematic errors associated with the GSO background estimation. After subtracting these backgrounds, the source was detected significantly at an intensity of 1.4 cts s-1 (10–70 keV) with PIN, and 0.4 cts s-1 (40–200 keV) with GSO.
3 Results
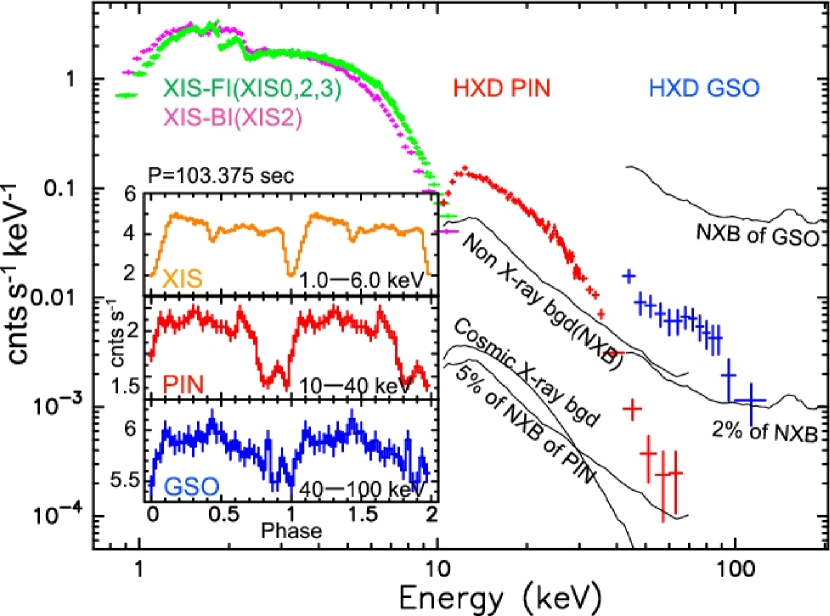
Figure 1 shows the background-subtracted XIS and HXD spectra of A0535+262, averaged over the whole observation. The 0.5 – 100 keV X-ray flux is measured as ergs s-1 cm-2, yielding an X-ray luminosity of ergs s-1 in the same band. In Figure 1, we also show typical PIN and GSO non X-ray backgrounds, and uncertainties in their reproducibility which are for PIN and for GSO; both these estimates are specific to the present observing conditions, and are based on the current level of instrumental calibration. Thus, the statistical errors are dominant in the PIN spectrum, whereas the statistical and systematic errors are comparable in the GSO data particularly above 100 keV. The contribution of the cosmic X-ray background is only of the signal, and hence negligible, but it was subtracted in deriving the PIN spectrum in Figure 1.
The source pulsations were detected at a barycentric period of 103.375 0.09 sec, over the full XIS band and at least up to 100 keV with the HXD. As shown in Figure 1 inset, the pulse profiles are similar to those previously obtained with Ginga when the source was 80 times brighter (Mihara 1995), although the dip around phase 0.45, probably caused by absorption, is shallower.
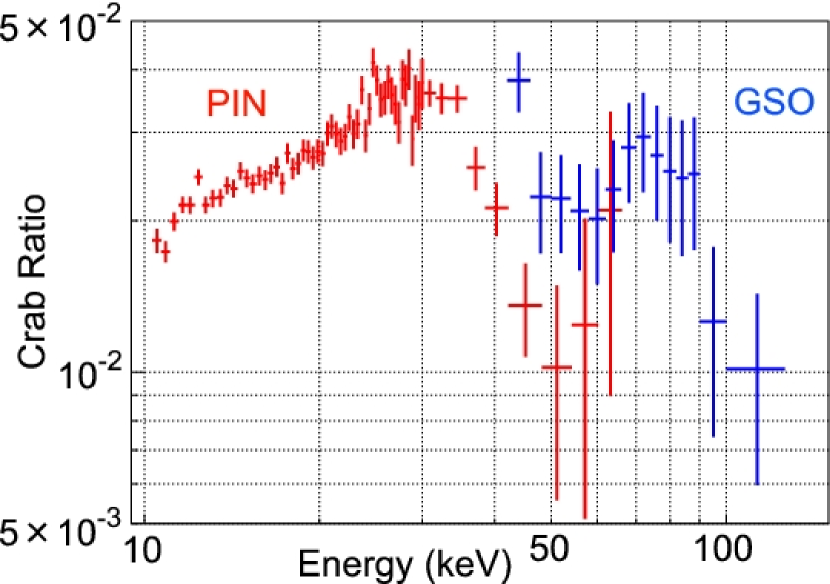
In order to evaluate the HXD spectra in a model-independent manner, we normalized them to those of the Crab Nebula, acquired in the same detector conditions on 2005 September 15, immediately after the A0535+262 observation. The resulting “Crab ratios”, presented in Figure 2, indicate that the source intensity is mCrab at 20 keV. The ratio keeps rising up to keV, and falls steeply beyond, where the PIN and GSO data both reveal a clear dip feature centered at keV. Since the Crab spectrum is a featureless power-law with a photon index of , we may identify this feature with the CRSF of A0535+262 observed previously (§ 1). Although the Crab ratios appear somewhat discrepant between the two HXD components, the effect can be partially explained by different energy resolutions between PIN ( 3 keV FWHM) and GSO ( keV FWHM at keV), coupled with the steeply declining spectra. The remainder is within the statistical plus systematic uncertainties.
To quantify the inference from Figure 2, we jointly fitted the PIN and GSO spectra, with the smooth continuum model called NPEX (Negative and Positive power-laws with EXponential; Mihara 1995; Makishima et al. 1999). We left free all but one parameters describing the model; two normalizations, the negative power-law index (), and the exponential cutoff parameter (). The positive power-law index, , was fixed at 2.0, representing a Wien peak, because it was not well constrained by the fit. The interstellar absorption was not incorporated, and the relative PIN vs. GSO normalization was fixed to 1.0 (nominal value). We limited the GSO fitting range to 50–100 keV, because of response uncertainties below 50 keV and the systematic background errors above 100 keV (Fig. 1).
As presented in Figure 3b, the NPEX model was successful with () when fitted to the 12–25 keV PIN data and the 73–100 keV GSO data (i.e., excluding the suggested CRSF energy range). When the 50–73 keV GSO data are restored, a worse fit () was obtained as shown in Figure 3c. Similarly, inclusion of the 25–70 keV PIN data (but discarding the 50–73 keV GSO data) resulted in a poor fit, with for (Figure 3d). The fit became completely unacceptable ( with ; Figure 3e) when the entire 12–70 keV PIN data and the 50–100 keV GSO spectra are utilized. Thus, the PIN and GSO data consistently indicate the spectral feature between and keV. This conclusion does not change even considering the systematic background uncertainties (Figure 1).
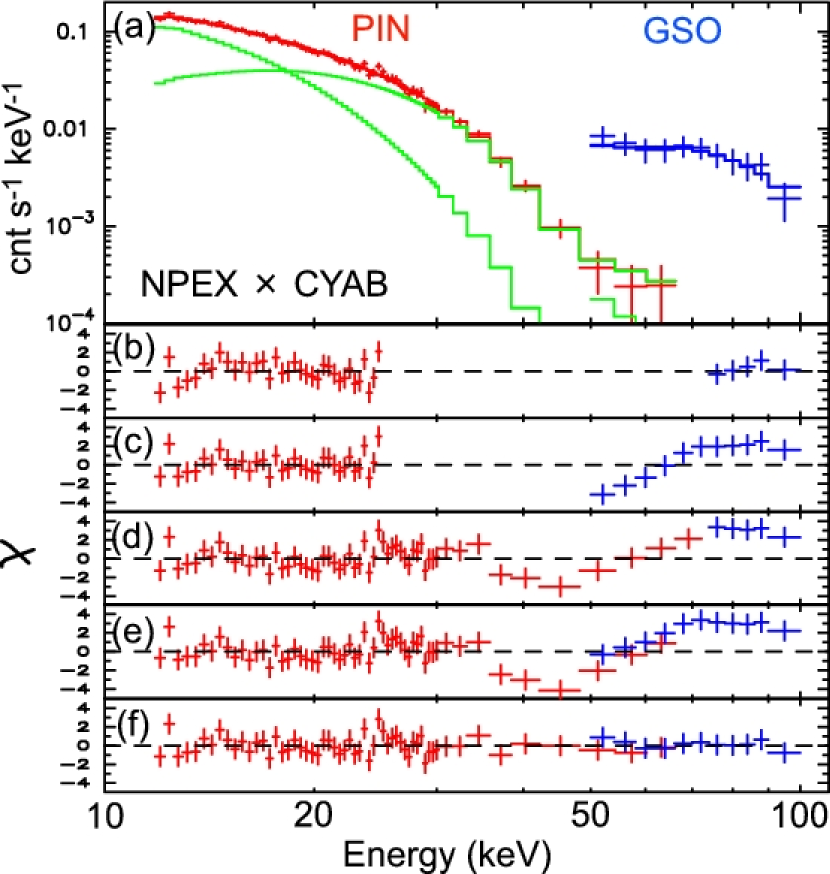
To better describe the HXD spectra, we multiplied the NPEX continuum with a cyclotron absorption (CYAB) factor (Mihara et al. 1990; Makishima et al. 1999), and repeated the joint fitting. We left free the energy , depth , and width of the resonance. As presented in Figures 3a and f, this NPEXCYAB model is successful in reproducing the PIN (12–70 keV) and the GSO (50–100 keV) spectra simultaneously, with for . The CYAB parameters were constrained as keV, , and keV, where the first “” represent statistical 90% errors while the second ones show the effect of systematic background uncertainties. Compared with these, systematic errors in the energy scale determination have smaller effects; the PIN energy scale, reconfirmed by Gd-K lines at 43 keV, is accurate to within 1 keV, and that of GSO, calibrated by several instrumental lines, is reliable to within a few keV. In addition, the systematics in the response matrix are also within statistical errors in the present analysis. The NPEX parameters became , and keV, with the positive and negative power-law components crossing over at keV (green curves in Fig. 3). This successful NPEX CYAB fit reinforces our identification of the feature with the previously known CRSF.
If we instead adopt a “power-law times exponential” continuum with Gaussian absorption (GABS; Kreykenbohm et al. 2004), the HXD data give keV, a Gaussian sigma of keV, and an optical depth of . However, the fit becomes worse; for .
Our data are consistent with the presence of the 2nd harmonic feature at at keV (see Fig 1), but do not require it, given the current status of the HXD calibration. If the model is multiplied by another CYAB factor with the center energy and width fixed at and , respectively, its depth is constrained as .
4 Discussion
We observed A0535+262 with Suzaku in a very low luminosity state, ergs s-1 in 0.5–100 keV, or ergs s-1 in 3–50 keV. In spite of the source faintness (30 mCrab), we successfully detected the CRSF at keV, thanks to the wide energy band and high sensitivity of the HXD. The CRSF was as deep as (or even deeper than) that in the high luminosity states; e.g., when the source was two orders of magnitude more luminous (Kendziorra et al. 1994; Grove et al. 1995).
Except for the case of X Persei (Coburn et al. 2001), which exhibits a rather unusual spectrum for an accreting pulsar, the present result provides the detection of a CRSF in the lowest luminosity state ever achieved from a binary X-ray pulsar. Since the CRSF appeared in absorption and not in emission, the Thomson optical depth of the accretion column is inferred to be larger than 10 even with this low luminosity, according to the Nagel model (1981). This conclusion is independently supported by the fact that the pulse profiles (Figure 1) do not differ significantly from those observed in much more luminous outbursts.
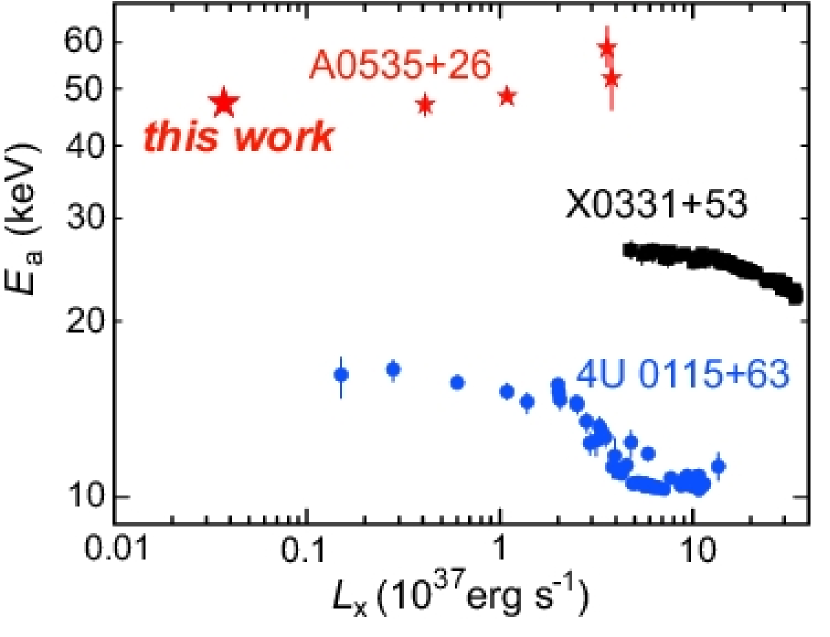
In Figure 4, we plot the CRSF energy of A0535+262 versus the 3–50 keV luminosity at 2 kpc, , as measured by Suzaku and by previous missions. For consistency with previous works, the Suzaku result plotted here is from the GABS modeling. The cyclotron resonance energy of A0535+262 is thus constant within , even though the luminosity changed by nearly two orders of magnitude from to ergs s-1. Therefore, the implied magnetic field strength, Gauss, is considered to represent a value intrinsic to this object, which is most likely that on the neutron star surface.
Figure 4 also presents results on the other two pulsars, 4U 0115+63 and X0331+53, mentioned in § 1. The three objects behave in rather different ways on the vs. plane. While 4U 0115+63 and X0331+53 both exhibit luminosity-dependent changes in , the threshold luminosity at which the resonance energy starts changing is significantly different. In addition, A0535+262 does not show such behavior at least up to erg s-1.
Considering that accreting X-ray pulsars should form a family described by a rather small number of parameters, one possibility suggested by Figure 4 is that the vs. relation depends systematically on some of the parameters, e.g., the surface field strength itself. Comparing 4U 0115+63 and X0331+53, we may speculate that starts changing at a higher luminosity if the object has a higher surface magnetic field. If this is correct, we would expect the resonance energy of A0535+262 to change at luminosities much higher than so far sampled, because it has the highest magnetic field among known CRSF pulsars.
Alternatively, the values of in Figure 4 may be subject to systematic errors, due, e.g., to uncertainties in the source distance, and/or to the anisotropy of emission that is inherent to X-ray pulsars. (The luminosities are all calculated assuming isotropic emission.) If the luminosity is corrected for these factors, the behavior of in Figure 4 might become essentially the same among the three objects.
To distinguish between these two possibilities (or to arrive at yet another alternative), we need further observations. In either case, it must be examined whether the variable column-height scenario, which was successful on 4U 0115+63 (Mihara et al. 1998, 2004; Nakajima et al. 2006), can be applied also to A0535+262 and X0331+53.
References
- Arnaud (1996) Arnaud, K.A., 1996, in Astron. Data Analysis Soft. and System V. ASP Conf. Ser., 101, 17
- Boldt et al. (1987) Boldt, E 1987 IAUS..124..611B
- Coburn et al. (2001) Coburn, W, Heindl, W.A, Gruber, D.E. et al. 2001 ApJ, 552, 738
- Grove et al. (1995) Grove, J.E., Strickman, M.S., Johnson, et al. 1995, ApJ, 438, L25
- Inoue et al. (2005) Inoue, H., Kunieda, H., White, N., et al. 2005, Astron. Telegram #613
- Kawaharada et al. (2004) Kawaharada, M., Hong, S. et al. 2004, SPIE, 5501, 286
- Kendziorra et al. (1994) Kendziorra, E., Kretschmar, P. et al. 1994, A&A, 291, L31
- Kokubun et al. (2006) Kokubun, M. et al. 2006, PASJ in preparation
- Kretschmar et al. (2005) Kretschmar, P., Kreykenbohm, I. et al. 2005, Astron. Telegram #601
- Kreykenbohm et al. (2004) Kreykenbohm, I., Wilms, J., Coburn, W., et al. 2004, A&A, 427 975
- Makishima et al. (1999) Makishima, K., Mihara, T., Nagase, F. & Tanaka, Y. 1999, ApJ, 525, 97
- Matsumoto et al. (2005) Matsumoto, H., Koyama, K., Tsuru, T.G. et al. 2005, NIM A, 541, 357
- Mihara et al. (1990) Mihara, T., Makishima, K., Ohashi, T., Sakao, T. & Tashiro, M. 1990, Nature 346, 250
- Mihara (1995) Mihara, T., Ph.D. thesis in Univ. of Tokyo 1995
- Mihara et al. (1998) Mihara, T., Makishima, K., & Nagase, F. 1998, Adv. Space Res. 22, 987
- Mihara et al. (2004) Mihara, T., Makishima, K., & Nagase, F. 2004, ApJ, 610, 390
- Mowlavi et al. (2006) Mowlavi, N., Kreykenbohm, I., Shaw, et al. 2006, A&A, in print.
- Nagel (1981) Nagel, W., 1981, ApJ, 251, 288
- Nakajima et al. (2006) Nakajima, M., Mihara, T., Makishima, K., & H. Niko, 2006, ApJ 646, 1125
- Nakajima (2006b) Nakajima, M., Ph.D. thesis in Nihon Univ. 2006b
- Negueruela & Okazaki (2001) Negueruela, I., & Okazaki, A. T., 2001, A&A, 369, 108
- Negueruela et al. (1999) Negueruela, I., Roche, P., Fabregat, J., & Coe, M. J. 1999, MNRAS, 307, 695
- Steele et al. (1998) Steele, I. A., Negueruela, I., Coe, M.J., & Roche, P. 1998, MNRAS, 297, L5
- Wilson & Finger (2005) Wilson, C. A., & Finger, M.H. 2005, Astron. Telegram #605