Supernova Remnants in the Magellanic Clouds. VII. Infrared Emission from SNRs
Abstract
We have used the instruments on the Spitzer Space Telescope to study the Large Magellanic Cloud supernova remnants (SNRs) N11L, N44, N49, N206, N63A, and N157B. The two large SNRs N44 and N206 were not detected in any IRAC or MIPS wavebands; the remainder were detected at one or more wavelengths. In particular, the SNRs N49 and N63A each had features that were evident in all available IRAC and MIPS bands. Each of these two also displayed faint limb emission in the MIPS 24 µm band only. IRS spectra obtained for the N49 SNR showed a number of prominent lines, with little continuum contribution. We therefore suggest that N49, and possibly N63A, are dominated by line emission, with thermal emission from hot dust being at most a secondary component.
Subject headings:
ISM: supernova remnants – ISM: individual (N11L, N44, N49, N206, N63A, N157B)1. Introduction
Supernova remnants (SNRs) are expected to produce infrared (IR) emission from such mechanisms as atomic and molecular line emission (dominated by ground-state fine structure lines), free-free emission from hot gas, synchrotron emission, and thermal continuum emission from dust heated by collisions with the post-shock gas. Of these, we expect only negligible contributions from free-free emission (e.g., Fischera et al., 2002) or from synchrotron emission (Graham et al., 1987a), except where a pulsar-wind nebula (PWN) may be present. Thus, the IR emission is thought to be dominated by line emission and/or thermal emission from dust. The dust emission is of particular interest to the study of SNRs, as supernovae are thought to produce a significant fraction of dust in the ISM (e.g., Dwek, 1998). Dust emission, in turn, is an important factor in cooling the hot plasma within SNRs through inelastic collisions with electrons and ions (Ostriker & Silk, 1973; Smith & Cox, 2001).
Infrared emission was detected with the Infrared Astronomy Satellite (IRAS) from roughly a third of the known Galactic SNRs, demonstrating the difficulty in detecting many of these objects in the confusion with other IR sources in the ISM. Because of this confusion, most of the SNRs to be observed were comparatively bright, nearby objects (Arendt, 1989). Similarly, IRAS observations of the Large Magellanic Cloud (LMC), including pointed observations toward nine known remnants, only detected four SNRs (Graham et al., 1987a). Using the more recent GLIMPSE survey from the Spitzer Space Telescope, Reach et al. (2006) clearly detected 18 of 95 Galactic SNRs known to be within the fields.
Spitzer observations are sensitive to many forms of infrared emission from SNRs, depending on the instrument and wavelength band. The Infrared Spectrograph (IRS; Houck et al., 2004) is ideal for the study of line emission. The Infrared Array Camera (IRAC; Fazio et al., 2004) is expected to include emission from polycyclic aromatic hydrocarbons (PAHs) and very small grains (VSGs); H2 lines; and a number of atomic lines including Br 4.1 µm, [Fe II] 5.3 µm and [Ar II] 7.0 µm. The Multiband Imaging Photometer for Spitzer (MIPS; Rieke et al., 2004) bands are also expected to include some atomic line emission, including [Fe II] 24.5 µm, [O I] 63.2 µm, and [C II] 157 µm; additionally, we expect significant thermal emission from collisionally heated dust.
Dust emission from SNRs is of particular interest. It has been suggested that supernovae (SNe) are one of the principal sources of dust production (e.g., Dwek, 1998; Todini & Ferrara, 2001; Dunne et al., 2003). Theoretically, models have predicted as much as 0.2-4 M☉ of dust production in a typical Type II supernova (e.g., Todini & Ferrara, 2001; Dunne et al., 2003). Certainly spectroscopic and photometric observations have suggested dust formation in at least five supernovae, including SN1987A (Danziger, 2005).
Finding this freshly produced dust in SNRs, however, has proven problematic. Infrared fluxes attributed to warm ( 100-200 K) dust have been observed in young remnants such as Cas A, Tycho, and Kepler (e.g., Braun, 1987; Arendt et al., 1999; Hines et al., 2004), but the inferred dust mass is generally several orders of magnitude less than that predicted. Furthermore, it is often unclear whether this dust was largely produced in the SN or has since been swept up from the surrounding medium.
Dust at cooler temperatures ( 25 K) has also been detected toward remnants such as Cas A (Dunne et al., 2003) and Kepler (Morgan et al., 2003) using sub-millimeter continuum observations. Substantially greater dust masses ( 1 M☉) have been deduced from these observations, but again, how much of this dust is ejecta from the recent SN is unknown. Worse, not all of the observed dust may be physically associated with the SNRs themselves. In fact, Wilson & Batrla (2005) suggest that “at least one-half” of the “cold” dust emission from the direction of Cas A is actually foreground emission.
| SNR | Inst. | Mode | Prgrm | AOR | PI | Date |
|---|---|---|---|---|---|---|
| N11L | IRAC | 530s Map | 3565 | 11171840 | Chu | 2004 Nov. 30 |
| N11L | MIPS | Scan Map | 3565 | 11177728 | Chu | 2005 Mar. 7 |
| N44-SNR | IRAC | 530s Map | 3565 | 11172352 | Chu | 2005 Mar. 28 |
| N44-SNR | MIPS | Scan Map | 3565 | 11177984 | Chu | 2005 Apr. 7 |
| N49 | IRAC | 102s Map | 124 | 8152064 | Gehrz | 2004 May 5 |
| N49 | MIPS | 24µm Phot | 124 | 8151808 | Gehrz | 2004 May 26 |
| N49 | MIPS | 70µm Phot | 124 | 8791040 | Gehrz | 2005 May 26 |
| N49 | IRS | Stare | 124 | 6586112 | Gehrz | 2004 May 31 |
| N206-SNR | IRAC | 312s Map | 1061 | 6063104 | Gorjian | 2003 Nov. 21 |
| N206-SNR | MIPS | Scan Map | 717 | 7864320 | Rieke | 2003 Nov. 24 |
| N63A | IRAC | 530s Map | 3565 | 11173888 | Chu | 2004 Dec. 16 |
| N63A | MIPS | Scan Map | 3565 | 11178496 | Chu | 2005 Mar. 8 |
| N157B | IRAC | 312s Map | 63 | 4379904 | Houck | 2004 Jan. 12 |
| N157B | IRAC | 312s Map | 1032 | 6056960 | Brandl | 2003 Nov. 06 |
2. Observations
We obtained proprietary Spitzer observations for regions which include the LMC SNRs N63A, N11L and SNR 052367.9 in N44, as well as archival Spitzer data for SNRs N49, SNR 053271.0 in N206, and N157B. The observations are summarized in Table 1. All datasets were processed by the Spitzer Science Center (SSC) to produce Basic Calibrated Data (BCD) files.
Images with IRAC were obtained for all six SNRs. The observations were carried out in mapping mode for the 3.6, 4.5, 5.8, and 8.0 µm bands. All observations except that for N49 were made with high dynamic range and cycling dither; the N49 images were taken with a 5-Gaussian dither. The exposure times for each map are included in Table 1. We used post-BCD mosaic images resulting from the standard SSC reduction pipeline (version S11).
MIPS scan maps were available for SNRs N63A, N11L, N44 (SNR), and N206 (SNR) in the 24, 70, and 160 µm bands. All of the observations were taken at a Medium scan rate, with a scan leg length of 05 and a scan step of 148″. Spatial coverages were 50′20′ for N11L, N44 (SNR), and N206 (SNR), and 50′15′ for N63A. For N49, observations in the MIPS Photometry mode were available in the 24 and 70 µm bands. The 24 µm observation took four 3 s observations of a small field, while the 70 µm observation took one 10 s observation of a large field. We used the standard post-BCD images for our study.
N49 was observed with the IRS in staring mode. Low-resolution spectra were obtained in the 5.2–8.7 µm (SL2) and 7.4–14.5 µm (SL1) bands; high-resolution spectra were obtained in the 9.9–19.6 µm (SH) and 18.7–37.2 µm (LH) bands. For each instrument, a spectrum is taken at two “nod” positions, intended for on- and off-source comparisons. In this case, both positions fall on similar filamentary regions in N49. IRS spectra were extracted and calibrated using the SSC SPICE package. The flux calibration for these spectra is based on SSC established conversion factors from electrons s-1 to Jy, corrected by factors determined from the spectra of standard stars. No background subtraction was performed, as both “nod” positions lie along emitting material within N49.
3. Results
3.1. Imaging
There is a great deal of variation as to which SNRs can be seen in each of the IRAC and MIPS wavebands (above the level of the nearby H II complexes). Two of these SNRs, N44 and N206, are not detected in any band; two others, N11L and N157B, are faintly visible at 4.5 µm. N63A and N49 both have interior concentrations of material that are evident at all available wavelengths; in both cases, however, the SNR limb is distinct at 24 µm but undetectable in other wavebands.
Flux densities for these objects in each waveband are listed in Table 2. When the object is not detected in a given waveband, an upper limit for a detection 2 over the background is given instead. These fluxes and upper limits are preliminary figures and should be treated with caution. For one, the SNRs are generally superposed on diffuse emission from the nearby H II complexes. To account for this and other background emission, we found the median level of emission immediately surrounding each SNR, and subtracted this from the measured flux values. The uncertainties in the background estimates suggest that the listed fluxes are uncertain by 20–30%. In addition, there are uncertainties in the photometric calibrations of both IRAC and MIPS, ranging from at or below 10% for IRAC and for MIPS 24 µm, to 20% for MIPS 70 and 160 µm. Because these objects are extended, the IRAC fluxes are multiplied by the correction factor for an “infinite” aperture as recommended in the IRAC Data Handbook111http://ssc.spitzer.caltech.edu/irac/dh/iracdatahandbook2.0.pdf, Table 5.7: 0.94, 0.94, 0.63 and 0.69 for 3.6, 4.5, 5.8 and 8 µm, respectively. The SNRs are discussed individually below.
| Band | N11L | N44 | N49 | N49-limb | N206 | N63A | N63A-limb | N157B |
|---|---|---|---|---|---|---|---|---|
| (µm) | (mJy) | (mJy) | (mJy) | (mJy) | (mJy) | (mJy) | (mJy) | (mJy) |
| 3.6 | 74 | 32 | 8.8 | 96 | 37 | 6.8 | 62 | |
| 4.5 | 1.5 | 51 | 41 | 8.2 | 70 | 32 | 5.9 | 87 |
| 5.8 | 86 | 130 | 26 | 140 | 130 | 17 | 140 | |
| 8.0 | 8.5 | 190 | 180 | 30 | 250 | 300 | 45 | 210 |
| 24 | 744 | 1500 | 66 | 300 | 2300 | 760 | ||
| 70 | 5100 | 10,200 | 433 | 3200 | 7700 | 2100 | ||
| 160 | 12,500 | 2200 | 5800 | 2300 | ||||
| AreaaaArea on the sky (of SNR or portion thereof) for which flux densities are estimated, given in square arcminutes. The N49-limb area includes only the eastern limb, without any of the bright filaments; the N63A-limb area excludes the three-lobed nebular emission; and the N157B area excludes the southern dust clouds. | 0.73 | 8.80 | 1.11 | 0.40 | 8.31 | 1.31 | 0.92 | 1.20 |
Note. — “” indicates that the SNR is not detected in this waveband. The number given is an upper limit, giving the flux required for a detection 2 above the background.
3.1.1 N11L
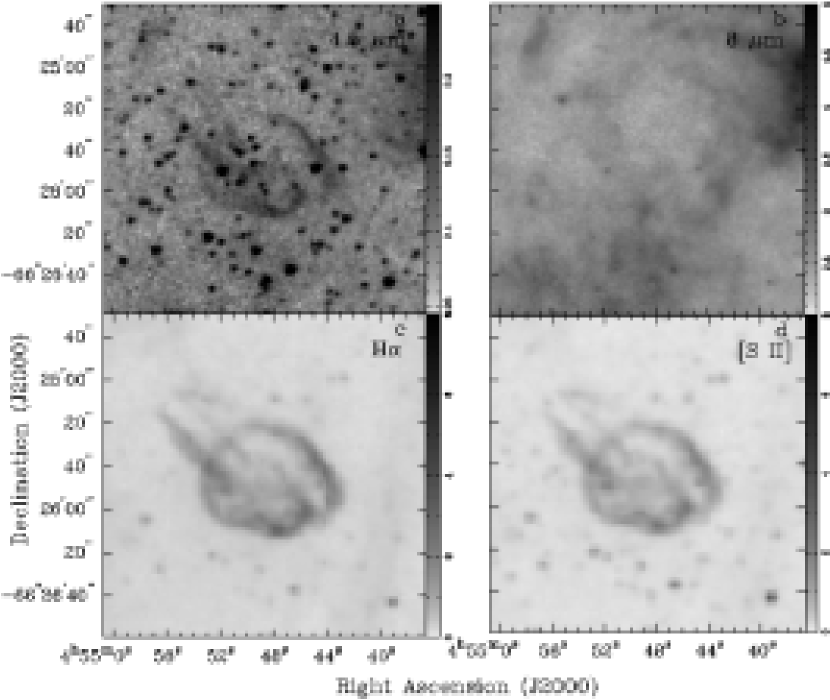
N11L (SNR 0454-68.5) is on the periphery of the N11 H II complex, framed by a 150 pc filament at the edge of that complex. The SNR itself shows a clear shell structure in optical emission lines, with filaments projecting beyond the boundary of that shell. Its optical expansion velocity is km s-1 (Williams et al., 1999).
N11L was close to the edge of the region scanned in the N11 observation; it was only partially covered in the 3.6 and 5.8 µm IRAC bands, and was at the extreme edge of the three MIPS bands. No emission from the SNR was distinguished in any of these bands. Likewise, the 8 µm IRAC band showed no emission above the background level for this SNR. In the 4.5 µm IRAC band, however, the SNR shell is faint but distinct, with a similar morphology to that seen in H (Fig. 1).
3.1.2 SNR 0523-67.9 in N44
The N44 SNR is to the northeast of the N44 H II region, overlapping with the H II region to the west and south (Chu et al., 1993). The SNR has a bi-lobed structure, possibly due to an intersecting dust lane. It shows an irregular expansion, with velocities of up to 150 km s-1 (Kim et al., 1998).
The SNR in N44 is, in general, conspicuous by its absence in the IRAC and MIPS images. There seems to be no infrared emission at Spitzer wavelengths following the SNR shell seen in the optical and X-ray regimes. A large cloud seen in all bands overlaps the SNR southwestern limb; an “arm” of that cloud seen clearly at 5.8, 8.0 and 24 µm protrudes across the SNR between its two lobes. This “arm”, seen at the IR wavelengths which are most sensitive to dust emission, is coincident with the dust lane causing obscuration in optical images. Some 5.8 and 8.0 µm emission surrounds the shell boundary, but aside from the intersecting “arm”, the emission in these bands is notably lower over most of the optical extent of the SNR (Fig. 2). While it is quite possible that some of the dust “arm” is shock-heated by the SNR behind it, the “arm” appears to be part of a much larger IR emission feature that extends well south of the SNR on the sky.
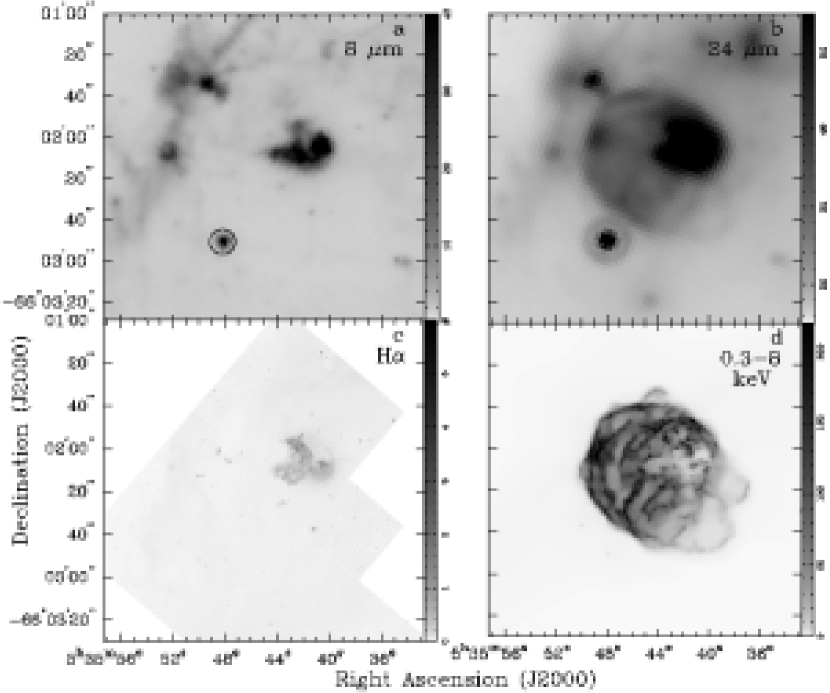
3.1.3 N49
N49 (SNR 0525-66.1) is unusual for this sample, in that it is not situated in or near an H II region. However, it does lie near a molecular cloud, with which it may be interacting (Banas et al., 1997). X-ray and radio maps show a complete SNR shell (Park et al., 2003; Dickel & Milne, 1998), while optical maps largely highlight a complex of filaments covering the eastern side of the SNR (Bilikova et al., 2006). It was noted as an IRAS source by Graham et al. (1987a).
Unlike most of the remnants discussed here, N49 shows clearly in all four of the IRAC bands and the 24 and 70 µm MIPS bands (Fig. 3). Observations of this SNR in the 160 µm band are not yet available in the archive. Regions that are bright in the IRAC bands correspond well to brighter regions of emission at optical wavelengths (Bilikova et al., 2006), even showing some of the same filamentary structure (Fig. 4). The 70 µm image shows very similar structure, albeit at lower resolution. At 24 µm, however, in addition to these bright emission regions, one can also detect faint emission from the rest of the SNR as seen in the X-ray and radio regimes, with a morphology very similar to that in radio. In particular, the western limb of the SNR, which has no detectable optical emission, is seen faintly but distinctly at 24 µm. In Table 2, we estimate the flux density from the western limb only, as well as that from the entire SNR.
| Band | N shock | S shock | W phot | |
|---|---|---|---|---|
| (µm) | (mJy) | (mJy) | (mJy) | |
| 3.6 | 4.6 | 11 | 11 | |
| 4.5 | 4.7 | 9.7 | 9.0 | |
| 5.8 | 13 | 35 | 30 | |
| 8.0 | 30 | 93 | 87 | |
| 24 | 280 | 370 | 370 | |
| Area | 0.044 | 0.054 | 0.036 | |
| I(3.6)/I(5.8) | 0.35 | 0.31 | 0.37 | |
| I(4.5)/I(8) | 0.16 | 0.10 | 0.10 |
Note. — The three lobes are referred to as “N shock” for the northeastern shocked lobe, “S shock” for the southeastern shocked lobe, and “W phot” for the western photoionized lobe. Areas are in square arcminutes.
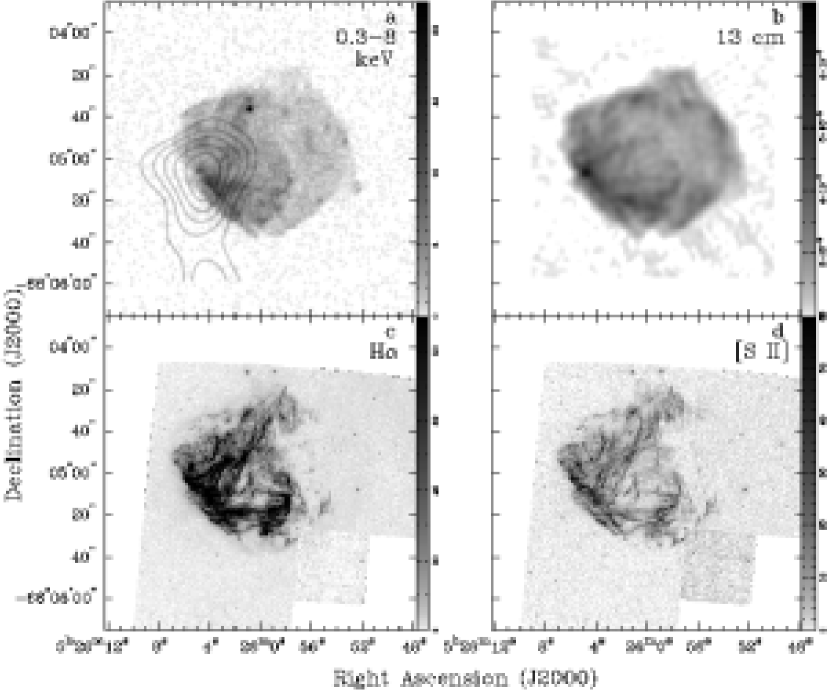
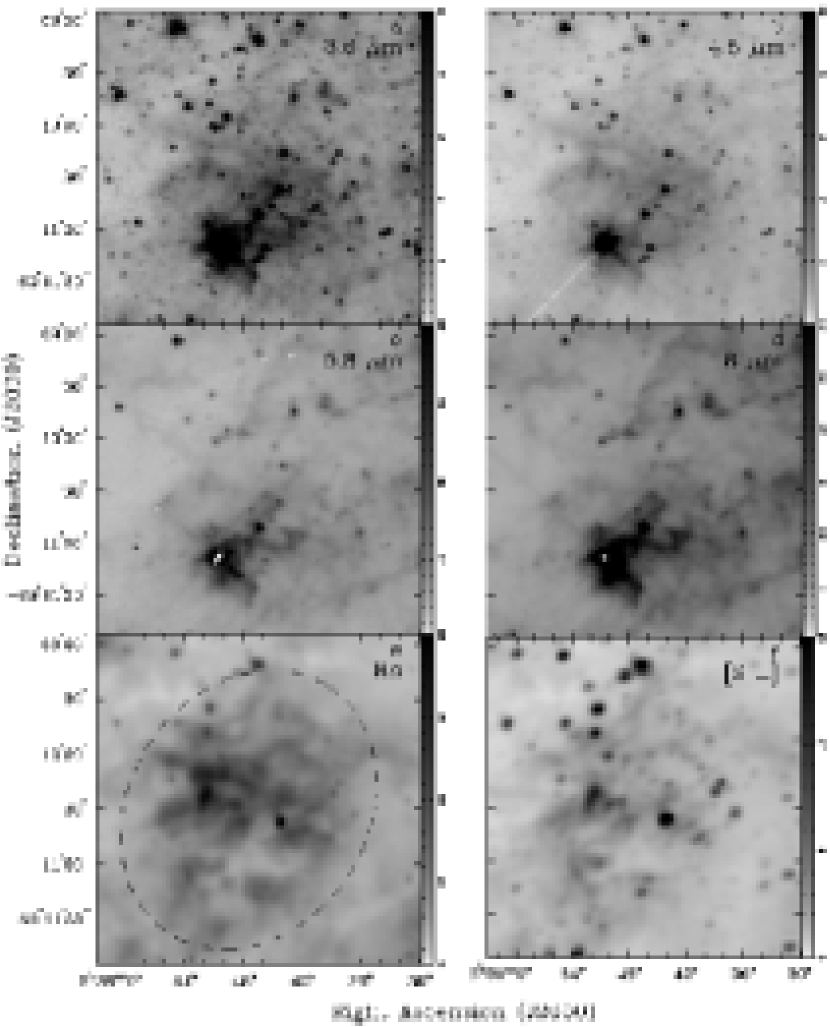
3.1.4 N63A
N63A (SNR 0535-66.0) lies within the N63 H II region (Shull, 1983). It was noted as an IRAS source by Graham et al. (1987a). While radio and X-ray observations of the SNR show a complete shell (Dickel et al., 1993; Warren et al., 2003), most of this shell is not seen in optical emission lines. The bright optical emission is confined to a three-lobed structure on the western side of the SNR. Levenson et al. (1995) showed that the two eastern lobes of this nebula have high [S II]/H ratios, indicative of shock ionization, while the optical spectrum of the western lobe is more consistent with the photoionization in H II regions.
The optically-bright nebula is also bright in the IRAC and MIPS wavebands (Fig. 5). In the IRAC and 24 µm MIPS bands, where the resolution is sufficient to distinguish between the lobes, the western lobe is notably brighter than the two eastern lobes. In the IRAC bands, this three-lobed region is the only feature of N63A to appear clearly above the background emission. (A few bright optical knots elsewhere in the SNR may have some very faint corresponding emission in the IRAC images, but that emission is very close to background levels.) This also appears to be the case for the 70 and 160 µm observations, although the lower resolution of the latter images makes it more difficult to distinguish emission associated with the three-lobed nebula from the rest of the SNR. The flux densities for these lobes are given in Table 3.
The 24 µm MIPS band, on the other hand, shows clear emission over the entire X-ray/radio shell of the SNR. The emission is evenly distributed over most of the face of the SNR, aside from the aforementioned three-lobed structure. A slightly brighter spot on the eastern limb corresponds to an area with [S II]-bright knots and enhanced X-ray emission (Fig. 5; also Chu et al., 1999). The 24 µm image also shows faint loops to the southwest, projecting beyond the boundary of the SNR. These correspond well to soft X-ray “crescents” noted by Warren et al. (2003). With the exception of the three-lobed nebula (seen in X-rays as a heavily absorbed region), there is a strong correspondence between the 24 µm emission and the X-ray emission seen by Chandra. The flux density of this 24 µm emission, as with N49, is given separately in Table 2, as well as that of the SNR as a whole.
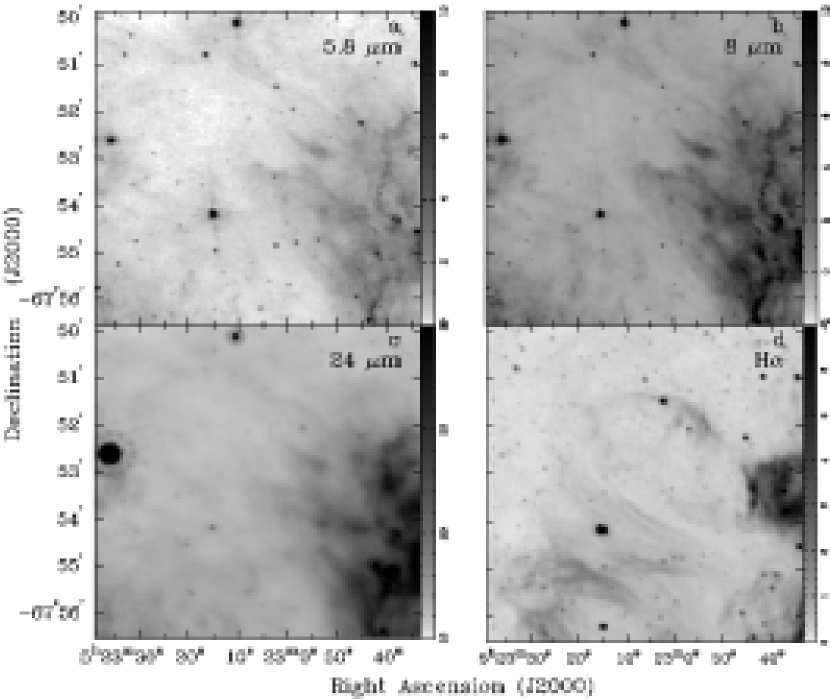
3.1.5 SNR 053271.0 in N206
The SNR lies just outside the eastern rim of the N206 H II region, with some overlap toward the south of the SNR. It was observed by IRAS but not detected (Graham et al., 1987a). It has an estimated expansion velocity of 200 km s-1. An elongated radio and X-ray feature within the remnant, associated with an X-ray point source, is thought to be a pulsar-wind nebula (Williams et al., 2005). Spitzer data for the neighboring H II region have been analyzed by Gorjian et al. (2004), who note that the region is rich in PAH emission except for the northeast side, nearest the SNR.
As with the SNR in N44, the SNR in N206 does not show emission easily distinguishable from that of the surrounding H II region (Fig. 6). An extension from the H II region overlaps the southern limb of the SNR, but does not seem to be correlated with the emission of the SNR at other wavelengths. Spitzer images of the N206 H II region, including the SNR, have been published by Gorjian et al. (2004).
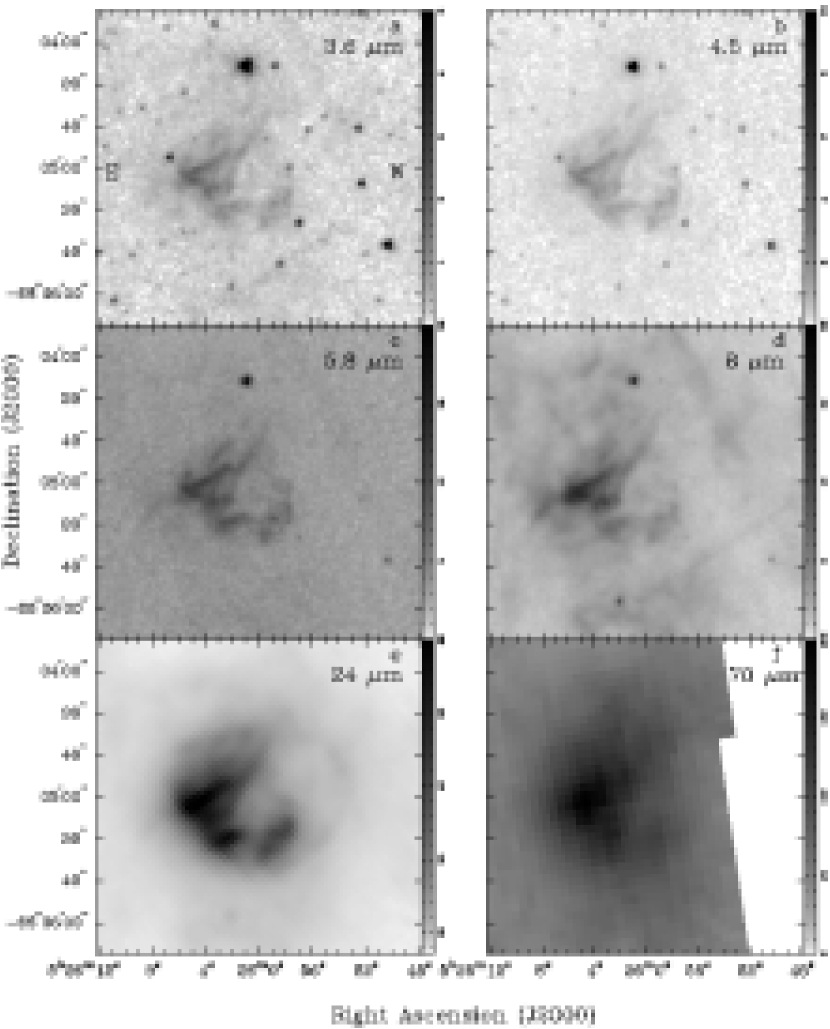
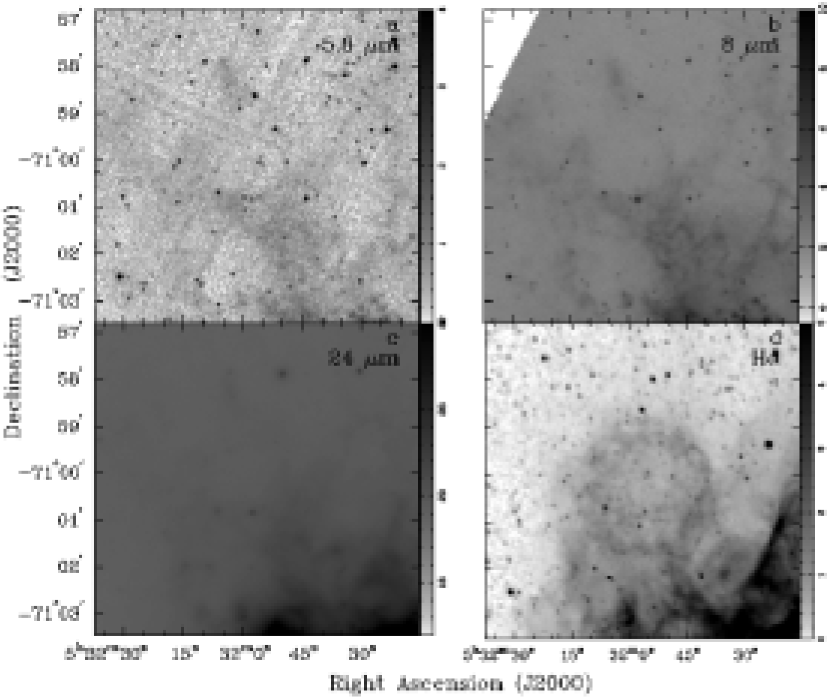
3.1.6 N157B
N157B (SNR 0538-69.1) adjoins the 30 Doradus giant H II region. It is one of the two LMC remnants for which the presence of an associated pulsar has been directly confirmed. Chu et al. (1992) used optical imaging and spectroscopy to determine a maximum SNR extent of about 90″ 70″, with patchy optical emission over its face and no clear shell structure. Dark clouds appear to be obscuring the southern portions of the SNR.
No MIPS data are yet available for N157B. In the IRAC bands (Fig. 7), the brightest feature is a “knot” on the southern side of the SNR, with an embedded point source. This bright IR region corresponds well to a region of lower H emission. However, there is also fainter emission at 3.6 and 4.5 µm north of this dust cloud. At both these wavelengths, the emission is somewhat enhanced (compared to the background) within the ellipse that encompasses most of the bright optical emission (Fig. 7e). In particular, a pair of curved filaments to the east of the SNR are seen clearly, particularly at 4.5 µm. At 5.8 and 8.0 µm, any emission from the SNR is confused with the extensive foreground/background emission in the region.
The faintness of the infrared emission is particularly surprising when one considers the pulsar-wind nebula within this SNR. Radio observations have suggested a spectral index of for the PWN (; Lazendic et al., 2000). Extrapolating from this radio spectrum, we would expect synchrotron contributions from the PWN of 320360 mJy in the 3.68 µm range, particularly at the location of the PWN itself as seen in radio and X-rays. Instead, the infrared emission, where detectable above the background, has much lower estimated flux densities and seems to follow the more prominent optical filaments rather than the radio/X-ray elongated PWN structure.
Of course, it is common for PWNe to exhibit a “broken” power-law spectrum, wherein the spectral index steepens as one goes to shorter wavelengths. The spectral break is often attributed to “aging” by synchrotron losses of a population of accelerated particles initially distributed with a power-law spectrum. In N158A (SNR 0540-69.3), the other LMC SNR to contain a PWN, this spectral break occurs at ultraviolet wavelengths; the 715 µm fluxes measured from ISOCAM are consistent with an extrapolation from the radio spectral index (Gallant & Tuffs, 1999). In N158A, also, the spatial distribution of the infrared emission with ISO closely matches that of the radio emission. Recent Spitzer observations of N158A, however, suggest that its IRAC-band emission follows the extrapolation of a simple power-law from optical wavelengths rather than radio – that is, “above” the break in the broken power-law spectrum (Reynolds et al., 2005). If the spectral break in N157B is similarly located at wavelengths longer than 8 µm, the resulting lower flux expected from synchrotron emission may be more consistent with our non-detection.
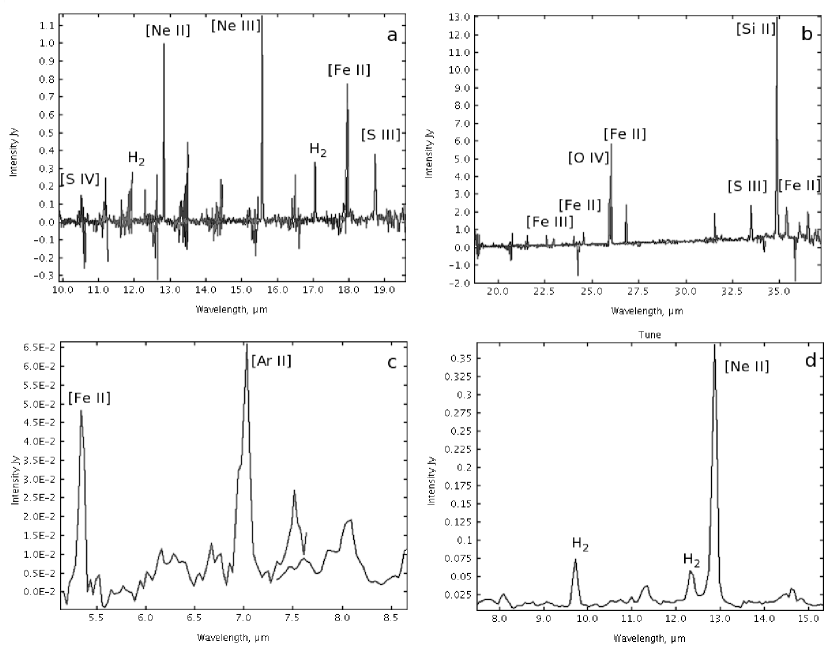
3.2. IR Spectroscopy of N49
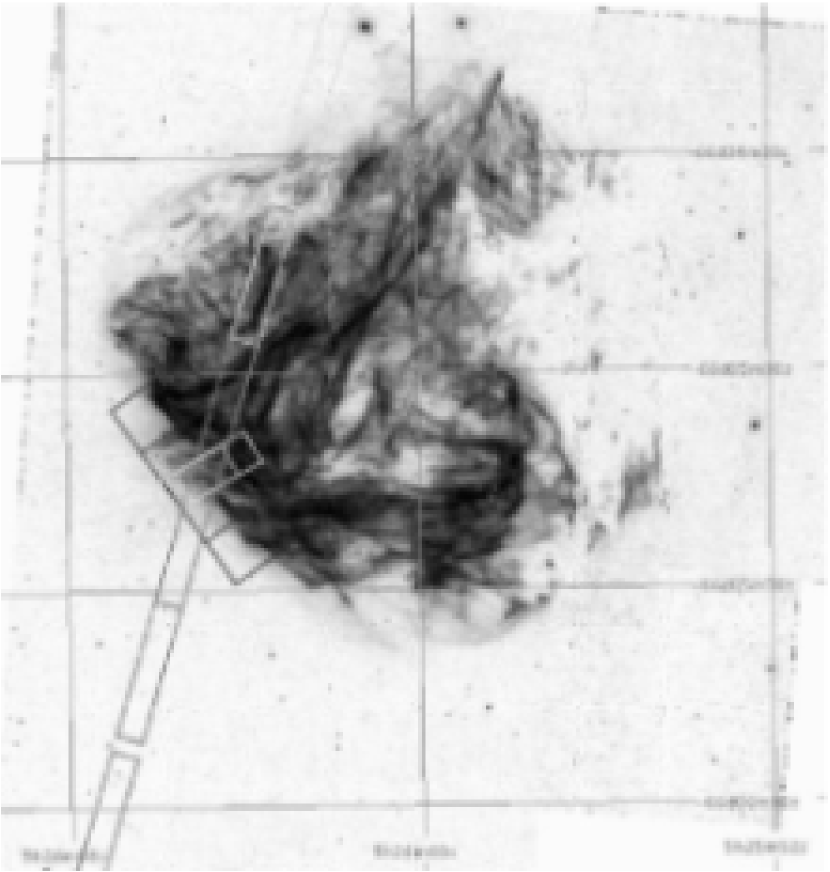
We examined the available low- and high-resolution IRS spectra for the SNR N49 at both “nod” positions. The placement of the slits is shown in Fig. 8. Spectra for the first nod position are shown in Fig. 9. The most prominent lines are given in Table 4, with their measured central wavelengths and intensities. The line intensities are given in terms of both peak flux density (Jy) and line flux (erg cm-2 s-1). Uncertainties in the flux calibration (for point sources) are estimated at 1 values of 20% for the low-resolution and 30% for the high-resolution observations. However, the gain along the slit has not yet been fully calibrated, so additional errors may be introduced to the flux calibrations for our extended sources. There appears to be a significant flux “jump” between similar lines observed by the SL and SH modules; in part this is probably due to the lack of background subtraction, but there is also a known mismatch between the detectors222IRS Data Handbook, http://ssc.spitzer.caltech.edu/irs/dh/irsDH10.pdf. Tentative identifications are given for each line based on wavelength coincidence with ionic and molecular lines known to be prominent over the 5.2-38 µm wavelength range in SNRs (e.g., Oliva et al., 1999a, b).
| Nod Position 1 | Nod Position 2 | Line | |||||
|---|---|---|---|---|---|---|---|
| (µm) | Fνaa Peak flux density in Jy | Fbb Line total flux in 10-14 erg cm-2 s-1 | (µm) | Fνaa Peak flux density in Jy | Fbb Line total flux in 10-14 erg cm-2 s-1 | ID | Comments |
| Short–Low Resolution | |||||||
| 5.34 | 0.011 | 11 | 5.34 | 0.013 | 8.2 | [Fe II] | 2nd order |
| 7.03 | 0.016 | 11 | 7.00 | 0.027 | 18 | [Ar II] | 2nd order |
| 9.72 | 0.033 | 16 | 9.72 | 0.047 | 19 | H2 | (0,0)S(3) trans |
| 12.32 | 0.034 | 14 | 12.32 | 0.041 | 14 | H2 | (0,0)S(2) trans |
| 12.87 | 0.189 | 46 | 12.87 | 0.193 | 56 | [Ne II] | 1st order |
| Short–High Resolution | |||||||
| 10.54 | 0.132 | 3.8 | 10.50 | 0.071 | 0.8 | [S IV] | noise |
| 12.30 | 0.180 | 3.9 | 12.30 | 0.153 | 5.3 | H2 | (0,0)S(2) trans |
| 12.83 | 1.00 | 47 | 12.83 | 0.429 | 20 | [Ne II] | |
| 15.57 | 1.15 | 43 | 15.57 | 0.567 | 20 | [Ne III] | |
| 17.05 | 0.333 | 11 | 17.05 | 0.266 | 7.9 | H2 | (0,0)S(1) trans |
| 17.94 | 0.665 | 24 | 17.94 | 0.297 | 13 | [Fe II] | |
| 18.73 | 0.376 | 14 | 18.73 | 0.183 | 8.6 | [S III] | |
| Long–High Resolution | |||||||
| 22.95 | 0.839 | 18 | 22.95 | 0.549 | 12 | [Fe III] | |
| 24.55 | 0.247 | 19 | 24.55 | 0.865 | 20 | [Fe II] | |
| 25.90 | 2.71 | 55 | 25.90 | 2.75 | 54 | [O IV] | |
| 26.00 | 5.83 | 125 | 26.00 | 6.28 | 115 | [Fe II] | |
| 33.47 | 2.37 | 49 | 33.47 | 2.62 | 44 | [S III] | |
| 34.84 | 12.9 | 263 | 34.84 | 14.3 | 217 | [Si II] | |
| 35.36 | 2.27 | 52 | 35.36 | 2.67 | 46 | [Fe II] | |
Note. — The “comments” field includes (a) whether the line is seen in first or second order for the Short-Low spectra; (b) which specific transition of molecular hydrogen causes a given line; and (c) whether the line is notably affected by noise in that region of the spectrum.
4. Discussion
Of our sample of 6 known SNRs within our available fields, we had 2 strong and 2 marginal detections in at least one waveband, along with the detection of a feature possibly associated with the N44 SNR. For comparison, 18 Galactic SNRs were strongly detected (score 1) and 17 possibly detected in confused fields (score 2) by Reach et al. (2006), out of a sample of 95 located within the fields of the Spitzer GLIMPSE survey. Note, however, that the Reach et al. (2006) search did not include MIPS data, so features which appear primarily at 24 µm, such as the outer limbs of N63A and N49, would not be seen in their survey.
4.1. Non-detections
The non-detections of the SNRs in N206 and, possibly, N44 are relatively unsurprising. Both of these SNRs have radii 20 pc (Table 5; Chu et al., 1993; Williams et al., 2005), while the other four SNRs have radii of pc. Thus, surface brightness becomes more of an issue for these larger remnants, and may well put them under the upper limits for detection in most wavebands (Table 2). The lack of detectable emission from the N206 SNR is particularly notable in light of the absence of PAH emission in that area of the N206 H II region, as noted by Gorjian et al. (2004).
We expect the environments of these SNRs to also have a strong influence on their detections (or lack thereof). To show substantial dust emission would require the presence of dense clouds interacting with the SNR. There is no evidence for the presence of such dust clouds in the immediate vicinity of the N206 SNR; in N44, the optically-obscuring “arm” suggests at least some dense concentrations, but not sufficient for shock-heated dust to raise the SNR’s IR surface brightness over the background.
4.2. Detections in 1 or 2 bands
The detection of weak emission from N11L at 4.5 µm and N157B at 3.6 and 4.5 µm are likely to be due to line emission from these remnants. Neither SNR is discernable in the dust-sensitive 8.0 µm band; the shorter-wavelength bands, in general, are dominated by ionic and (especially) molecular line emission (e.g., Reach et al., 2006). In N11L, the 4.5 µm morphology closely traces the SNR limb and filament structures seen in optical emission lines. In N157B the 3.6 and 4.5 µm emission are enhanced over the region where optical filaments are brightest, and in particular match the morphology of a pair of bright optical filaments. The relative prominence of the 4.5 µm band, in both cases, suggests that Br 4.1 µm may be a strong contributor to the IR emission.
4.3. Detections in multiple bands
4.3.1 Origins of infrared emission in N49
N49 is bright at all of the wavelengths observed to date by Spitzer. This may be a result, in part, from N49’s interaction with a molecular cloud to its southeast. In this, it is similar to the Galactic SNR IC443, which is also interacting with a nearby molecular cloud, and is bright at a wide range of infrared wavelengths (Mufson et al., 1986; Braun & Strom, 1986; Rho et al., 2001). The IRS observation of N49 confirms the presence of numerous strong ionic lines, as well as several lines probably originating from H2 transitions. The SNR does not appear to be dominated by PAH/VSG emission, as we would expect PAH-dominated emission to be strongest in the 8 µm band, while in fact the emission there is somewhat closer to background levels than at 3.6 or 4.5 µm. The lack of PAH emission could be accounted for by, e.g., PAH destruction by far-ultraviolet (FUV) radiation from the shock precursor of N49, which is known to have fairly rapid expansion velocities (Bilikova et al., 2006).
We then consider whether thermal emission from dust, as well as line emission, makes up a significant part of the IR emission from N49. The emission in the IRAC bands only traces the brightest optical filaments, which also show up strongly in the MIPS 24 and 70 µm bands. These bright filaments most probably are the source of the emission measured in the IRS spectra, which indicate a number of strong emission lines. The continuum levels of the post-BCD spectra appear to be very close to zero, strongly suggesting a lack of substantial continuum emission from hot dust. We therefore argue that line emission is the dominant component of the mid/far infrared emission from the bright filaments which are the dominant source of emission from N49. While we cannot rule out additional contributions from hot dust, this lack of continuum emission indicates that such contributions are comparatively minor.
Notably, however, the 24 µm emission (only) also shows the complete SNR shell of N49, including the west side which is largely undetectable in optical emission lines. The spectroscopy of N49 shows the presence of several lines within the bandwidth of the 24 µm image ( µm), including an [Fe III] line at 23.0 µm, [Fe II] lines at 24.5 and 26.0 µm, and an [O IV] line at 25.9 µm. The 25.9 and 26.0 µm lines are both considerably brighter than any of the lines which fall within the IRAC bands. Thus it is plausible that the source of the 24 µm emission from the SNR shell may be primarily line emission.
To quantify this estimate further, we summed the expected fluxes of the lines listed above, which, over the 111 223 area of the slit, gave a total flux of 2.2 erg cm-2 s-1. On the MIPS 24 µm image, we created an 111 223 region at approximately the same sky location and orientation as the placement of the IRS Long-High slit. We summed over the surface brightness of this region of the MIPS image, without background subtraction (since the IRS flux estimates included both source and background), and obtained a total flux of 2.8 erg cm-2 s-1. Thus, based on these rough estimates, line emission could be responsible for almost 80% of the MIPS 24 µm emission from N49. Note, however, that in addition to the statistical errors given, this estimate is subject to uncertainties in the calibrations of MIPS and IRS, particularly given the unknown background contribution to the IRS spectra. It is also quite possible that this estimate applies only to the comparatively IR-bright eastern region, and cannot be meaningfully applied to the rest of the limb, particularly the areas seen only at 24 µm.
On the other hand, the flux density of thermal emission from hot dust is proportional to , where is the Planck function, is an efficiency factor for the infrared emissivity, and is the dust temperature. For metals and crystalline grains in the mid/far-IR, ; typical dust temperatures from a young SNR are K (e.g., Stanimirović et al., 2005). Plotting this expected curve for the IRAC and MIPS wavebands, we see that the curve peaks in the 24 µm band. The curve predicts that the next highest flux density, in the 8 µm band, will be fainter than that at 24 µm. Since the 24 µm surface brightness of the northwest limb of N49 is relatively faint ( above local background), it is quite plausible that emission ten times fainter would not be detected.


4.3.2 Origins of infrared emission in N63A
For SNRs within H II regions, such as N63A, there may be sufficient far-ultraviolet radiation to destroy nearby PAHs. In fact, the shell (limb) of N63A is largely undetectable in any of the IRAC wavebands, which as we have noted above are most sensitive to PAH emission. At 24 µm, however, the complete shell of N63A (also seen in the X-ray and radio regimes) is apparent. The radio and IR coincidence might result from a significant synchrotron component in the IR. However, extrapolating the radio spectrum for N63A (Dickel et al., 1993) to 24 µm gives an expected flux density of 6 mJy at that wavelength, less than 1% of the observed flux density. Thus, we take the strong X-ray and IR correspondence as an indication that line emission again dominates in the shell at 24 µm. As with N49, this does not wholly preclude the presence of a hot dust component. However, the lack of optical emission again suggests a low-density environment (other than in the three-lobed nebula) and therefore that the region lacks the necessary dense clumps for significant dust emission.
In contrast, the three-lobed nebular region of N63A is apparent at all available wavelengths, most brightly in the western (photoionized) lobe. The spectral energy distribution (SED) of the entire SNR, which is dominated by this central nebula, appears similar to that of N49. While it is plausible that these high-density regions in N63A may have similar emission properties to the high-density filaments of N49, more detailed spectroscopy is required to probe the dominant processes producing the infrared emission. When the lobes are considered separately, their SEDs are similar to one another overall; surprisingly, the SEDs of the southeastern (shocked) lobe and the western (photoionized) lobe have almost identical spectral shapes, while the northeastern (shocked) lobe has an SED slightly divergent from those of the other two (Fig. 10). Given that the optical data suggest that the western lobe is an unshocked H II region while the eastern lobes are shocked by the SNR, it is surprising to find that the northeastern lobe, rather than the western lobe, shows the greatest difference from the other two lobes.
| SNR | Angular | Linear | Estimated | Age |
|---|---|---|---|---|
| Name | Radii aaSize is based on the semimajor and semiminor axis of an
ellipse fit to the optical extent of the SNR; except for N49 and N63A, where
the X-ray extent is used because some of the SNR is not seen in optical.
|
Radii | Age | reference |
| N11L | 35″ 30″ | 8.8 7.5 pc | 700015,000 yr | Williams et al. (1999) |
| N44-SNR | 134″ 122″ | 33.5 30.5 | 18,000 yr | Chu et al. (1993) |
| N49 | 40″ 40″ | 10.0 10.0 pc | 6600 yr | Park et al. (2003) |
| N63A | 37″ 37″ | 9.3 9.3 pc | 20005000 yr | Hughes et al. (1998) |
| N206-SNR | 95″ 95″ | 23.8 23.8 pc | 23,00027,000 yr | Williams et al. (2005) |
| N157B | 68″ 58″ | 17.0 14.5 pc | 5000 yr | Wang & Gotthelf (1998) |
4.3.3 Infrared and X-ray Comparisons
One means of addressing the possible contributions of line versus continuium emission is to examine the relative distribution of 24 µm emission compared to the X-ray emission, as done, for example, by Stanimirović et al. (2005) in the study of SNR 1E 0102.2-7219. Following a similar procedure for N49 and N63A, we re-centered and re-gridded the Chandra X-ray image for each SNR to match the corresponding 24 µm image. Each X-ray and 24 µm image was then normalized so that the peak emission associated with the SNR was set to 1.0. (For N49, the X-ray emission spatially corresponding to the location of SGR 0525-66 was not counted toward this “peak” emission.) The resulting normalization factors were ct s-1 arcsecs-2 and 63 MJy sr-1 for N49, and ct s-1 arcsecs-2 and 206 MJy sr-1 for N63A. We then divided the 24 µm images by the X-ray images in order to produce ratio maps (not shown), which give the distribution of 24 µm emission (with respect to the 24 µm peak) compared to the X-ray emission (with respect to the X-ray peak).
If we then consider an “infrared excess” to be present where these ratio maps show ratios greater than 1.0, and if we consider that regions dominated by thermal emission from dust should show such an “infrared excess,” then we can, by integrating over such regions, estimate a rough proportion of the total emission which, we presume, is due to continuum emission from dust. For N49, roughly three-quarters of the flux could then be attributed to continuum emission! (Note that the IRS slit locations do fall roughly where the ratio maps show an excess of X-ray emission compared with IR, so this is not necessarily inconsistent with the overwhelming dominance of line emission in the IRS spectra.) For N63A, the “infrared excess” is largely seen on the western side of the SNR, including the three-lobed nebula; using the above criteria we would expect approximately half the emission to be continuum emission from heated dust.
However, this somewhat simplistic approach must be treated with caution. Stanimirović et al. (2005) used the fact that that the strongest X-ray emission in 1E 0102.2-7219 was associated with reverse-shocked ejecta in that young SNR, a region which would be expected to generate strong line emission in many wavelength regimes. In contrast, N49 and N63A are both older remnants, in which the ejecta is probably intermixed with swept-up ISM to a large extent. For both these SNRs, some regions identified as having an “infrared excess” are also sites of significant optical line emission - including parts of the southeastern limb of N49 and the “three-lobed nebula” of N63A. IR emission associated with optically-emitting was suggested by Arendt et al. (1992) to include significant infrared line emission! Other regions, such as the western side of N49 and the southwestern limb of N63A (the “X-ray loops”), probably lack significant optical emission because that region of the SNR is expanding into a low-density environment. This raises the point that we would not expect the high-density clouds required to produce substantial thermal dust emission in such regions.
4.3.4 IRAC colors
Reach et al. (2006), in their study of Galactic SNRs, were able to measure fluxes for a number of those SNRs in all four IRAC bands. Based on measurements and simple models, the authors developed an IRAC color-color diagram showing the regions of “color space” expected for different emission mechanisms, including PAH, ionic, molecular and synchrotron emission. They found little evidence of synchrotron emission for their detected SNRs; and state that “observations of infrared emission from SNRs to date have shown little or no evidence of significant dust emission (PAH or continuum) within the wavelengths of the IRAC bands.” From their sample, they identified regions within the SNRs with colors typical of emission from molecular lines, ionic lines, and PAHs. A number of their detected SNRs showed significant molecular-line emission; several of these have other signs of molecular cloud interaction, such as maser emission.
N49 and N63A are the only SNRs in this sample for which all four IRAC bands are available. Using N49, we determine colors of I(3.6µm)/I(5.8µm)=0.25 and I(4.5µm)/I(8µm)=0.23. These colors place N49 between the “molecular shocks” and “ionic shocks” sections of the color-color diagram of Reach et al. (2006, Fig. 2), somewhat closer to the area where molecular shocks predominate. These colors are thought to represent “a mixture of molecular and ionic shocks,” and are seen in such remnants as, e.g., CTB 37A and G348.50.0. We see from the ionic and molecular lines identified by Spitzer IRS spectroscopy (Table 4) that this is indeed an accurate characterization for N49. Reach et al. (2006) notes that both CTB 37A and G348.50.0 are associated with OH 1720 masers, which strongly suggests that these remnants are interacting with molecular clouds, as N49 is thought to be. All lobes of the three-lobed nebula in N63A have colors (Table 3) that place them within the “molecular shock” portion of the diagram, suggesting that shocked molecular gas dominates at the near-IR wavelengths.
5. Conclusions
The point that line emission is often a substantial contributor to the infrared emission from SNRs has been raised for some time (e.g., Graham et al., 1987b; Arendt et al., 1992; Oliva et al., 1997, 1999a). For instance, Arendt et al. (1992) found that infrared line emission from shocked gas contributes “a significant fraction” to one component of the infrared emission - the component generally traced by the presence of optical emission. (Note that dust emission was also thought to contribute to this component, and that a second IR component, traced by an excess of IR to X-ray emission, was inferred to be generated only by collisionally heated dust.) More recently, Stanimirović et al. (2005) find that for the Small Magellanic Cloud SNR 1E 0102.2-7219, emission from the [O IV] line may contribute up to 60% of the 24 µm emission.
Our observations of these remnants have primarily shown infrared emission, where present, arising from optically-bright areas of the SNRs. The implication is that line emission is a significant contributor to the infrared emission of these remnants. The IRAC-band ratios of Reach et al. (2006) for the optical/IR-bright areas in N63 and N49 also indicate substantial contributions from ionic and molecular lines. This suggestion is greatly strengthened by the infrared spectroscopy of the optically-bright limb of N49, where the line contributions appear to overwhelmingly dominate the infrared flux density.
Perhaps the most interesting (and mysterious) result is that for our two clearest detections, N49 and N63A, the outer limb of the SNR (in both cases, extremely faint in optical emission lines) is detected clearly at 24 µm but not in the other wavebands. Stanimirović et al. (2005) find a similar result for 1E 0102.2-7219; the SNR is detected clearly at 24 µm, but not at 8 or 70 µm. Similarly, Borkowski et al. (2006), in a study of Type Ia SNRs in the Large Magellanic Cloud, find that none of their four SNRs are detected in the IRAC bands; two are detected at 24 and 70 µm, and two at 24 µm alone.
The comparative brightness of emission from these SNRs in the 24 µm band, compared to the other IR bands, may be due in part to the line emission from [O IV] and [Fe II], particularly in regions of bright optical emission. However, we are far from able to rule out a secondary dust component even in these regions. The areas of strong 24 µm emission, weak optical emission, and moderate X-ray emission may point to a very different physical case, where IR emission from collisionally heated dust may yet predominate. Our future spectral mapping of N49 and N63A with Spitzer’s IRS are expected to elucidate this situation.
The potentially significant contributions of infrared line emission from at least some SNRs has serious implications for the calculations of the dust content within those SNRs, and the use of such calculations to constrain models of dust production and destruction. For example, dust mass estimates based on the 24 µm Spitzer flux or the 25 µm IRAS flux may overestimate the amount of dust due to overestimation of the flux resulting from inclusion of line emission. For some remnants, e.g. where nonradiative shocks dominate, this difference may be only slight, but for highly radiative SNRs, particularly those interacting with dense ambient material, the effect may be significant. Likewise, fits to SEDs may be unphysical if line contributions in one or more bands are not properly taken into account.
References
- Arendt (1989) Arendt, R. G. 1989, ApJS, 70, 181
- Arendt et al. (1992) Arendt, R. G., Dwek, E., & Leisawitz, D. 1992, ApJ, 400, 562
- Arendt et al. (1999) Arendt, R. G., Dwek, E., & Moseley, S. H. 1999, ApJ, 521, 234
- Banas et al. (1997) Banas, K. R., Hughes, J. P., Bronfman, L., & Nyman, L.-A. 1997, ApJ, 480, 607
- Bilikova et al. (2006) Bilikova, J., Williams, R., Chu, Y.-H., Lundgren, B., & Gruendl, R. 2006, AJ, submitted
- Borkowski et al. (2006) Borkowski, K. J., et al. 2006, ApJ, 642, L141
- Braun & Strom (1986) Braun, R., & Strom, R. G. 1986, A&A, 164, 193
- Braun (1987) Braun, R. 1987, A&A, 171, 233
- Chu et al. (1992) Chu, Y.-H., Kennicutt, R. C., Schommer, R. A., & Laff, J. 1992, AJ, 103, 1545
- Chu et al. (1993) Chu, Y.-H., Low, M.-M. M., Garcia-Segura, G., Wakker, B., & Kennicutt, R. C. 1993, ApJ, 414, 213
- Chu et al. (1999) Chu et al. 1999, in IAUS 190, New Views of the Magellanic Clouds, eds. Y.-H. Chu, N. Suntzeff, J. Hesser, & D. Bohlender, p. 143
- Danziger (2005) Danziger, I. J. 2005, ASP Conf. Ser. 342: 1604-2004: Supernovae as Cosmological Lighthouses, 342, 279
- Dickel et al. (1993) Dickel, J. R., Milne, D. K., Junkes, N., & Klein, U. 1993, A&A, 275, 265
- Dickel & Milne (1998) Dickel, J. R., & Milne, D. K. 1998, AJ, 115, 1057
- Dunne et al. (2003) Dunne, L., Eales, S., Ivison, R., Morgan, H., & Edmunds, M. 2003, Nature, 424, 285
- Dwek et al. (1987) Dwek, E., Hauser, M. G., Dinerstein, H. L., Gillett, F. C., & Rice, W. L. 1987, ApJ, 315, 571
- Dwek (1998) Dwek, E. 1998, ApJ, 501, 643
- Fazio et al. (2004) Fazio, G. G., et al. 2004, ApJS, 154, 10
- Fischera et al. (2002) Fischera, J., Tuffs, R. J., & Völk, H. J. 2002, A&A, 386, 517
- Gallant & Tuffs (1999) Gallant, Y. A., & Tuffs, R. J. 1999, ESA SP-427: The Universe as Seen by ISO, 313
- Gorjian et al. (2004) Gorjian, V., et al. 2004, ApJS, 154, 275
- Graham et al. (1987a) Graham, J. R., Evans, A., Albinson, J. S., Bode, M. F., & Meikle, W. P. S. 1987, ApJ, 319, 126
- Graham et al. (1987b) Graham, J. R., Wright, G. S., & Longmore, A. J. 1987, ApJ, 313, 847
- Hines et al. (2004) Hines, D. C., et al. 2004, ApJS, 154, 290
- Houck et al. (2004) Houck, J. R., et al. 2004, ApJS, 154, 18
- Hughes et al. (1998) Hughes, J. P., Hayashi, I., & Koyama, K. 1998, ApJ, 505, 732
- Kim et al. (1998) Kim, S., Chu, Y.-H., Stavely-Smith, L., & Smith, R.C. 1998, ApJ, 503, 729
- Lazendic et al. (2000) Lazendic, J. S., Dickel, J. R., Haynes, R. F., Jones, P. A., & White, G. L. 2000, ApJ, 540, 808
- Levenson et al. (1995) Levenson, N. A., Kirshner, R. P., Blair, W. P., & Winkler, P. F. 1995, AJ, 110, 739
- Morgan et al. (2003) Morgan, H. L., Dunne, L., Eales, S. A., Ivison, R. J., & Edmunds, M. G. 2003, ApJ, 597, L33
- Mufson et al. (1986) Mufson, S. L., McCollough, M. L., Dickel, J. R., Petre, R., White, R., & Chevalier, R. 1986, AJ, 92, 1349
- Oliva et al. (1997) Oliva, E., Drapatz, S., Lutz, D., Sturm, E., & Moorwood, A. F. M. 1997, Ap&SS, 255, 211
- Oliva et al. (1999a) Oliva, E., Lutz, D., Drapatz, S., & Moorwood, A. F. M. 1999, A&A, 341, L75
- Oliva et al. (1999b) Oliva, E., Moorwood, A. F. M., Drapatz, S., Lutz, D., & Sturm, E. 1999, A&A, 343, 943
- Ostriker & Silk (1973) Ostriker, J., & Silk, J. 1973, ApJ, 184, L113
- Park et al. (2003) Park, S., Burrows, D. N., Garmire, G. P., Nousek, J. A., Hughes, J. P., & Williams, R. M. 2003, ApJ, 586, 210
- Reach et al. (2006) Reach, W. T., et al. 2006, AJ, 131, 1479
- Reynolds et al. (2005) Reynolds, S. P., et al. 2005, American Astronomical Society Meeting Abstracts, 207,
- Rho et al. (2001) Rho, J., Jarrett, T. H., Cutri, R. M., & Reach, W. T. 2001, ApJ, 547, 885
- Rieke et al. (2004) Rieke, G. H., et al. 2004, ApJS, 154, 25
- Russel & Dopita (1992) Russel, S. C. & Dopita, M. A. 1992, ApJ, 384, 508
- Shull (1983) Shull, P. 1983, ApJ, 275, 592
- Smith & Cox (2001) Smith, R. K., & Cox, D. P. 2001, ApJS, 134, 283
- Stanimirović et al. (2005) Stanimirović, S., Bolatto, A. D., Sandstrom, K., Leroy, A. K., Simon, J. D., Gaensler, B. M., Shah, R. Y., & Jackson, J. M. 2005, ApJ, 632, L103
- Todini & Ferrara (2001) Todini, P., & Ferrara, A. 2001, MNRAS, 325, 726
- Wang & Gotthelf (1998) Wang, Q. D., & Gotthelf, E. V. 1998, ApJ, 509, L109
- Warren et al. (2003) Warren, J. S., Hughes, J. P., & Slane, P. O. 2003, ApJ, 583, 260
- Williams et al. (1999) Williams, R. M., Chu, Y.-H., et al. 1999, ApJ, 514, 798
- Williams et al. (2005) Williams, R. M., Chu, Y.-H., et al. 2005, ApJ, 628, 704
- Wilson & Batrla (2005) Wilson, T. L., & Batrla, W. 2005, A&A, 430, 561