The Spectral Energy Distribution of the High-Z Blazar Q0906+6930
Abstract
We describe further observations of QSO J0906+6930, a z=5.48 blazar likely to be detected in -rays. New radio and X-ray data place significant constraints on any kpc-scale extension of the VLBA-detected jet. Improved optical spectroscopy detects absorption from an intervening galaxy at z=1.849 and raise the possibility that this distant, bright source is lensed. We combine the new data into an improved SED for the blazar core and comment on the Compton keV-GeV flux component.
1 Introduction
Q0906+6930 (=GB6 J0906+6930=SRM J090630.74+693030.8) was discovered in a survey of radio-bright, flat spectrum sources chosen to be like the EGRET blazars (Sowards-Emmerd, Romani & Michelson, 2003; Sowards-Emmerd, et al., 2005). Follow-up observations confirmed a large redshift and found evidence for a very compact pc-scale jet with the VLBA (Romani et al., 2004). The source is quite radio-loud with an , supporting the blazar interpretation. These data showed several peculiar properties. For example, the radio spectrum appeared to steepen above 10 GHz, while the jet component still appeared to be inverted. Also, the source shows a relatively large Å continuum flux and large kinematic widths for the emission lines. These suggest a large black hole mass [note that an error in the luminosity quoted in Romani et al. (2004) implied ]. While this source was, at best, a weak background enhancement in the EGRET survey, the prospects for detection with GLAST seem quite strong. This is particularly interesting as observations of a cut-off in the blazar spectrum above GeV can be used to probe absorption by light produced at the peak of star formation (Chen, Reyes & Ritz, 2004).
We report here on further observations of Q0906+6930, which support its identification as a high-z blazar, test the nature of the jet component and probe it’s status as a high mass, high luminosity source.
2 New Observations
Several radio-loud QSO at high redshift show kpc-scale jets so our first objective was to constrain such arcsecond-scale emission. At the blazar redshift, kpc (for an , km/s/Mpc flat cosmology, assumed throughout; Spergel et al. 2006). Perhaps the most convincing case of such jet emission is still that of QSO GB 1508+5714 at z=4.3, which is detected both in the X-ray (Siemiginowska et al., 2003) and radio (Cheung, 2004) bands. Its large observed supports a scenario where the jet electrons Compton up-scatter CMB seed photons, which have a large increase in energy density, at high redshift (Schwartz, 2002).
2.1 X-ray imaging
We obtained a 30 ks Chandra observation of the blazar on 2005 July 1 positioned at the best focus of the ACIS-S3 backside-illuminated chip. The observations were standard full-frame 3.2s TE exposures in very faint (VF) mode. No strong background flaring was seen during this observation so that all of the data could be included in the analysis. The data were processed using standard algorithms in CIAO version 3.2 and CALDB version 3.0.0. The blazar was clearly detected, providing counts, at a position coincident with the radio core. With this modest flux, pile-up is under 1%, and so we can ignore it in the subsequent analysis. The X-ray image is consistent with a PSF computed for the blazar spectrum; the largest excess (at , position angle ) contains 4 photons and is not significant. Thus, on arcsecond scales, any extended (jet) emission must have % of the core flux. A number of coronal emission field stars and some unidentified objects (presumably background AGN) were detected in this integration, but none showed notable peculiarities, so we do not discuss these further.

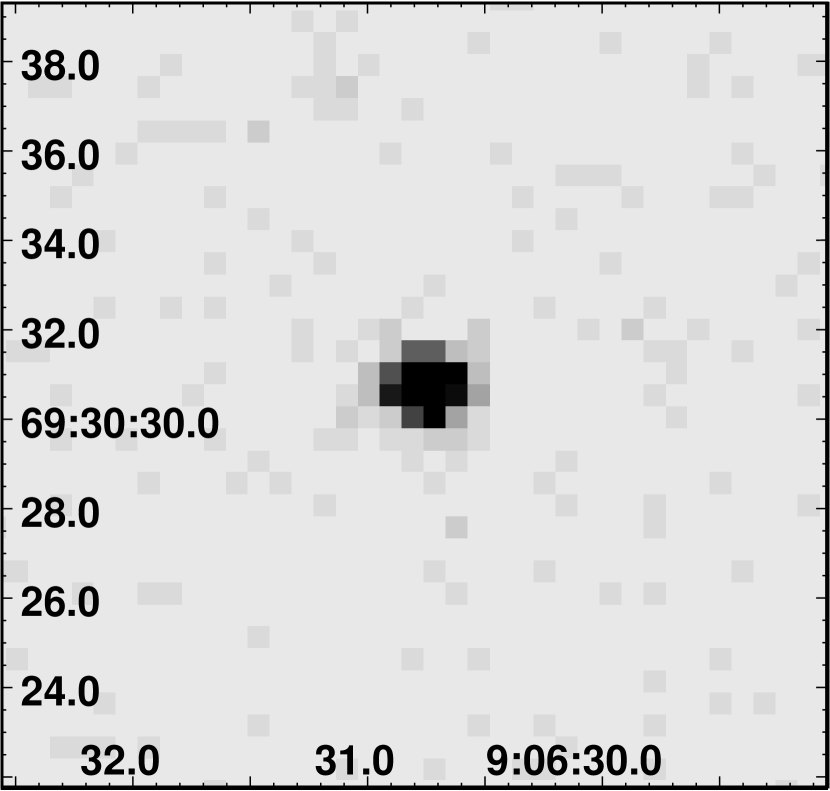
The X-ray spectrum (figure 1) is adequately described by a simple absorbed power-law, with a low absorption , a photon index and an unabsorbed flux . Although the data show a small excess to the best fit power-law model around 1 keV, an attempt to fit a red-shifted Fe line produced no significant detection. The upper limit to the line flux is , or % of the continuum flux. These spectral parameters are quite typical of lower redshift blazars. The measured absorption is consistent with the Galactic column in this direction, from the COLDEN tool. We can also compare the X-ray properties with those of a set of radio-loud high-redshift QSO recently reported by Lopez et al. (2006). Our observed and inferred , are in excellent agreement with the objects measured in this paper. We conclude that this is a fairly typical radio-bright quasar at high redshift.
2.2 Radio imaging
To search for a larger scale counterpart of the VLBI jet reported in Romani et al. (2004), we also obtained VLA images with the A array at 1.4-, 4.8- and 8.4 GHz on 2004, October 7. The on-source times were 10m, 30min and 50min respectively. These data were calibrated and mapped using standard AIPS routines and were found to be adequately described by a simple point source model. The final map noise was within a factor of of the thermal noise in each case. Measuring the rms background in an annulus between the beam size and , we obtain limits on any jet component (Table 1). The largest map fluxes in the searched regions are consistent with statistical fluctuations for these rms vales, so we can take upper limits on the jet flux along the position angle of the mas jet to be the local rms, while the limits on any extended component are about two times larger. For the X-band image this search extends within of the blazar core, while for Q-band in the B-array, we searched down to .
Since no extended emission is seen in the A-array data, we used follow-on B-array observations on 2005 March 04 to obtain a six frequency, single epoch radio spectrum. The on-source total scan times are listed in Table 1. The data were calibrated by observations of 0542+498 (=3C 147) at each frequency. For all measurements, the statistical error in the flux density estimate was small. We add this in quadrature to the flux scale uncertainties described in the VLA calibrator manual (2% at L, C and X and 5% at U, K and Q) to obtain the flux density errors in table 1. For K and Q residual pointing errors and uncorrected atmospheric absorption may contribute additional error. In all cases a single unresolved component fit provided a satisfactory description of the Q0906+6930 data. In Table 1, we also give RMS fluctuation levels in an annulus about the point source. The local rms limits to extended flux for the three lower frequency bands are from the deeper, higher-resolution A-array images.
| Band | Freq(GHz) | On-Source time (min) | Core Flux (mJy) | Error (mJy) | Jet Annulus RMS (mJy) |
| L | 1.44 | 8 | 92 | 2.0 | 0.10† |
| C | 4.88 | 8 | 114 | 2.4 | 0.05† |
| X | 8.44 | 12 | 136 | 3.1 | 0.13† |
| U | 14.96 | 24 | 129 | 6.6 | 0.23 |
| K | 22.49 | 15 | 83 | 4.2 | 0.22 |
| Q | 43.33 | 30 | 43 | 2.2 | 0.26 |
† RMS from 2004/10/04 A-array maps
2.3 Optical Spectroscopy and Imaging
To further investigate the absorbed optical spectrum reported in Romani et al. (2004), we obtained higher resolution spectra using the HobbyEberly telescope (HET; Ramsey et al., 1998) Marcario Low Resolution Spectrograph (LRS; Hill et al., 1998) using the G3 VPH grating, which provides 1.88Å/pixel dispersion over the range 6250Å - 9100Å. The integrations used a slit, giving an effective resolution of Å. Standard queue observations were made on 2005 February 9 and 14 and 2005 May 9-10; conditions were generally sub-par with poor transparency or variable seeing. After standard IRAF processing and combination using the relative S/N, seven exposures totaling 8600s of integration were assembled to produce the spectrum in figure 2. Here the new G3 spectrum is plotted with a heavy line over the lower resolution G1 spectrum of Romani et al. (2004). The excellent correspondence between the fine structure in these spectra, especially in the Ly forest region, attests to the stable calibration. The combined spectrum has a S/N per resolution element of in the unabsorbed continuum.

These higher resolution data allow us to check the reality of absorption-line systems suggested in the G1 spectrum. Two metal line systems can be seen in the inset of figure 2, which shows the spectrum redward of Ly. In particular, we confirm a likely C IV doublet at , with a rest equivalent width (REW) for each component of Å. This system has an associated, apparently damped, Ly absorption and a minimum at Ly. More interesting is an apparent strong Mg II absorption at which was confused by possible N V emission in the lower resolution data. The REW of the 2795Å line is Å and the line spacing and doublet ratio support this identification. In our restricted spectral range no strong confirming line is expected.
The presence of intervening absorption line systems raises the possibility that the blazar is magnified by gravitational lensing, as discussed below. To constrain this hypothesis, we examined the limited imaging data. During HET queue spectroscopy, 10-30s white light set-up images are generally recorded through a 515nm long-pass filter. Six of these images had usable () image quality; these were S/N weighted and combined to produce a final image with FWHM. This was used to get an approximate limit on any extended source within of Q0907+6930 of . Imaging reconnaissance was also obtained using the MDM 2.4m RETROCAM on 2006 February 4, courtesy of J. Marshall and D. DePoy. Here s images ( FHWM) were combined. Although Ly forest absorption should suppress the quasar relative to the foreground galaxy in the band, in the combined image the blazar was again stellar, with an apparent magnitude of . We derive an upper limit of on any nearby galactic companion.
3 Spectral Energy Distribution
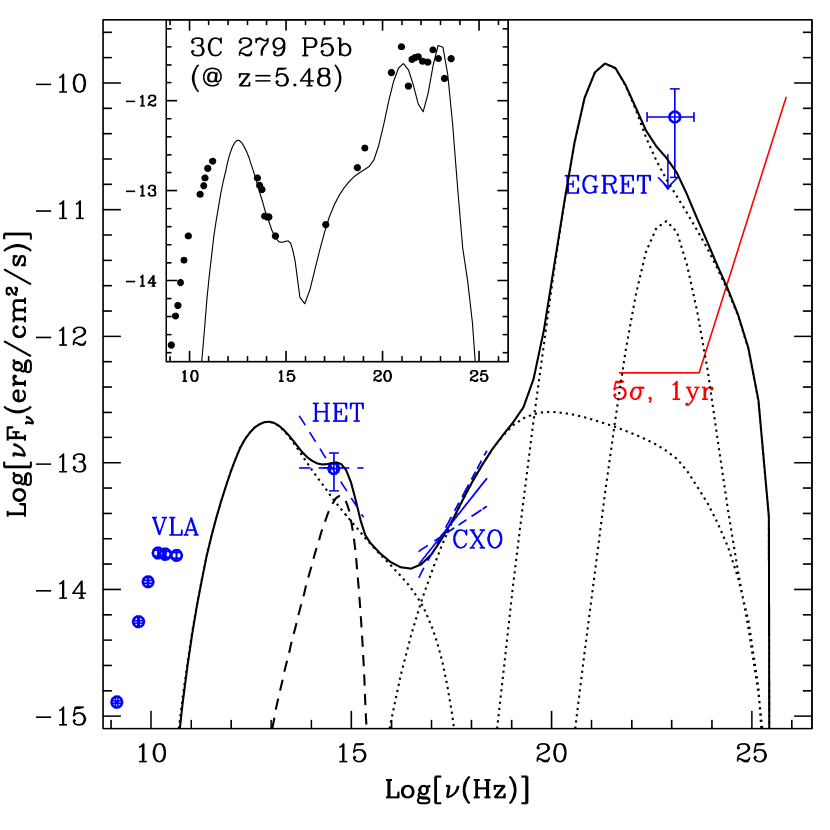
We have assembled these new flux measurements into a (non-instantaneous) spectral energy distribution (SED), figure 3. The plot shows the 04/03/05 simultaneous radio fluxes. We do not see any strong evidence of radio variability, but it should be noted that the X-ray flux (shown with a dashed lines for the continuum uncertainty range) was observed d later. The optical spectroscopy measurements span several years, although again we do not see variability. With a rather small range of unabsorbed continuum available, the optical spectral index is quite uncertain (dashed lines, extended a a decade for visibility). This situation would be greatly helped by near-IR spectroscopy. Finally, the EGRET upper limit is, of course, from 10-15 years prior to the current observations, and blazars are known to be highly variable in the -ray band. The low significance detection during one viewing period (Romani et al., 2004) should be seen as consistent with the mission-averaged upper limit.
As in Romani et al. (2004) we compare the new SED with that of the well-studied EGRET blazar 3C 279 [inset: SED from period P5b (Hartman et al., 2001), red-shifted to z=5.48], and with synchro-Compton models. The Q0906+6930 spectrum is sparse, but notably shows a significantly () more luminous optical spectrum. In contrast to 3C 279 the optical emission shows high equivalent-width lines from the broad-line region (BLR), and is thus not dominated by synchrotron continuum. For the Compton components of the SED, our new X-ray detection confirms a rising spectrum, likely up-scattered by the synchrotron-emitting electrons. This is somewhat (%) fainter than the 3C 279 X-ray luminosity, which is reasonable in light of the lower radio synchrotron luminosity. However, the possible GeV detection would require an external Compton component brighter than that of 3C 279.
By computing representative synchro-Compton models, we see that the brighter disk emission and a luminous -ray Compton component may be related. In the inset we show a model for 3C 279 computed from a code kindly supplied by M. Böttcher. This code computes synchrotron and Compton emission in an evolving cylindrical jet outflow. It also models a host accretion disk and computes the Comptonized flux from these soft disk photons, both directly from the disk and disk photons scattered from the broad line region. The code is described in Böttcher, et al. (1997) and Böttcher & Bloom (2000). To generate the 3C 279 model, we use explicitly the parameters listed in Hartman et al. (2001) for this epoch. The ‘jet’ is a cm radius blob injected 0.025 pc from the hole, moving cylindrically at to the line of sight with bulk . The jet contains 35 each of , with a power-law energy distribution of index , extending from to and 1.5 G of magnetic field. The hole is surrounded by an accretion disk of luminosity and a broad-line region extending from 0.1-0.4 pc. To reproduce the model shown in (Hartman et al., 2001), it was necessary to increase the BLR Thomson depth to . These parameters gave the total SED curve shown in the inset.
We know that Q0906+6930 has a higher mass hole () and a brighter accretion disk (). We made these two changes to the parameters and re-computed the SED, as shown in the main part of Figure 3. Under the full SED we show the individual components: (from low to high frequency) the jet synchrotron emission, the disk thermal emission, the jet self-Compton emission, the external Compton emission from the disk and the Comptonized emission from disk photons scattered off the broad-line region. The spectra were computed at and then the 3C 279 data and the two models were red-shifted to z=5.48 using concordance flat cosmology parameters. These models illustrate that with a higher mass hole and a brighter, cooler disk, brighter external Compton (-ray) emission can be expected. Of course, such models have many parameters and fits to more densely sampled SEDs in a variety of flare states are needed for any predictive power.
A standard definition of radio-loudness is the ratio (Kellerman et al., 1989). Although we do not have direct observations at MHz or , we can extrapolate the observed optical and radio spectra to estimate where the range is due to the rather uncertain optical continuum spectrum.
We should note that both the 3C 279 and the Q0906+6930 models safely under-predict the radio spectrum. This is because the model simulates only the base of the jet emission, omitting larger scales where cooling, expansion and injection of additional populations produce the cm-wavelength radio components. In particular, the local maximum in the Q0906+6930 radio spectrum at GHz (GHz rest-frame) suggests a distinct radio jet component. It should be noted that the 43 GHz flux measured here (on kpc scales) is in good agreement with the VLBA core measurement. Thus at most 10% percent of the radio flux lies in the pc resolved VLBA jet and the cm-wavelength radio component is produced at sub-pc scales in the unresolved VLBA core. It would be useful to check if the SED rises toward a synchrotron peak in the far-IR/sub-mm region as expected. IR photometry of the blazar will also be helpful in constraining the level of the synchrotron SED and confirming the dominance of disk emission in the optical.
4 Conclusions
The new data generally confirm the SED picture described in Romani et al. (2004) and show that at least the X-ray Compton component is present in this blazar. The lack of any resolved kpc-scale jet component suggests that all emission observed is from the core (or a compact pc-scale jet). Also, this does not support the Schwartz (2002) picture where large-scale X-ray jets are produced by up-scatter of the CMB. In this model, the increase of the CMB energy density counters the decreasing jet surface brightness; at jet emission is thus expected to exceed core emission. With % of the core X-ray flux in a resolvable jets, our results extend those of Lopez et al. (2006), suggesting core photons, rather than CMB photons dominate the flux up-scattered as Compton X-ray emission.
One peculiarity noted in Romani et al. (2004) was the relatively large optical and radio flux; we noted the possibility of lensing of the QSO core. This should be re-visited, since the strong intervening metal line absorbers suggest galactic-scale masses along the line-of-sight. The most important is the MgII system at z=1.849, which at Å, likely represents a classical spiral galaxy (Churchill et al., 2005) which should be a Lyman Limit System (LSS) absorber, within an impact parameter
for an galaxy at the absorber redshift, i.e. within for our assumed cosmology. Our limited direct imaging does not detect such a galaxy, but the results are not very constraining. At this , the cosmic age is Gyr and an Sa formed at z=5 in our cosmology would have for a Bruzual & Charlot (1993) model, i.e. about fainter than our imaging limit. Sbc types would be even fainter.
Can such a galaxy lens our blazar? The expected image angular scale for a lens mass is
where one uses angular diameter distances and . The geometry is favorable for lensing and the lens scale is then arcsec with in . We see no evidence for a double image of the blazar on arcsecond scales, either in the optical or the radio, so this precludes classical macro lensing by an galaxy. Indeed, the core is unresolved in our VLBI maps, where the half-power beam width at 43 GHz was 0.55 mas, so we can place an upper limit on an effective lens mass of . The lack of obvious variability on year time-scales suggests a not very constraining lower mass limit of for a lens galaxy velocity dispersion of km/s. We may infer a slightly tighter limit if we note that the large BLR equivalent widths imply that the broad line region must be lensed along with the core. Naively applying the continuum BLR radius correlation of Kaspi et al. (2005) to our optical continuum luminosity we conclude
This in turn implies a minimum lens mass . We infer that macro-lensing does not amplify Q0906+6930, but that micro- or milli-lensing are possible. On the other hand, it should be noted that the probability of an unrelated intervening galaxy is not small. Since over the redshift range covered by our G3 spectrum (Nestor et al., 2005), we expect 0.06 such absorbers. Detection of one MgII systems is thus not very improbable and so we cannot infer from this that lensing amplification has brightened Q0906+6930.
We conclude by re-iterating that our new SED measurements support the picture of Q0906+6930 as a blazar with a bright -ray Compton component emitting at z=5.48. This Compton radiation must traverse the peak of star formation at , where optical/UV emission can attenuate the 10 GeV photons, just as the IR background can attenuate the TeV emission of blazars at lower , e.g. Dwek, Krennrich & Arendt (2005) and references therein. Of course, there is also attenuation from the host photon field and, in principle, from the intervening z=1.89 galaxy. These contributions will make it difficult to extract constraints on the extragalactic background photon field from this (or any one) object. However, statistical studies of high red-shift blazars with GLAST (Chen, Reyes & Ritz, 2004), should still be able to extract global constraints on the extragalactic background light and its evolution.
References
- Böttcher, et al. (1997) Böttcher, M., Mause, H. & Schlickeiser, R. 1997, A&A, 324, 39, A&A, 324, 395
- Böttcher & Bloom (2000) Böttcher, M., & Bloom, S.D. 2000, AJ, 119, 469.
- Bruzual & Charlot (1993) Bruzual, G. & Charlot, S. 1993, ApJ, 405, 538.
- Chen, Reyes & Ritz (2004) Chen, A., Reyes, L. & Ritz, S. 2004, ApJ, 608, 686
- Cheung (2004) Cheung, C.C. 2004, ApJ, 600, L23
- Churchill et al. (2005) Churchill, C.W., Kacprzak, G.C. & Steidel, C. C. 2005, Proc. IAU, 1, 24; astro-ph/0504392
- Dwek, Krennrich & Arendt (2005) Dwek, E., Krennrich, F. & Arendt, R.G. 2005, ApJ, 634, 155
- Hartman et al. (2001) Hartman, R.C. et al. 2001, ApJ, 553, 683
- Hill et al. (1998) Hill, G.J. et al. 1998, Proc. SPIE, 3355, 375
- Kaspi et al. (2005) Kaspi, S. et al. 2005, ApJ, 629, 1
- Kellerman et al. (1989) Kellerman, K.I. et al. 1989, AJ, 98, 1195
- Lopez et al. (2006) Lopez, L.S. et al. 2006, AJ, 131, 1914
- Nestor et al. (2005) Nestor, D.B. et al 2005, ApJ 628, 637
- Ramsey et al. (1998) Ramsey, L.W. et al 1998, Proc. SPIE, 3355, 34
- Romani et al. (2004) Romani, R.W. et al 2004, ApJ 610, L9
- Schwartz (2002) Schwartz, D.A. 2002, ApJ, L23
- Siemiginowska et al. (2003) Siemiginowska, A. et al 2003, ApJ, 598, 15
- Sowards-Emmerd, et al. (2004) Sowards-Emmerd, D., Romani, R. W., Michelson, P. F. & Ulvestad, J. 2004, ApJ, 609, 564.
- Sowards-Emmerd, et al. (2005) Sowards-Emmerd, D., Romani, R. W., Michelson, P. F., Healey, S.E. & Nolan, P. 2005, ApJ, 626, 95.
- Sowards-Emmerd, Romani & Michelson (2003) Sowards-Emmerd, D., Romani, R. W., & Michelson, P. F. 2003, ApJ, 590, 109
- Spergel, at al. (2006) Spergel, D. et al 2006, ApJ, in press; astro-ph/0603449
- Vestergaard (2002) Vestergaard, M. 2002, ApJ, 571, 733