A Survey for Redshifted Molecular and Atomic Absorption Lines
I. The Parkes Half-Jansky Flat-Spectrum Red Quasar Sample
Abstract
We are currently undertaking a large survey for redshifted atomic and molecular absorption lines at radio frequencies. In this paper we present the results from the first phase of this: the search for H i 21-cm and OH 18-cm absorption lines in the hosts of reddened quasars and radio galaxies. Although we observed each source for up to several hours with two of the world’s most sensitive radio telescopes, the Giant Metrewave Radio Telescope (GMRT) and Westerbork Synthesis Radio Telescope (WSRT), only one clear and one tentative detection were obtained: H i absorption at in PKS 1555–140 and OH absorption at in PKS 2300–189, respectively, with the Australia Telescope Compact Array (ATCA). For the latter, no H i absorption was detected at the same redshift as the borderline OH detection. In order to determine why no clear molecular absorption was detected in any of the 13 sources searched, we investigate the properties of the five redshifted systems currently known to exhibit OH absorption. In four of these, molecules were first detected via millimetre-wave transitions and the flat radio spectra indicate compact background continuum sources, which may suggest a high degree of coverage of the background source by the molecular clouds in the absorber. Furthermore, for these systems we find a relationship between the molecular line strength and red optical–near infrared () colours, thus supporting the notion that the reddening of these sources is due to dust, which provides an environment conducive to the formation of molecules. Upon comparison with the colours of our sample, this relationship suggests that, presuming the reddening occurs at the host galaxy redshift at least in some of the targets, many of our observations still fall short of the sensitivity required to detect OH absorption, although a confirmation of the “detection” of OH in 2300–189 could contravene this.
keywords:
radio lines: galaxies – quasars: absorption lines – cosmology: observations – cosmology: early Universe – galaxies: abundances – galaxies: high redshift1 Introduction
Unlike optical spectral lines, the H i 21-cm spin-flip transition of neutral hydrogen and molecular rotational transitions are transparent to interstellar dust, thus providing very useful probes of the early Universe. For example, these can be used to:
-
1.
Investigate neutral gas at high redshift allowing a measure of the baryonic content of the early Universe, when neutral gas outweighed the stars: At low redshift, most of the gas has been consumed by star formation and H i represents only a small fraction of the total mass in baryons. Conditions were very different at high redshift and quasar absorption line studies have demonstrated that the co-moving density of H i is many times higher at (e.g. Péroux et al. 2001).
-
2.
Probe the evolution of large-scale structure. In the most successful models, massive galaxies build up through merging and accretion. This process is most vigorous at high redshift where interactions occur more frequently. H i observations are a powerful probe of the dynamics of these mergers, and thus constitute a basic test of theories of galaxy formation and evolution.
-
3.
High redshift observations of H i can give a lower limit to the epoch of reionisation, when neutral hydrogen collapsed to form the first structures (stars, galaxies/quasars), the upper limit of which is constrained by Cosmic Microwave Background (CMB) measurements (e.g. Griffiths et al. 1999).
-
4.
The relative populations of molecular rotational transitions can measure density and temperature at high redshift, thus providing a probe of the CMB and the abundance of cold star forming gas in the early Universe.
-
5.
Monitoring absorbers which act as gravitational lenses can yield time delay studies giving measurements of the Hubble parameter (e.g. Wiklind & Combes 2001).
-
6.
Various combinations of H i, OH and millimetre rotational lines can give accurate measurements of several fundamental constants; the electron–proton mass ratio the proton g-factor and the fine structure constant (see Curran, Kanekar & Darling 2004 and references therein). These can provide at least an order of magnitude increase in accuracy over the current optical results, which may suggest that fine structure constant has undergone cosmological evolution (Murphy, Webb & Flambaum 2003, although see Srianand et al. 2004).
Unfortunately, redshifted radio absorption systems are currently very rare, with only 50 H i absorption systems known for redshifts of (summarised in Table 3). Five of these systems also exhibit OH absorption, four of which constitute the only known redshifted millimetre absorption systems (see Table 4). In addition to these, molecular absorption has also been detected in 10 known optical absorbers through vibrational transitions redshifted into the optical band at (see Reimers et al. 2003; Cui et al. 2005). These occur in damped Lyman-alpha absorption systems (DLAs), which have high neutral hydrogen column densities ( cm-2) known to exist at precisely determined redshifts.
However, extensive millimetre-wave observations of DLAs have yet to detect absorption from any rotational molecular transition (Curran et al., 2004a), leading us to suspect that using optically-selected objects selects against dusty environments, which are more likely to harbour molecules in abundance. This is apparent when one compares the DLAs in which H2 has been detected, which have molecular fractions (see Curran et al. 2004b and references therein) and colours of (typical for optically-bright quasars) with the five known OH absorbers; (using , see Combes & Wiklind 1998; Kanekar & Chengalur 2002; Kanekar et al. 2005) and (Fig. 1). This indicates substantial reddening of the quasar light in these cases, possibly by the absorber,
which is either intrinsic to the source (in the cases of 1504+377 and 1413+135) or due to the lensing galaxy (for 0132–097, 0218+357 and 1830–211). We have therefore commenced a survey for redshifted atomic and molecular absorption lines towards reddened objects. In this paper we present the results of the first phase of this survey: searching for H i and OH lines due to cold dense dust residing in the hosts of quasars and radio galaxies.
2 Observations
| Source | Line | Tel. | Ref | Notes | |||||||||
|---|---|---|---|---|---|---|---|---|---|---|---|---|---|
| 0003066 | 0.347 | OH | 1244 | – | – | – | – | ATCA | 14.12 | 3.69 | 3.85 | 1,2 | |
| 0108388 | 0.66847 | OH | 996–1003 | 2.9 | 19 | 0.20 | GMRT | 16.69 | 5.31 | – | 3,4 | ||
| 0114074∗ | 0.342 | OH | 1239–1246 | 12 | 15 | 2.90 | GMRT | 15.39 | – | 5.25 | 1,2 | ||
| 0131001 | 0.879 | H i | 756 | 19 | – | – | – | WSRT | 16.78 | 4.00 | 5.72 | 5 | |
| … | … | OH | 880–897 | 6.2 | 6.6 | 0.94 | WSRT | … | … | … | … | ||
| 0153410∗ | 0.226 | OH | 1353–1378 | 34 | 28 | 1.87 | ATCA | 14.14 | 3.27 | 4.01 | 5 | ||
| 0202149 | 0.405 | OH | 1183–1190 | 5.0 | 15 | 2.20 | GMRT | 16.51 | 4.13 | 5.82 | 6 | ||
| 0454066 | 0.405 | H i | 1007–1012 | – | 18 | – | – | GMRT | 14.424 | 3.669 | 4.318 | 7 | |
| 0500019 | 0.58457 | OH | 1049–1056 | 7.4 | 18 | 1.75 | GMRT | 15.430 | 5.252 | 5.916 | 1,6 | ||
| 1107187 | 0.497 | H i | 948.8 | – | – | – | – | GMRT | 15.96 | 3.34 | 5.14 | 5 | |
| .. | … | OH | 1110–1117 | 2.4 | 17 | 0.63 | … | … | … | … | … | … | |
| 1353341∗ | 0.2227 | OH | 1358–1384 | 9.7 | 27 | 0.57 | ATCA | 13.62 | 3.12 | 3.84 | 5 | ||
| 1355441 | 0.6451 | OH | 1010–1017 | 1.9 | 18 | 0.65 | GMRT | – | 2,8 | ||||
| 1450338 | 0.368 | H i | 1035–1042 | 10 | 18 | 1.49 | GMRT | 15.23 | 4.16 | 5.17 | 5 | ||
| … | … | OH | 1212–1238 | 9.3 | 31 | 1.07 | ATCA | … | … | … | … | ||
| 1535004 | 3.497 | H i | 315.0–316.6 | 7.3 | 15 | 0.36 | GMRT | 19.54 | – | 1,5 | |||
| … | … | OH | 1053–1060 | 6.1 | 18 | 0.57 | GMRT | … | … | … | … | ||
| 1555140∗ | 0.097 | H i | 1289–1312 | 3.7 | 29 | 0.31 | 0.031 | ATCA | 13.08 | 3.20 | 3.85 | 5 | |
| 2300189∗ | 0.129 | H i | 1255–1277 | 12 | 30 | 1.21 | ATCA | 13.05 | 3.51 | 3.88 | 1 | ||
| .. | … | OH | 1470–1496 | 7.2 | 25 | 1.04 | ATCA | … | … | … | … | ||
| 2337334 | 1.802 | OH | 593–597 | 9.2 | 16 | 2.61 | GMRT | 16.39 | 5.01 | 5.50 | 5 |
Photometry references: (1) Francis [priv. comm.], (2) Hambly et al. (2001), (3) Stickel et al. (1996), (4) Stanghellini et al. (1993), (5) Francis et al. (2000), (6) This paper [see Sect. 2.1], (7) Whiting (2000), (8) 2MASS.
Notes: a estimated using , the mean value for a PHFS quasar, and the mean value for a PHFS radio galaxy, bRFI in some channels required splicing of the observed band, cRFI prevents a confident limit, dRFI so severe that fringes could not be obtained for the bandpass calibrator.
Details of our targets are given in Table 1. For the most part they have been selected from the Parkes Half-Jansky Flat-spectrum Sample (PHFS, Drinkwater et al. 1997) on the basis of their optical–near-IR photometry. The nature of the PHFS (bright, generally compact radio sources), together with the excellent optical information (Francis et al., 2000) and the near completeness of the sample, makes it an ideal data base from which to select sources. Our targets are amongst the reddest objects in the PHFS, and many have colours believed to be due to dust extinction (Webster et al., 1995). Note that in addition to the PHFS sources, we include 0108+388, 0500+019 and 1355+441 in the search for OH absorption, since these are reddened (or at least optically faint) quasars already known to exhibit Hi absorption at the host redshift (see Table 2 for details).
2.1 Optical/Near-Infrared photometry
As stated above, the key requirement in our object selection is a red optical–near-infrared colour, and we have therefore selected objects with . Our selection is of course subject to the frequency ranges accessible by the radio telescopes used in our survey and so not all of the PHFS sources with are included.
In addition to the colour requirement, in order to broaden our sample, we also select several radio galaxies from the PHFS whose optical spectra (Drinkwater et al., 1997) exhibit a lack of broad lines such as H: These “type-2” objects may have the line-of-sight to their nuclear regions obscured by the putative “dusty torus” (Antonucci, 1993), thus providing a reservoir of molecular gas. Since their integrated photometry is dominated by starlight, the optical–near-infrared colours of these objects show colours typical of elliptical galaxies. The radio galaxies searched are indicated in Table 1.
In the table we also give the -magnitude (m) and two estimates of colour; and . Most of these sources are part of the large dataset of Francis et al. (2000), which provides all of the necessary optical and near-infrared photometry. A further four sources use photometry from the Anglo-Australian Telescope’s IRIS instrument, taken during the compilation of the PHFS (Francis, priv. comm.). For these sources, the magnitude is estimated from the PHFS magnitude by assuming (for 0003066) and (for 0114074 & 2300189), see Table 1. The magnitudes for these sources were taken from the SuperCOSMOS Sky Survey (Hambly et al., 2001). Both the optical and near-infrared photometry for 0454066 was taken from Whiting (2000).
Two sources (0202149 & 0500019) were observed in the optical (and the near-infrared in the case of 0202149) at the ANU 2.3-metre telescope over two runs, in August 2004 and April 2005, respectively, at the same time as other projects. The data were reduced with standard techniques (the method was very similar to that described in Francis et al. 2000). Optical photometry in bands was obtained with reference to Landolt standard fields (Landolt, 1992), using the IRAF photcal package, while the near-IR photometry was referenced to IRIS standards (McGregor et al., 1994).
Finally, both 0108388 and 1355441 are too far north to be observed from Siding Spring. For 0108388 we use photometry of Stickel et al. (1996) [-band] and Stanghellini et al. (1993) [-band]111There is no published -band measurement and it is too faint to appear on SuperCOSMOS. 1355441 is marginally detected on SuperCOSMOS at -band, but not detected in 2MASS, so we quote the upper limit to in Table 1.
2.2 ATCA observations
As seen from Table 1, the ATCA sources are generally not as red as the rest of the sample, with for four of the five sources. As mentioned previously, the sources selected ultimately came down to the radio band available at the telescope and so it was not always possible to select sources based purely on their colour. We therefore included these moderately red sources which could be observed with the ATCA, since most of them are radio galaxies (Sect. 2.1) and they may prove useful in comparing any established connection between the H i, OH abundances and the degree of reddening of the source.
The observations were performed over 2 nights in July 2004. We used the H168 array,
giving a maximum baseline of 4469 metres. For the front-end we used
the H–OH receiver (1.25 to 1.78 GHz) backed by the FULL_32_256
correlator configuration, giving 32 MHz over 256 channels, or a
coverage of 6500–8000 at a channel width of for the frequencies observed. For each source we tuned to the host
redshift offset by MHz in order to cover a larger
blueshift range with respect to the source, where foreground
absorption in the host may be expected. For bandpass and flux
calibration we used both PKS 0023–26 and PKS 1934–63, with self
calibration used for the antenna gains in all cases except PKS 0153–410 and
PKS 2300–189, for which we used PKS 0201–440 and PKS 2252–089,
respectively. As with the other radio data, these were reduced using the miriad interferometry reduction package, with which we extracted a
summed spectrum from the emission region of the continuum maps
(Fig. 2) and all of the
sources were unresolved by the synthesised beam.
Specifically for each source:
0003–066 was observed
for 3 hours, although due to severe RFI in the bandpass calibrator at
1247 MHz, the band was heavily split and no image could be
produced.
0153–410 was observed for 0.6 hours and only flagging of
some edge channels was required.
1353–341 was observed for 1.0 hour,
and again, only flagging of some edge channels was required. Although
the dip apparent towards the upper end of the band
(Fig. 2) appears in both polarisations (albeit
unequally), the feature appears only in a single antenna pair
(CA01–CA05) and so we consider this to be an artifact.
1450–338 was observed for 1.0 hour and severe RFI rendered all
antenna pairs, except those with the km distant CA06 antenna, unusable.
For the remaining 5 antenna pairs, the data were excellent with no
flagging required, although it was not possible to produce an image with
these limited data.
1555–140 was observed for 3 hours and no major flagging
of data was required. Even before extracting a spectrum from the cube
(as shown in Fig. 2), the absorption line was
apparent in both polarisations upon the averaging of the visibilities.
1.5 hours were spent searching for H i at the redshift of 2300–189. However
0.5 hours of bad data had to be removed from the beginning of the observations
for all antenna pairs not involving CA06. In addition to this, baseline CA02–CA03
had to be removed. For OH, we observed for 6.5 hours on source and no major flagging of data was required.
2.3 GMRT observations
The GMRT observations were performed in March & April 2004 and
February 2005. For all runs we used all 30 antennas and the 21-cm &
50-cm receivers over 8 & 4 MHz bandwidths, respectively. This gave a
band of 62 kHz for the low redshift (21-cm band) sources and 31 kHz
for the high redshift (50-cm band) sources in each of the 128 channels
(2 polarisations). Like the ATCA observations, this resulted in a
fairly poor velocity resolution (Table 1), although this was
necessary in order to cover any possible offsets between the
absorption and the host redshifts ( ,
Vermeulen et al. 2003), as well as the large H i ( ) and OH
( ) line-widths observed in the known systems. Again,
all of the sources were unresolved by the synthesised beam, which was
typically for these observations. For all of the runs we
used 3C48, 3C147 and 3C286 for bandpass calibration and used separate
phase calibrators for all of the sources, as heavy flagging of the
target data could result in poor self calibration. In general,
however, RFI was not too severe with only two sources being completely
lost (see below). For all runs we noted a spike in channel
117 of the RR polarisation and this was removed along with the
telescope pairing between antennas E02 and E03 (15 and 16 in aips/miriad convention), which was invariably bad. In particular for each source:
0108+388 was observed for a total of
3.6 hours, with 330 good antenna pairs remaining after removing
the non-functioning antennas.
0114+074 was observed for 4.1 hours, however, due to RFI,
only 340 antenna pairs were used and the last 2 hours of the observation
had to be removed.
0202+149 was observed for 6.7 hours and minimal RFI allowed
us to retain 400 good antenna pairs.
Close to 1011 MHz, where 0454+066 was observed, RFI was so severe
that no reliable calibration could be obtained.
0500+019 was observed for 1.0 hour and minimal RFI allowed
us to retain 330 good antenna pairs.
1107–187 was observed at MHz, in the search for OH, for 6.9 hours with 400 good antenna
pairs being retained. The H i transition fell into the same mobile phone band
which marred other observations in this band (see Sect. 3.2.2),
thus preventing even good data for the bandpass calibrator.
1355+441 was observed for 5.5 hours and 420 good antenna pairs were
retained.
1450–388 was observed for 0.9 hours with 360 good antenna
pairs. However, due to poor gains, the first 35 minutes of the
observations had to be removed.
In the 90-cm band 1535+004 was observed for 1.4 hours and 390 good antenna
pairs were retained. Since the OH (4751 MHz) transition
at the redshift of this source fell into the 20-cm band of the GMRT, we also observed this for 3.1 hours with the 360 good antenna pairs available.
2337–334 was observed for 3.8 hours and after flagging 300 antenna pairs were
retained.
2.4 WSRT observations
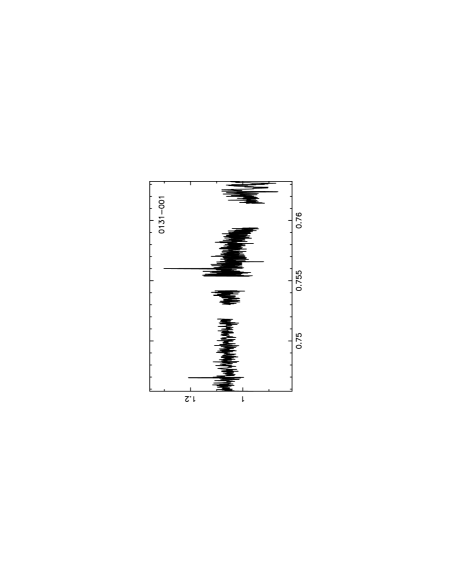
PKS 0131–001 was observed with the WSRT during a survey for radio absorption lines in gravitational lenses (Sect. 3.2.2), using all 14 antennas and the UHF-high band receiver with 20 MHz bandwidth over 1024 channels in both polarisations. H i was searched for at a frequency of 756 MHz () over hour slots on 23rd–24th November 2004. Due to severe RFI from a German TV station, this frequency was reobserved for 4 hours in hour slots on 19th February 2005. Again some RFI was present, particularly in one of the polarisations (XX), which was subsequently removed. As per the other sources observed, we also flagged channels 900–1024 ( MHz here). After flagging the worst frequencies (751.9–753.1 MHz, 754.3–755.4 MHz and 759.5–761.5 MHz), the baselines in which the r.m.s. exceeded 1 Jy (% of the baselines) were also flagged. However, as seen from the oscillations around the flagged interference at MHz, the effects of RFI are still present and since the expected absorption frequency of MHz is coincident with these, we cannot assign confident limits to the H i optical depth.
OH 18-cm was searched for at a frequency of 887 MHz over hour slots on 17th November 2005. Although the RFI was not as bad as at the lower frequency, five of these slots had to be removed, as well as at least 10 channels to either side of 885.1 MHz in all of the data. Unfortunately, the low declination of the source coupled with the fact that the WSRT is an E–W array, meant that the u–v coverage was insufficient to produce any images. Therefore the limits quoted for 0131-001 in Tables 1 and 2 are from the averaged visibilities.
3 Results and Discussion
3.1 Observational results


In Table 2 we summarise the results of this phase of the survey. The column densities over the searched redshift ranges are derived from the integrated optical depths measured from the spectra. For H i 21-cm this is obtained from
| (1) |
where is the spin temperature of the gas (K). For OH in thermal equilibrium the column density is given by
| (2) |
where is the excitation temperature and , 2.38 and 4.30 for the 4751, 1667 and 1665 MHz lines, respectively. In both equations, is the covering factor of the background continuum flux by the absorber and is the integrated optical depth of the line (), where in the optically thin () regime.
| Source | Transition | -range | [] | Comments | |
|---|---|---|---|---|---|
| 0108388 | 0.66847 | OH | 0.6624–0.6741 | at a | |
| 0114074 | 0.342 | OH | 0.3382–0.3457 | ||
| 0131001 | 0.879 | OH | 0.8588–0.8947 | No coverage over due to RFI | |
| 0153410 | 0.226 | OH | 0.2099–0.2323 | ||
| 0202149 | 0.405 | OH | 0.4011–0.4094 | ||
| 0500019 | 0.58457 | OH | 0.5789–0.5902 | at a | |
| 1107187 | 0.497 | OH | 0.4927–0.5021 | ||
| 1353341 | 0.2227 | OH | 0.2047–0.2278 | ||
| 1355441 | 0.6451 | OH | 0.6395–0.6509 | at b | |
| 1450338 | 0.368 | H i | 0.3632–0.3710 | ||
| … | … | OH | 0.3468–0.3757 | ||
| 1535004 | 3.497 | H i | 3.4864–3.5092 | ||
| … | … | OH | 3.4818–3.5115 | ||
| 1555140 | 0.097 | H i | 0.0971 | ||
| 2300189 | 0.129 | H i | 0.1123–0.1318 | ||
| .. | … | OH | 0.1145–0.1343 | at c? | |
| 2337334 | 1.802 | OH | 1.7929–1.8117 |
3.1.1 H i absorption in a radio galaxy at

In Fig. 3 we show the one clear detection obtained during this leg of the survey, that of H i in the radio galaxy PKS 1555140. The velocity integrated optical depth of the line, , gives an atomic hydrogen column density of which is at the upper end of the range of the known redshifted 21-cm absorbers (Table 3) and for the canonical K, this implies a neutral hydrogen column density in excess of . The central peak in the absorption profile occurs at a redshift of , where the uncertainty quoted is a single channel width. This compares well with the redshift of for this galaxy. We have recently undertaken optical observations of this radio galaxy and some of the several smaller galaxies surrounding it, in order to further study this interacting system. Our results will be presented in Whiting et al. (2006, in prep.).
3.1.2 Possible OH absorption in a radio galaxy at
In the GHz spectrum of 2300–189 (Fig. 2) there are two troughs that appear to be separated by MHz, as would be expected from the Lambda-doubled lines of OH in the ground state. The statistical significance of these lines is marginal, although their peaks are the only points at away from the first-order baseline fit indicated in the figure222Note that here mJy, which is calculated from the baseline-subtracted spectrum (Fig. 4). Thus, unlike the value quoted in Table 1, it does not include the large-scale gradient seen in the spectrum in Fig. 2.. A one-sample runs test shows that there are significant deviations (at the 99.5% level) from randomness in the baseline-subtracted spectrum, and if one breaks the spectrum into four quarters, the only part that shows significant deviations is the quarter containing these two putative lines (then at the 99% level).
From Gaussian fits to the spectrum (Fig. 4),

we find that the two features occur at and MHz. If these are due to absorption by OH in the ground state, then the lower frequency gives a redshift of for the 1665 MHz line and the higher frequency for the 1667 MHz line. These are in excellent agreement and suggest foreground molecular absorption at an offset of from the background radio source.
From the Gaussian fits, we calculate integrated optical depths of and for the 1665 and 1667 MHz lines, respectively. These give total OH column densities of and , respectively, thus being consistent with the ratio of line strengths expected for OH in thermal equilibrium. We also searched for H i in this source (Fig. 2), and although there may be a feature at MHz (corresponding to , the redshift of the galaxy), no H i absorption was detected to a limit of per channel at (1261 MHz).
The width of the 1667 MHz line is a typical (Chengalur et al., 1999; Kanekar & Chengalur, 2002) . If we assume that the H i has the same width, the limit becomes for data “smoothed” to a single channel. This gives a ratio of . Clearly, however, such a weak “detection” requires confirmation before we can confidently speculate on the molecular fraction and other related properties.
3.1.3 H i and OH limits
Apart from the detection in 1555140, useful H i data were obtained for a further three sources, all of which reach limits of (Table 2), comparable with many of the detections (Table 3). Of these, Vermeulen et al. (2003) found H i in the hosts of 19 of the 57 sources for which useful data were obtained in a survey of redshifted compact radio sources. A detection rate of for H i in near-by active galactic nuclei (AGN) was also found by van Gorkom et al. (1989), perhaps due to cold gas being located in the dusty environment encircling the nucleus (see Morganti et al. 2001 and Sect. 2.1).
Carilli et al. (1998) also searched for H i absorption, in the hosts of reddened quasars, and obtained a detection rate of , cf. for Mg ii-selected objects (generally low redshift DLAs, e.g. Rao & Turnshek 2000). However, the red quasars consist of a sample of just five and the detection rate in the Mg ii-selected objects is based upon the number of systems expected to have cm-2 in optically selected samples. For DLAs occulting radio-loud background continua, the detection rate of H i 21-cm is % for the published sources (see Curran et al. 2005), most of which were originally identified through the Mg ii lines (Curran & Webb, 2006a). These have neutral hydrogen column densities in the range of , whereas the red quasars of Carilli et al. (1998) have values of , a range of higher values which nevertheless overlaps considerably with that of the DLAs. In this work we have searched two of the Carilli et al. sources (0108+388 & 0500+019) for OH absorption (discussed in Sect. 3.2). The remaining H i detections were towards 0218+357 and 1504+377, two of the currently known molecular absorbers (Sect. 3.2.2).
In order to investigate any possible correlation of hydrogen column density with reddening, in Fig. 5 we show the scaled velocity integrated optical depth of the H i line333 which gives . versus the optical–near-IR colour for our targets together with the previous detections of associated H i absorption (Table 3).
From this we see a slight trend for the H i line strength to increase with colour, although the spread is broad, particularly at large colours. Also, one of our targets has , yet H i remains undetected in the host at .
| Reference | Type | No. | [] | |
| ASSOCIATED ABSORBERS | ||||
| Uson et al. (1991) | RG | 1 | 3.40 | |
| Carilli et al. (1992) | Red | 1 | 0.25 | |
| Carilli et al. (1998) | Red | 3 | 0.58–0.67 | |
| Moore et al. (1999) | Lens | 1 | 2.63 | |
| Ishwara-Chandra et al. (2003) | CSS/Red | 1 | 1.19 | |
| Vermeulen et al. (2003) | BLRG | 1 | 0.22 | |
| … | CSS | 7 | 0.19–0.80 | |
| … | GPS | 10 | 0.08–0.65 | |
| … | RG | 1 | 0.24 | |
| Pihlström et al. (2005) | OHM | 1 | 0.22 | |
| This paper | RG | 1 | 0.10 | |
| INTERMEDIATE ABSORBERS | ||||
| Carilli et al. (1993) | Lens | 1 | 0.69 | |
| Lovell et al. (1996)∗ | Lens | 1 | 0.19 | |
| Chengalur et al. (1999) | Lens | 1 | 0.89 | |
| Kanekar & Briggs (2003) | Lens | 1 | 0.76 | |
| Kanekar & Chengalur (2003)† | DLA | 15 | 0.09–2.04 | |
| Darling et al. (2004) | DLA | 1 | 0.78 | |
| Kanekar et al. (2006) | DLA | 1 | 2.347 | |
| Zwaan et al. (in prep.) | DLA | 2 | – | |
3.2 Comparison with known redshifted OH absorbers
3.2.1 Colours
| Source | [] | Ref. | [] | Ref. | Ref. | |||
|---|---|---|---|---|---|---|---|---|
| 0218357 | 0.68466 | 0.94 | 1 | 6,7 | 6.167 | 9,10 | ||
| 1413135 | 0.24671 | 0.247 | 2 | 6 | 5.072 | 11,10 | ||
| 1504377 | 0.67335 | 0.673 | 3 | 6 | 5.348 | 12,13 | ||
| 1830211 | 0.88582 | 2.507 | 4 | 4 | 6.246 | 9,10 | ||
| 0132097 | 0.764 | 2.2 | 5 | 0.35 to | 8 | 8.92 | 14 |
References: (1) Carilli et al. (1993), (2) Carilli et al. (1992), (3) Carilli et al. (1998), (4) Chengalur et al. (1999), (5) Kanekar & Briggs (2003), (6) Kanekar & Chengalur (2002), (7) Kanekar et al. (2003), (8) Kanekar et al. (2005), (9) Hambly et al. (2001), (10) 2MASS, (11) Hewitt & Burbidge (1989), (12) SDSS, Adelman-McCarthy et al. (2006), (13) Stickel et al. (1996), (14) Gregg et al. (2002).
The objective of our sample selection was to choose sources with large optical–near-infrared colours, which could possibly be attributed to an abundance of dust, and thence molecules, along the line-of-sight. In Fig. 6 we plot the scaled velocity integrated optical depth444 (1.61 for 1535004) giving . as a function of the colour for our observations and the five known OH absorbers. In addition, we include 0758+143 from Ishwara-Chandra et al. (2003) and 0902+343 from Cody & Braun (2003), who detected H i [ ] but not OH [ at a level].
In Fig. 6 we also show the two other known redshifted OH absorption systems, in the ultra luminous infra-red galaxies (ULIRGS) 19154+2704 () and 12107+3157 () (Darling & Giovanelli 2000, 2002). These sources, however, are different in nature to the radio-loud AGN that make up our sample and the remaining five known absorbers. In particular, the optical–near-infrared colour of the ULIRGs measures just the starlight of a starbursting galaxy, which we expect to be bluer than the typical host of a radio-loud AGN. The physical interpretation of this colour is different to that of the colour of radio-loud AGN, where it is a measure of the reddening of the central nuclear source. We thus include these points in the plots for the sake of completeness.
The large number of upper limits due to non-detections means that Fig. 6 is of limited use for analysis purposes. There is, however, neglecting the tentative detection towards 2300–189 (Sect. 3.1.2), a clear trend for the five sources with detected OH absorption to show increasing line strength with increasing redness. We see that the limits imposed by our non-detections are consistent with this trend, and so we may be close to the sensitivity to detect OH in at least four of the targets. However, since 0108+388 and 0500+019 are the only systems of these in which H i has been detected, any absorption which is coincident with the reddening may not be located at the host galaxy redshift.
In Fig. 7 we plot the OH velocity integrated optical depth normalised by that of the H i
against the optical–near-IR colour555For completeness we also show 12107+3157 (Darling & Giovanelli, 2002) for which H i 21-cm has also been detected (J. Darling, priv. comm.)., where, as per Figs. 5 and 6, these are scaled in order to show the ratio of to on the ordinate. Again, neglecting the tentative detection (Sect. 3.1.2), the plot shows a significantly reduced scatter in the correlation for the known OH absorbers (cf. Fig. 6) and provides good evidence that the reddening of these sources is due to the presence of dust, be it in the intervening absorber (0132–097, 0218+357 and 1830–211), or located in the host (1413+135 and 1504+377). For the four sources also detected in millimetre-wave transitions, the normalised OH velocity integrated optical depth/optical–near-IR colour relationship can be characterised by
| (3) |
significant at the 96% level (Fig. 7, bottom). The obvious caveat in this conclusion is the fact that it is based on so few detections, although Fig. 1 supports the steep increase of molecular abundance with colour. We also note that 1830211 has a low Galactic latitude, and a correspondingly high Galactic extinction (, or . Schlegel et al. 1998), which could contribute to the observed reddening in this source. Since the resolution of the DIRBE maps is two orders of magnitude coarser than the size of the host galaxy, and there is limited removal of contaminating sources at low latitudes, there is large uncertainty in the precise value of the extinction towards this source. Therefore, we do not correct for this effect in our analysis, but simply note it here.
3.2.2 Other factors
We have selected our targets on the basis of the optical colours of the four known redshifted OH absorption systems. According to Fig. 6, at least four of our targets could be red enough, although only one of these is currently known to exhibit H i absorption at the redshift observed. As stated previously, only two of the five known systems exhibit the absorption in the host and so it is perhaps worth summarising how these systems were originally identified:
- •
-
•
Various millimetre-wave absorption lines were detected in a gravitational lens candidate at towards the BL Lac object B0218+357 Wiklind & Combes (1995). The redshift of the lens was previously determined from absorption features in the optical spectra of O’Dea et al. (1992) and Browne et al. (1993), from which Carilli et al. (1993) subsequently detected H i absorption. OH absorption was detected by Kanekar & Chengalur (2002).
-
•
Several millimetre-wave absorption lines were detected in the host of B3 1504+377 by Wiklind & Combes (1996b). This is an edge-on AGN, which would suggest high dust column densities along the line-of-sight to the nuclear continuum source. Optical lines were previously identified by Stickel & Kühr (1994), with H i and OH absorption found subsequent to the millimetre lines (Carilli et al. 1998 and Kanekar & Chengalur 2002, respectively).
-
•
Although the presence of a gravitational lens along the line-of-sight to the quasar PKS 1830–211 was known (Subrahmanyan et al., 1990), its redshift was not determined until Wiklind & Combes (1996a) identified several millimetre-wave absorption lines through a 14 GHz wide spectral scan of the 3-mm band666This is a technique we also tried towards visually obscured objects, although to no avail (Murphy, Curran & Webb, 2003; Curran et al., 2006b).. Following this, H i and OH absorption at this redshift were found by Chengalur et al. (1999). Note also, that an H i absorption feature has also been detected at towards the quasar (Lovell et al., 1996). Since this has only the line strength of the other feature (Table 4), summing these to give a total H i column density towards the background quasar makes very little difference to Figs. 5 and 7. Furthermore, molecular absorption was undetected at (Wiklind & Combes, 1998) and Courbin et al. (2002) suggest that it is the absorber which is responsible for the obscuration of the optical light.
-
•
After a long lull in the detection of new molecular absorbers in rotational transitions at high redshift, Kanekar et al. (2005) detected OH absorption in the gravitational lens towards the quasar PKS 0132–097 (PMN J0134–0931). This was a known gravitational lens in which the redshift was determined by Ca ii absorption lines (Hall et al., 2002). Following this, H i absorption was detected by Kanekar & Briggs (2003) and with its extremely large colour (Gregg et al., 2002), this was a prime target in which to search for OH absorption777Indeed, we attempted the first detection of OH absorption in this lens over both of the GMRT runs and the WSRT run described here (Sect. 2). Unfortunately, on all occasions severe RFI due to a mobile phone band operating at close to 945 MHz prevented even good data of the bandpass calibrator.. Unlike the other four molecular absorbers where HCO+ is optically thick, in this source HCO+ remains undetected to at a level (Kanekar et al., 2005). This is unexpected since this optical depth limit gives a column density of per channel ( K), thus being clearly short of the ratio , shown by the other four redshifted absorbers (Kanekar & Chengalur, 2002) and Galactic molecular clouds (Liszt & Lucas, 1996).
Unlike most of our targets, four of the five known molecular absorbers all have previously determined redshifts, from either intervening lenses or absorption in the hosts of active galaxies. As mentioned in Sect. 2.1, for the type-2 objects, unified schemes for AGN imply that our line-of-sight to the nucleus is obscured by a high column density of dust and we may expect absorption from gas associated with this. Of our targets which are type-2 radio galaxies (Table 1):
-
1.
0114+074 has yet to be searched for H i absorption, although Fig. 6 suggests our sensitivity is dex short of that required to detect OH.
-
2.
RFI marred the observations of H i absorption redshifted to 1011 MHz towards 0454+066. OH has yet to be searched for, but with , we would expect this to remain undetected.
-
3.
Again, 0153410 has yet to be searched for H i absorption and with , Fig. 6 would suggest that , or two orders of magnitude lower than the sensitivity of our observations.
-
4.
As above, no H i absorption has yet been searched for in 1353341 and with , Fig. 6 suggests that another three orders of magnitude increase in the sensitivity of our observations would be required to reach the required .
-
5.
H i of a high column density was detected in 1555–140, although again with a relatively low degree of reddening (), we do not expect to detect OH.
-
6.
H i in 2300–189 was undetected down to a limit of , although we may have a detection of OH, which is unexpected according to the / relation (Fig. 6).
Because the scales probed by the high resolution continuum images of these radio sources ( tens of mas, Morabito et al. 1986; Duncan et al. 1993; Bondi et al. 1996; Lovell 1997; Jackson et al. 1999; Fomalont et al. 2000; Marr et al. 2001; Beasley et al. 2002; Fomalont et al. 2003) are typically much smaller than the scales that can be probed by the optical observations used to derive the colours (typically 0.5 arcsec at best, and often integrated over the entire host galaxy), one cannot be certain that optical and radio sources are coincident on mas scales. An example could be 2300–189, in which we may have detected OH despite its blue colour. The optical counterpart to the radio source could be strongly reddened, but have its redness diluted by the inclusion of starlight from the host galaxy. Nevertheless, Fig.7 is indicates a 96% correlation between the strength of the OH absorption and the optical–near-infrared colour,
Stocke & Rector (1997) find an excess of Mgii absorbers in the spectra of BL Lac objects, which they attribute to the possible presence of a foreground galaxy causing gravitational micro-lensing of the background source. Targetting the redshift of the Mgii absorber may then be a useful way to search for new absorption systems. As well as the radio galaxies searched here, we have undertaken a survey of BL Lac and narrow-line objects with the Effelsberg 100-m telescope. However, due to severe RFI in the UHF bands, we may have to re-observe these sources elsewhere. Also, as part of this survey we are currently undertaking deep integrations for molecular absorption in gravitational lenses towards reddened quasars, and shall report our results in a later paper.
Finally for four of the five known systems we note that the molecular absorption was initially identified via millimetre transitions, with the OH line being confirmed afterward. Therefore, by definition, the background continuum sources illuminating these absorbers all have very flat radio spectra. Spectral indices of are indicative of compact radio sources (Zensus et al., 1984), which perhaps indicates that the coverage of the background continua by these absorbers is large, thus maximising the observed optical depth of the absorption line. For completeness, the spectral energy distributions of the sources searched for OH are shown in Fig. 8.

4 Summary
We have presented the results from the first phase of our survey for cosmologically redshifted atomic and molecular absorption lines in the radio and microwave bands. All of our observations are towards quasars and radio galaxies where we suspect, due to the reddening of these objects, there may be large column of dust located somewhere along the line-of-sight. In the absence of any previously known absorption feature, we have observed at the host redshift in the hope of detecting absorption due to cold dense gas located in the host galaxy.
Despite reaching limits comparable to the known H i and OH absorption systems, we only detect clear absorption in one source: H i absorption in the radio galaxy PKS 1555–140. Besides this, we only have complete searches for H i in three other sources and using the previously published detections of associated H i absorption, we see only a slight trend for the H i line strength to increase with optical–near-IR colour.
Although we are searching at redshifts where no other absorption features are yet known, we would expect, as for two of the five known OH absorbers, molecular absorption within the host in at least some of the 13 cases in which OH was searched. Presuming that this is not bad luck due to the number of sources searched, when comparing our results to the known redshifted molecular absorbers:
-
1.
We find a steep increase in the molecular fraction of the absorber with optical–near infrared colour of the quasar, as well as a correlation of significance between molecular line strength (normalised by the atomic line strength) and the colour. If reliable, this is a strong indicator that the reddening is due to dust that has associated molecular gas, be this within an intervening absorber or within the host galaxy.
-
2.
Furthermore, at least four of the five known molecular absorption systems lie along the line-of-sight to quasars with extremely flat radio spectra. This suggests that the background sources are compact and that most of the observed flux is incident on the absorber, maximising the effective optical depth of the absorption line. Molecules in four of the five known systems were discovered through millimetre-wave observations, before being followed up with searches for OH in the centimetre band. In retrospect, the success of this method is not surprising, since the selection of sources with high millimetre fluxes introduces a bias in favour of more compact radio sources.
-
3.
Finally, as well as being extremely red and occulting compact background continua, the known absorbers also have previously identified absorption features at the redshifts searched. The absorption systems comprise of three gravitational lenses in addition to an active galactic nucleus and BL Lac object, all of which we are currently searching as part of this survey. We shall report the results of these searches in subsequent papers.
Acknowledgments
We wish to thank Annie Hughes who was the Duty Astronomer for the remote ATCA observations, Bert Harms and Rene Vermeulen for the remote WSRT observations, as well as the various telescope operators and staff who greatly assisted our visits to the GMRT. We would also like to thank Bob Sault, Alberto Bolatto, Peter Teuben and Tom Oosterloo for their advice on the various intricacies of miriad. We would also like to thank the anonymous referee for their helpful in-depth comments.
The Australia Telescope is funded by the Commonwealth of Australia for operations as a National Facility managed by CSIRO. The GMRT is run by the National Centre for Radio Astrophysics of the Tata Institute of Fundamental Research. The Westerbork Synthesis Radio Telescope is operated by the ASTRON (Netherlands Foundation for Research in Astronomy) with support from the Netherlands Foundation for Scientific Research NWO.
This research has made use of the NASA/IPAC Extragalactic Database (NED) which is operated by the Jet Propulsion Laboratory, California Institute of Technology, under contract with the National Aeronautics and Space Administration. This research has made use of NASA’s Astrophysics Data System Bibliographic Services.
This publication makes use of data products from the Two Micron All Sky Survey, which is a joint project of the University of Massachusetts and the Infrared Processing and Analysis Center/California Institute of Technology, funded by the National Aeronautics and Space Administration and the National Science Foundation.
References
- Adelman-McCarthy et al. (2006) Adelman-McCarthy., et al. 2006, ApJS, 162, 38
- Antonucci (1993) Antonucci R. R. J., 1993, ARA&A, 31, 473
- Beasley et al. (2002) Beasley A. J., Gordon D., Peck A. B., Petrov L., MacMillan D. S., Fomalont E. B., Ma C., 2002, ApJS, 141, 13
- Bondi et al. (1996) Bondi M., et al., 1996, A&A, 308, 415
- Browne et al. (1993) Browne I. W. A., Patnaik A. R., Walsh D., Wilkinson P. N., 1993, MNRAS, 263, L32
- Carilli et al. (1998) Carilli C. L., Menten K. M., Reid M. J., Rupen M. P., Yun M. S., 1998, ApJ, 494, 175
- Carilli et al. (1992) Carilli C. L., Perlman E. S., Stocke J. T., 1992, ApJ, 400, L13
- Carilli et al. (1993) Carilli C. L., Rupen M. P., Yanny B., 1993, ApJ, 412, L59
- Chengalur et al. (1999) Chengalur J. N., de Bruyn A. G., Narasimha D., 1999, A&A, 343, L79
- Cody & Braun (2003) Cody A. M., Braun R., 2003, A&A, 400, 871
- Combes & Wiklind (1998) Combes F., Wiklind T., 1998, A&A, 334, L81
- Courbin et al. (2002) Courbin F., Meylan G., Kneib J., Lidman C., 2002, ApJ, 575, 95
- Cui et al. (2005) Cui J., Bechtold J., Ge J., Meyer D. M., 2005, ApJ, 633, 649
- Curran, Kanekar & Darling (2004) Curran S. J., Kanekar N., Darling J. K., 2004, Science with the Square Kilometer Array, New Astronomy Reviews 48. Elsevier, Amsterdam, pp 1095–1105
- Curran et al. (2004a) Curran S. J., Murphy M. T., Pihlström Y. M., Webb J. K., Bolatto A. D., Bower G. C., 2004a, MNRAS, 352, 563
- Curran et al. (2005) Curran S. J., Murphy M. T., Pihlström Y. M., Webb J. K., Purcell C. R., 2005, MNRAS, 356, 1509
- Curran & Webb (2006a) Curran S. J., Webb J. K., 2006a, MNRAS, In press (astro-ph/0606180)
- Curran et al. (2004b) Curran S. J., Webb J. K., Murphy M. T., Carswell R. F., 2004b, MNRAS, 351, L24
- Curran et al. (2006b) Curran S. J., Webb J. K., Murphy M. T., Kuno N., 2006b, in Millar T. J., ed., The Astrochemistry of External Galaxies, ASP Conf. Ser., San Francisco
- Darling & Giovanelli (2000) Darling J., Giovanelli R., 2000, AJ, 119, 3003
- Darling & Giovanelli (2002) Darling J., Giovanelli R., 2002, AJ, 124, 100
- Darling et al. (2004) Darling J., Giovanelli R., Haynes M. P., Bower G. C., Bolatto A. D., 2004, ApJ, 613, L101
- Drinkwater et al. (1997) Drinkwater M. J., et al., 1997, MNRAS, 284, 85
- Duncan et al. (1993) Duncan R. A., White G. L., Wark R., Reynolds J. E., Jauncey D. L., Norris R. P., Savage L. T. A., 1993, PASA, 10, 310
- Fomalont et al. (2000) Fomalont E. B., Frey S., Paragi Z., Gurvits L. I., Scott W. K., Taylor A. R., Edwards P. G., Hirabayashi H., 2000, ApJS, 131, 95
- Fomalont et al. (2003) Fomalont E. B., Petrov L., MacMillan D. S., Gordon D., Ma C., 2003, AJ, 126, 2562
- Francis et al. (2000) Francis P. J., Whiting M. T., Webster R. L., 2000, PASA, 17, 56
- Gregg et al. (2002) Gregg M. D., Lacy M., White R. L., Glikman E., Helfand D., Becker R. H., Brotherton M. S., 2002, ApJ, 564, 133
- Griffiths et al. (1999) Griffiths L. M., Barbosa D., Liddle A. R., 1999, MNRAS, 308, 854
- Hall et al. (2002) Hall P., Richards G., York D., Keeton C., Bowen D., Schneider D., Schlegel D., Brinkmann J., 2002, ApJ, 575, L51
- Hambly et al. (2001) Hambly N., et al., 2001, MNRAS, 326, 1279
- Hewitt & Burbidge (1989) Hewitt A., Burbidge G., 1989, ApJS, 69, 1
- Ishwara-Chandra et al. (2003) Ishwara-Chandra C. H., Dwarakanath K. S., Anantharamaiah K. R., 2003, JA&A, 24, 37
- Jackson et al. (1999) Jackson N., Roland J., Bremer M., Rhee G., Webb J., 1999, A&AS, 134, 401
- Kanekar & Briggs (2003) Kanekar N., Briggs F. H., 2003, A&A, 412, L29
- Kanekar et al. (2005) Kanekar N., et al., 2005, PhRvL, 95, 261301
- Kanekar & Chengalur (2002) Kanekar N., Chengalur J. N., 2002, A&A, 381, L73
- Kanekar & Chengalur (2003) Kanekar N., Chengalur J. N., 2003, A&A, 399, 857
- Kanekar et al. (2003) Kanekar N., Chengalur J. N., de Bruyn A. G., Narasimha D., 2003, MNRAS, 345, L7
- Kanekar et al. (2006) Kanekar N., Subrahmanyan R., Ellison S. L., Lane W., Chengalur J. N., 2006, MNRAS, In press (astro-ph/0605346)
- Kovalev et al. (1999) Kovalev Y. Y., Nizhelsky N. A., Kovalev Y. A., Berlin A. B., Zhekanis G. V., Mingaliev M. G., Bogdantsov A. V., 1999, A&AS, 139, 545
- Landolt (1992) Landolt A., 1992, AJ, 104, 340
- Liszt & Lucas (1996) Liszt H., Lucas R., 1996, A&A, 314, 917
- Lovell (1997) Lovell J., 1997, PhD thesis, University of Tasmania
- Lovell et al. (1996) Lovell J. E. J., et al., 1996, ApJ, 472, L5
- Marr et al. (2001) Marr J. M., Taylor G. B., Crawford F., 2001, ApJ, 550, 160
- McGregor et al. (1994) McGregor P., Hart J., Downing M., Hoadley D., Bloxham G., 1994, in McLean I. S., ed., ASSL Vol. 190: Astronomy with Arrays, The Next Generation, Dordrecht: Kluwer, p. 299
- Moore et al. (1999) Moore C. B., Carilli C. L., Menten K. M., 1999, ApJ, 510, L87
- Morabito et al. (1986) Morabito D. D., Niell A. E., Preston R. A., Linfield R. P., Wehrle A. E., Faulkner J., 1986, AJ, 91, 1038
- Morganti et al. (2001) Morganti R., Oosterloo T. A., Tadhunter C. N., van Moorsel G., Killeen N., Wills K. A., 2001, MNRAS, 323, 331
- Murphy, Curran & Webb (2003) Murphy M. T., Curran S. J., Webb J. K., 2003, MNRAS, 342, 830
- Murphy, Webb & Flambaum (2003) Murphy M. T., Webb J. K., Flambaum V. V., 2003, MNRAS, 345, 609
- O’Dea et al. (1992) O’Dea C. P., Baum S. A., Stanghellini C., Dey A., van Breugel W., Deustua S., Smith E. P., 1992, 104, 1320
- Péroux et al. (2001) Péroux C., Storrie-Lombardi L. J., McMahon R. G., Irwin M., Hook I. M., 2001, AJ, 121, 1799
- Pihlström et al. (2005) Pihlström Y. M., Baan W. A., Darling J., Klöckner H.-R., 2005, ApJ, 618, 705
- Rao & Turnshek (2000) Rao S. M., Turnshek D. A., 2000, ApJS, 130, 1
- Reimers et al. (2003) Reimers D., Baade R., Quast R., Levshakov S. A., 2003, A&A, 410, 785
- Schlegel et al. (1998) Schlegel D. J., Finkbeiner D. P., Davis M., 1998, ApJ, 500, 525
- Srianand et al. (2004) Srianand R., Chand H., Petitjean P., Aracil B., 2004, PhRvL, 92, 121302
- Stanghellini et al. (1993) Stanghellini C., O’Dea C. P., Baum S. A., Laurikainen E., 1993, ApJS, 88, 1
- Stickel & Kühr (1994) Stickel M., Kühr H., 1994, A&AS, 105
- Stickel et al. (1996) Stickel M., Rieke G. H., Kühr H., Rieke M. J., 1996, ApJ, 468, 556
- Stocke & Rector (1997) Stocke J. T., Rector T. A., 1997, ApJ, 489, L17
- Subrahmanyan et al. (1990) Subrahmanyan R., Narasimha D., Pramesh-Rao A., Swarup G., 1990, MNRAS, 246
- Tornikoski et al. (1996) Tornikoski M., et al., 1996, A&AS, 116, 157
- Uson et al. (1991) Uson J. M., Bagri D. S., Cornwell T. J., 1991, PhRvL, 67, 3328
- van Gorkom et al. (1989) van Gorkom J. H., Knapp G. R., Ekers R. D., Ekers D. D., Laing R. A., Polk K. S., 1989, AJ, 97, 708
- Vermeulen et al. (2003) Vermeulen R. C., et al., 2003, A&A, 404, 861
- Webster et al. (1995) Webster R. L., Francis P. J., Peterson B. A., Drinkwater M. J., Masci F. J., 1995, Nat, 375, 469
- Whiting (2000) Whiting M. T., 2000, PhD thesis, University of Melbourne
- Wiklind & Combes (1994) Wiklind T., Combes F., 1994, A&A, 286, L9
- Wiklind & Combes (1995) Wiklind T., Combes F., 1995, A&A, 299, 382
- Wiklind & Combes (1996a) Wiklind T., Combes F., 1996a, Nat, 379, 139
- Wiklind & Combes (1996b) Wiklind T., Combes F., 1996b, A&A, 315, 86
- Wiklind & Combes (1998) Wiklind T., Combes F., 1998, ApJ, 500, 129
- Wiklind & Combes (2001) Wiklind T., Combes F., 2001, in Brainerd T. G., Kochanek C. S., eds, Gravitational Lensing, ASP Conf. Ser. 237, San Francisco, p. 155
- Zensus et al. (1984) Zensus J. A., Porcas R. W., Pauliny-Toth I. I. K., 1984, A&A, 133, 27