Restframe Optical Spectroscopic Classifications for Submillimeter Galaxies88affiliation: Based partly on data collected at Subaru Telescope and obtained from the SMOKA science archive at Astronomical Data Analysis Center, which are operated by the National Astronomical Observatory of Japan. 99affiliation: Based partly on the data collected with the ESO VLT-UT1 Antu Telescope(074.B-0107(A)). 1010affiliation: Based partly on data obtained at the Keck Observatory, which is operated as a scientific partnership among the California Institute of Technology, the University of California, and the National Aeronautics and Space Administration. The observatory was made possible by the generous financial support of the W. M. Keck Foundation.
Abstract
We report the results of a systematic near-infrared spectroscopic survey using the Subaru, VLT and Keck Telescopes of a sample of high redshift Ultra-luminous Infrared Galaxies (ULIRGs) mainly composed of submillimeter-selected galaxies. Our observations span the restframe optical range containing nebular emission lines such as H, [Oiii], and [Oii], which are essential for making robust diagnostics of the physical properties of these ULIRGs. Using the H/H emission line ratios, we derive internal extinction estimates for these galaxies similar to those of local ULIRGs: . Correcting the H estimates of the star formation rate for dust extinction using the Balmer decrement, results in rates which are consistent with those estimated from the far-infrared luminosity. The majority (%) of our sample show spectral features characteristic of AGN (although we note this partially reflects an observational bias in our sample), with % exhibiting broad Balmer emission lines. A proportion of these sources show relatively low [Oiii]/H line ratios, which are similar to those of Narrow Line Seyfert 1 galaxies suggesting small mass black holes which are rapidly growing. In the subsample of our survey with both [Oiii] and hard X-ray coverage, at least % show an excess of [Oiii] emission, by a factor of 5–10, relative to the hard X-ray luminosity compared to the correlation between these two properties seen in Seyferts and QSOs locally. From our spectral diagnostics, we propose that the strong [Oiii] emission in these galaxies arises from shocks in dense gaseous regions in this vigorously star-forming population. We caution that due to sensitivity and resolution limits, our sample is biased to strong line emitters and hence our results do not yet provide a complete view of the physical properties of the whole high-redshift ULIRG population.
Subject headings:
galaxies: high-redshift, submillimeter, radio, galaxies: evolution, galaxies: star formation rate, active galactic nucleus(AGN)1. Introduction
There is almost irrefutible evidence for an increase in the star formation density with redshift, as demonstrated by emission line and continuum star formations tracers in wavebands from the ultraviolet to the submillimeter and radio wavebands. This evolution appears to be stronger for tracers which are less sensitive to dust obscuration (e.g. Ivison et al. 2006), suggesting that an increasing proportion of the activity in more distant galaxies may be highly obscured (e.g. Blain et al. 1999, 2002). Indeed, recent results on the mid- to far-infrared emission of luminous but dust obscured galaxies at high redshift (–3) suggests that the origin of their large infrared luminosities is a mix of dust obscured vigorous star formation and/or dust enshrouded active galactic nucleus (AGN) (Yan et al. 2005; Houck et al. 2005; Lutz et al. 2005; Desai et al. 2006). In many sources it is likely that both AGN and star formation contribute to the emission as a result of the close link required between the growth of super-massive black holes and bulges in massive galaxies (e.g. Borys et al. 2005).
One of the best-studied populations of high-redshift, far-infrared luminous galaxies is that identified in the submillimeter waveband using the SCUBA camera (Holland et al. 1999) on the James Clerk Maxwell Telescope (JCMT). Although they span less than an order of magnitude in submillimeter flux, these galaxies are responsible for much of the energy density in the submillimeter background (Barger et al. 1998; Hughes et al. 1998; Smail et al. 2002; Cowie, Barger & Kneib 2002; Scott et al. 2002). The faintness of these obscured galaxies in the optical waveband has made it difficult to obtain precise redshifts (e.g. Simpson et al. 2004), although some progress has been made using ultraviolet/blue spectrographs (Chapman et al. 2003a; 2005). The median redshift for submillimeter galaxies with 850 m fluxes of mJy, (hereafter SMGs) is (Chapman et al. 2003a, 2005). The submillimeter and radio fluxes of these systems indicate their bolometric luminosities are L⊙ (Kovacs et al. 2006), confirming that they are examples of high-redshift Ultraluminous Infrared Galaxies (ULIRGs).
This population provides critical constraints on models of galaxy formation and evolution. In particular, if the bolometric emission from SMGs is powered solely by star formation, then these galaxies form about half of the stars seen in the local Universe (Lilly et al. 1999). However, it appears likely that both AGN and star formation activity contribute to the immense far-infrared luminosities of these systems, although it has been difficult to disentangle the precise balance between these two energy sources. Recent sensitive X-ray analysis suggest that star formation is likely to be the dominant source of the bolometric luminosity in SMGs (Alexander et al. 2005a,b). Further evidence suggest it is plausible to identify SMGs as the progenitor of massive elliptical galaxies at the present-day, based on their large gas, stellar and dynamical masses (Neri et al. 2003; Greve et al. 2005; Tacconi et al. 2006; Smail et al. 2004; Borys et al. 2005; Swinbank et al. 2004, 2006). Furthermore, combining the X-ray constraints on the AGN within this population with the typical mass estimates suggests that SMGs are the sites of coeval growth of stellar bulges and central black holes (Borys et al. 2005).
Rest-frame optical emission lines provide a powerful tool to investigate many fundamental properties of galaxies, such as star formation rates (SFRs), power sources, internal extinction and metallicity. Swinbank et al. (2004) conducted a systematic near-infrared spectroscopic survey of thirty SMGs to investigate their SFRs and metallicities and the kinematics of the emission line gas. However, the wavelength coverage was limited to the region around H and so they did not include several emission lines at shorter wavelengths, such as H and [Oiii], which are useful for evaluating internal extinction and metallicity or determining the power source.
We present in this paper the results from a near-infrared spectroscopic survey of redshifted [Oiii], H and [Oii] lines for a sample of far-infrared luminous galaxies. The sample is composed of SMGs and optically faint radio galaxies (OFRGs), at –3.5. Chapman et al. (2004) and Blain et al. (2004) claim that high-redshift OFRGs are ULIRGs, with similar bolometric luminosities to SMGs but warmer characteristic dust temperature, resulting in them being undetectable in the submillimeter waveband. We use H/H emission line ratios to derive the dust extinction in these systems and then employ these estimates to derive extinction-corrected SFRs from the H luminosities. In addition, we also use X-ray observations of these objects to compare the strength of the [Oiii] emission to their X-ray emission, and so investigate the power of the AGN in these galaxies. We adopt cosmological parameters of H72 km sec-1 Mpc-1, and and 0.7 throughout.
2. Observation and Data Reduction
Our sample was selected from the catalogs of SMGs and OFRGs in Chapman et al. (2005, 2004). We chose SMGs/OFRGs in the redshift ranges –2.56 and –1.68, where nebular emission lines such as [Oii], H, [Oiii] and/or H are redshifted into clear parts of the , and -bands respectively. In total 22 targets were observed using the OHS spectrograph on Subaru, ISAAC on the VLT or NIRSPEC on Keck. The log of the observations is given in Table 1.
2.1. Subaru OHS observations and data reduction
The majority of our spectroscopic observations were taken with the OH Suppression Spectrograph (OHS; Iwamuro et al. 2001) with the Cooled Infrared Spectrograph and Camera for OHS (CISCO; Motohara et al. 2002) attached to the Nasmyth focus of Subaru Telescope (Iye et al. 2004). Observations were obtained on the nights of 2004 April 6, 7, June 24–25, and 2005 Feb 14–16. Sky conditions were photometric on all these nights with typical seeing 0.5–0.7′′ at 1.6m. We used a slit width of 0.95′′, which gives a resolution of / ( km sec-1) and used the “SP4” dither pattern, which shifts the object along the slit to four positions in one sequence. After completing each observation, we observed bright A- or F-type stars with the same configuration as the science observation to calibrate the extinction and sensitivity variation with wavelength. During each night we observed at least two photometric standard stars selected from the UKIRT Faint Standards catalog (Hawarden et al. 2001). We used FS 27 and FS 127 for the observations taken in 2004 April, FS 23 and FS 30 in 2004 June and FS 133 and FS 127 in 2005 February.
The data reduction was performed in the standard manner using custom scripts in iraf and some c programs provided by the OHS/CISCO instrument teams. First, we subtracted the sky background using the object frames at different dither positions. Next we fitted the sky line residuals using two dimensional polynomials and subtracted these from the data. We then shift-and-added the images from the different dithering positions, using a median combine. As the instrument is stable, wavelength calibration was performed using the nominal conversion of pixel coordinates to wavelength. To confirm the stability of the wavelength solution, we analysed Argon calibration lamp exposures taken during our runs and checked for systematic shifts in wavelength. We found typical systematic shifts of 7–9Å (%) which is ignorable in our analysis due to the low resolution of our spectra. Extinction, sensitivity and photometric calibration were performed by dividing the calibrated spectra with those of the bright A- or F-type standard star observations after fitting the stellar spectra with models.
2.2. VLT ISAAC observations and data reduction
We conducted observations of four SMGs and one OFRG using the ISAAC spectrograph on the 8-m VLT on 2004 November 22–23 (Table 1). ISAAC was used in medium-resolution mode, which provides spectral resolution of 3000 ( km sec-1). Seeing was steady at over the course of the observations and the observations were taken with a standard 10′′ ABBA chop. Preliminary data reduction was performed using the eclipse111v4.9-0 http://www.eso.org/projects/aot/eclipse pipeline, using flat-fields generated from night-calibrations taken after each observation, and wavelength calibration from a solution using the OH sky lines. The remaining flux-calibration was achieved in iraf, using corresponding Hipparcos standard stars observed throughout the observing run and near-infrared fluxes derived from the 2MASS catalog.
2.3. Keck NIRSPEC observations and data reduction
The observations of SMM J09431+4700 (H6/H7) and SMM J131201.17+424208.1 were taken on 2004 April 8 in photometric conditions and 0.8′′ seeing using the NIRSPEC spectrograph on Keck. These observations employed the standard ABBA configuration to achieve sky subtraction. Each exposure was 600 s in length and the total integration time was 2400 s. The data were reduced using the wmkonspec package in iraf. We remapped the two dimensional spectra using linear interpolation to rectify the spatial and spectral dimensions. After subtracting pairs of nod-positions (the nod was 20′′ along the slit), residual sky features were removed in idl using sky regions on either side of the object spectrum. For the wavelength calibration we used an Argon arc lamp. The output pixel scale is 4.3 Åpix-1, and the instrumental profile has a FWHM of 15 Å (measured from the widths of the sky-lines), which corresponds to km sec-1. We used FS 27 for photometric calibration.
3. Results
3.1. General Spectral Features
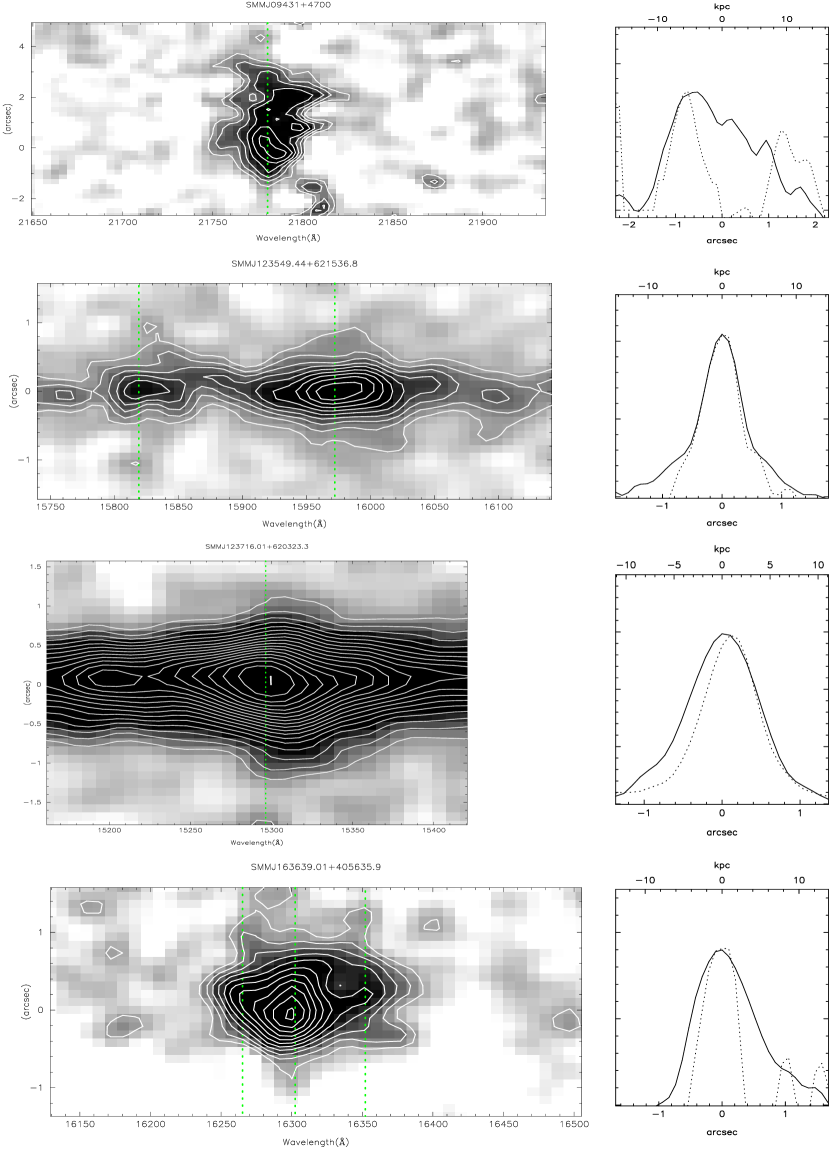
We show all of our spectra in Figure 1. We identified emission lines in 20 spectra out of 22 targets which were observed. Most of the SMGs show weak H emission, but many show strong (and sometimes broad and distorted) profiles in [Oiii]. Some of our spectra show additional emission lines of [Neiii], [Nev]and [Oi], which are common in AGN. Five of the SMGs from our sample (SMM J09431+4700 (H6), SMM J123549.44+621536.8, SMM J123716.01+620323.3, SMM J163639.01+405635.9, and SMM J163650.43+405734.5) display spatially extended structures (1”.0) in either [Oiii] and/or H emission line (Figure 2, see Smail et al. 2003; Swinbank et al. 2005 for evidence of the spatial extension in SMM J163650.43+405734.5).
3.2. Comments On Individual Objects
Several of our observations are particularly noteworthy and we discuss them here.
3.2.1 SMM J023990134
This galaxy is identified as a submillimeter source associated with a spiral galaxy at , which shows features typical of a Seyfert 1 (Smail et al. 1997, 2002; Soucail et al. 1999). The strong and featureless continuum, together with the spatially compact emission line flux indicates AGN activity; an interpretation which is further supported by the detection of this source in hard X-rays by Bautz et al. (2000). Our spectrum shows at least two peaks in the H emission line with FWHM–400km sec-1, consistent with these lines arising from independent components within the system. If we force fit a single Gaussian profile to the H emission, we determine FWHMkm sec-1, which if it arises from an AGN is narrower than typical Seyfert 1 galaxies, although broader than Seyfert 2 galaxies (km sec-1). This source is also detected by CO observation by Greve et al. (2005) with a double peaked profile with a FWHM of km sec-1and a separation between the two peaks of km sec-1, consistent within the errors with our measurements from H. We therefore choose to interpret the double-peaked H line as evidence for a merger or interaction in this system, with any AGN-produced broad component undetected in our spectrum.
3.2.2 SMM J09431+4700
This source was discovered by Cowie, Barger & Kneib (2002), and has been identified with two distinct Jy radio counterparts: H6 and H7 (Ledlow et al. 2002). These are lensed sources, lying behind a massive cluster Abell 851 at although the amplification is modest: . The redshift for H6 was measured by Ledlow et al. (2002) as from Ly, H7 was not observed. The restframe ultraviolet properties of H6 suggest it hosts an AGN with spectral features similar to a narrow-line Seyfert 1 (Ledlow et al. 2002). We placed the NIRSPEC slit across both radio components and detected [Oiii] emission from both sources at redshifts of and for H6 and H7, respectively. We also detected narrow (FWHM km sec-1) H emission from H6. The [Oiii] emission from H6 is spatially extended( or 14.5 kpc; Figure 2), but has no significant velocity gradient across kpc in projection. No hard X-ray emission was detected with the upper limits on f2-10KeV as 10-15 erg sec-1 cm-2 (Ledlow et al. 2002). CO line emission is also detected by Neri et al. (2003) and Tacconi et al. (2006) based on our restframe optical redshift, originating from H7 at . Millimeter continuum emission has been seen from H6, but assuming the gas reservoir is at the redshift we find from [Oiii], the gas mass of the AGN-dominated component, H6, is a factor of a few lower than that of H7.
3.2.3 SMM J123549.44+621536.8
This source has apparent double-peaked, narrow (km sec-1) emission lines in [Oii] and [Oiii], with the two components spatially offset by . The one dimensional spectra also shows signs of broad H emission at with a FWHM of km sec-1. Both the [Oiii] and the [Oii] emissions are spatially extended with faint wings on scales of approximately 1′′ ( kpc), see Figure 2. There may also be a very weak, broad multiplet of Feii (Figure 1), potentially indicating the presence of the Narrow Line Seyfert 1 (NLS1) type AGN component (Osterbrock & Pogge 1985; Goodrich 1989). This is consistent with the results of Alexander et al. (2005b), which indicated the presence of a heavily obscured AGN with N cm-2 based on their X-ray spectral analysis. The spatial extension in the bright core of the [Oiii] likely indicates merging components or rotation along the slit, while the extended wings may reflect “superwind” activity.
3.2.4 SMM J123716.01+620323.3
This source is very bright in the optical () with a redshift of and it was classified as a QSO by Chapman et al. (2005) based on the broad rest UV emission lines and comparable luminosities in rest optical and far-infrared wavelength, which exceed 1045 erg sec-1. The source has also been detected in hard X-rays by Alexander et al. (2005b). Our spectrum shows several Hydrogen Balmer lines such as H, H and H with broad FWHMrest (–2700 km sec-1) and the [Oiii] doublet with FWHMrest of km sec-1. We also detected the [Neiii] and several Feii lines at 3–4 significance. The restframe optical spectrum is dominated by continuum emission without stellar absorption features, suggesting a large contribution from the AGN component to the total rest-frame optical flux. The [Oiii] emission lines are wide FWHMkm sec-1 and spatially extended (; 12 kpc) indicating dynamically active gas motion (Figure 2). The estimated Hydrogen column density from the X-ray spectral analysis is relatively low (N cm-2), which implies the AGN does not suffer from large extinction. It should be noted that the redshift based on the restframe-UV emission lines is , which is blueshifted by km sec-1 from the redshift indicated by the restframe optical nebular emission line. This velocity offset may arise due to broad Ly emission which may be affected by dust extinction and resonance scattering.
3.2.5 SMM J131222.35+423814.1
This source is another example of a NLS1 type AGN. It lies at and our spectrum displays broad H emission, with FWHM km sec-1 and a low [Oiii]/H ratio (). This source has Ly [Civ]and Heii emission lines in the rest UV spectrum and was classified as a QSO by Chapman et al. (2005). The rest-frame optical emission is dominated by very strong continuum emission without stellar absorption lines, supporting the presence of a luminous AGN component. Unfortunately, there is no coverage of H emission for this object and so we could not constrain the internal extinction. The [Nev] line (which is a very clean indicator of AGN activity; Osterbrock 1989) is detected. Furthermore, this source was detected by the X-ray imaging by Mushotzky et al. (2000), confirming the presence of a luminous AGN in the source.
3.2.6 SMMJ163639.01+405635.9
This source is a good example of a heavily extincted starburst in an SMG and was recently discussed by Swinbank et al. (2006). This galaxy has weak H emission line with H/H . The H and [Oiii] emission lines are spatially extended ( or 10 kpc)(Figure 2). There is only an upper limit on its X-ray emission, f erg sec-1 cm-2 from Manners et al. (2003), which does not strongly constrain the presence of a luminous AGN given the possibility of substantial absorption (e.g. Alexander et al. 2005). The possible detection of [Oi] emission line may hint at the presence of an AGN, although the line ratios of [Oi]/H and [Oiii]/H can be explained by a relatively highly ionized starburst nebulae (Osterbrock et al. 1989).
3.2.7 MMJ163655+405910
This heavily obscured AGN at ) was found in the MAMBO survey of Greve et al. (2004) (and is also called N2 1200.18) and was detected in X-ray imaging with Chandra (Manners et al. 2003). It has broad, FWHM–2500 km sec-1, emission lines of Ly, [Civ] and H in the rest-frame UV and optical wavelengths, with a high [Oi]/H ratio () (Willott et al. 2003; Swinbank et al. 2006) which is typical of AGN (Osterbrock 1989). Our data also show asymmetric H and [Oiii] emission line profiles, which exhibit “blue wings” in their profiles. Such profiles have been interpreted as evidence for wind activity from the AGN, although contribution from other components is possible (Swinbank et al. 2006).
3.2.8 SMM J221737.39+001025.1
Our ISAAC spectrum shows strong, narrow H H [Oiii] and [Nii] emission lines at a redshift of (FWHMrest of H is km sec-1). To investigate the restframe optical properties, we retrieved an archival -band image taken with Subaru Telescope’s Prime Focus Camera (Suprime-Cam) using SMOKA222http://smoka.nao.ac.jp. The image shows an elongated structure, , towards the North-West and the spectrum was taken with the slit aligned along the major axis of this source. We identify two separate H emission lines with a velocity offset of km sec-1and a spatial offset – ( kpc). These suggest the system is a merger. The H and H emission lines do not show asymmetric profiles or detectable broad line components.
3.3. Composite spectra
Since many of our individual spectra have modest signal-to-noise, we have also constructed several composite spectra to investigate the general properties of subsets of the SMG population.
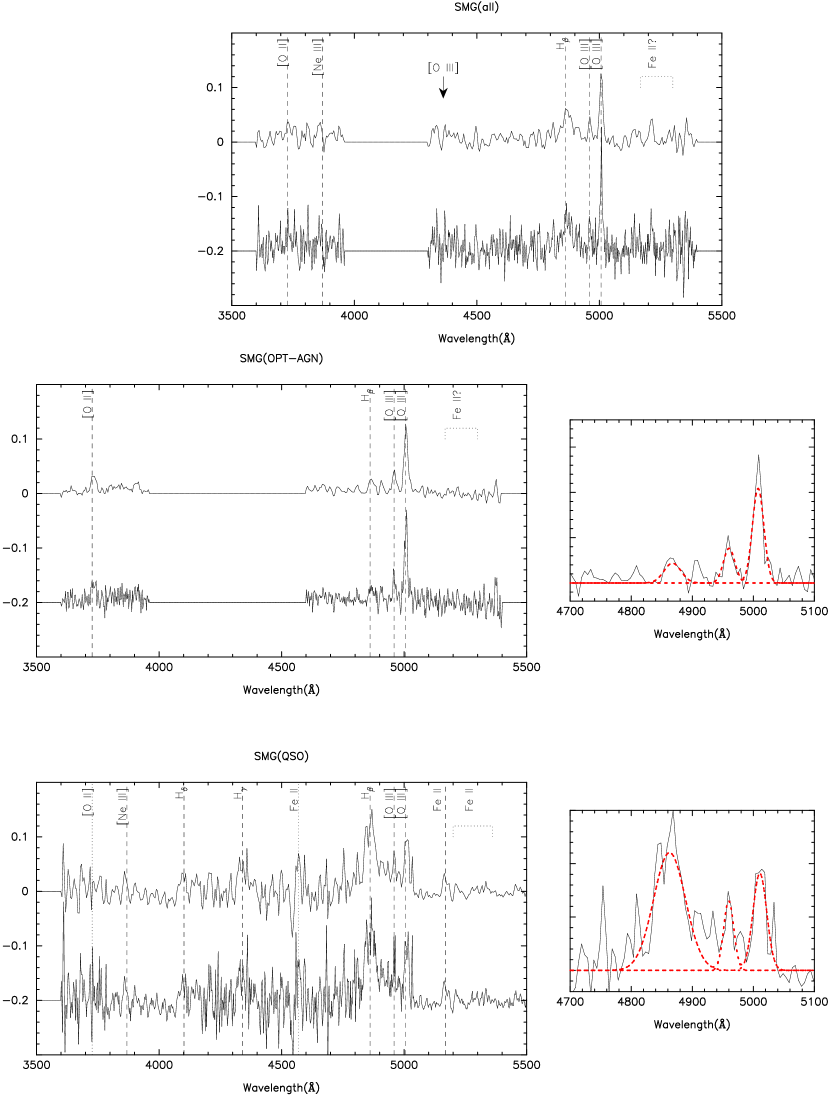
We create the composite spectra by deredshifting each spectrum based on redshifts measured from the [Oiii] lines, subtracting continuum emission using a first order spline fit and averaging all of the spectra with 3- clipping after normalizing by [Oiii]flux. We smoothed the higher resolution spectra taken at Keck and VLT to match the low resolution Subaru spectra before stacking. Either stacking the spectra with weights based on their individual signal-to-noise ratio or an unweighted stack does not alter any of the conclusions below. We derive a composite spectrum for those sources which show QSO signatures (“QSO”; i.e., classified as QSO) and for those galaxies that individually show signs of an AGN in their optical spectra (“OPT-AGN”; i.e., those classified as AGN in the column of “Class” under “OPT” category in Table 2). The former is made from only three individual spectra, while the latter comes from nine spectra. The resulting composite spectra are shown in Figure 3. We do not make a composite of starburst (“SB”) sources since there are only two sources in our sample classified as “SB” or intermediate (“int”) from their restframe optical spectra. The details of the classification will be discussed in §4.1.
The emission lines of H and [Oiii] lines are clearly seen in both the composite spectra. In addition in the “QSO” spectrum, many strong lines are visible, including [Neiii] and several Feii lines at , 5167 and 5200–5360Å, although the [Oii] line is only marginally detected. By fitting a Gaussian to the H and [Oiii] emission lines, we measure the FWHMrest of H as km sec-1 after correction for the instrumental resolution. This is km sec-1 lower than the average FWHM of QSOs at –2.1 (Jarvis & McLure 2006). The [Oiii]/H ratio is . All these spectral features are typical of type 1 AGNs studied locally.
On the other hand in the composite “OPT-AGN” spectrum, a Gaussian profile fit to the H emission line yields FWHMrest of km sec-1 (it should be noted that the H line fit is not improved by including a narrow line component due to the low spectral resolution of our spectra) and [Oiii]/Hratio of , in addition the [Oii] line is well-detected. The H line, which is broader than typical type 2 AGNs, and relatively low [Oiii]/H line ratio, is similar to that of local NLS1 (although by definition these should have [Oiii]/H/3.0). The Feii emission lines, which are one of the characteristic features seen in local NLS1’s, are marginally detected with features seen around 5200 Å in the spectrum, and we can see some marginal detections in individual spectra (SMM J123549.44+621536.8, SMM J123635.59+621424.1, SMM J163650.43+405734.5, and SMM J163706.51+405313.8), all of which have broad H emission of FWHM km sec-1(Figure 1). The resultant spectrum is consistent with a scenario where the restframe optical spectra classified as “AGN” in the UV in reality comprise two types: one has relatively broad, km sec-1, FWHM for the H lines and the other has narrow H lines with a relatively high [Oiii]/H ratio, typical of Type 2 AGNs. There are clearly differences in the extinction of the circumnuclear region of these two types of objects implied by the difference in luminosity and spectroscopic properties of the restframe-UV emission, although there is no systematic difference in the H/H ratio we measure for them.
4. Discussions
4.1. Emission Line Diagnostics
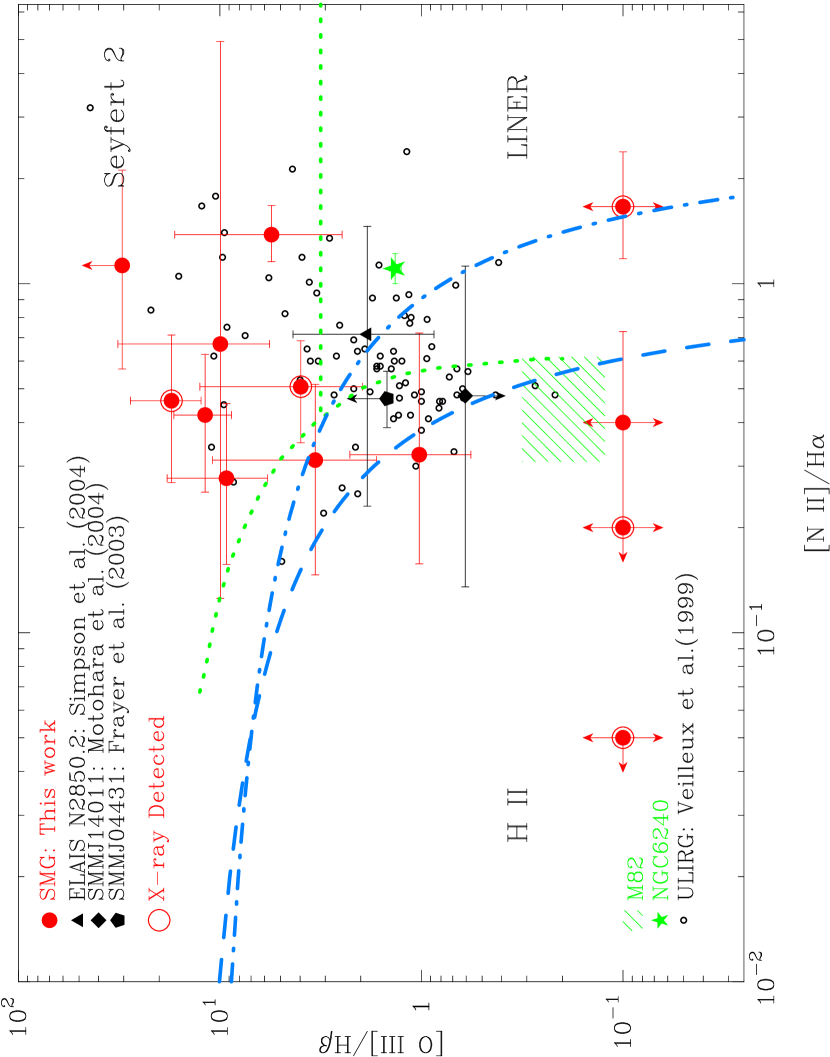
In Figure 4, we plot the observed [Oiii]/H versus [Nii]/H emission line ratios of the 13 galaxies in our sample for which we have secure H detections and some information about [Nii]/H. This diagnostic plot, termed the BPT diagram, can be used to identify the source of gas excitation (Baldwin et al. 1981). Based on this diagram we classify the spectra into three types, starburst (SB), intermediate (int) or non-thermal (AGN), as listed in Table 2. We use the definitions from Kauffman et al. (2003) which are derived for a large sample of local SDSS galaxies. We classify the sources between the boundary of Kauffman et al. and the classical definition of Veilluex & Osterbrock (1987) as “int”. We also classify galaxies as AGN which have H and/or H FWHMrest greater than 1500 km sec-1, as it is difficult to understand the formation of such large line widths from gas motions in star-forming regions. This limit is also greater than the coarse spectral resolution of OHS ( km sec-1). For comparison we also plot the emission line flux ratios from local ULIRGs (Veilleux, Kim & Sanders 1999) and note that the SMGs in our sample occupy the same region of the diagnostic diagram as local ULIRGs. The curves show various criteria for separating AGNs and the star-forming galaxies (see Figure 4). It is clear that the majority, 8/13, of sources in our sample (including all but one, SMM J163639.01+405635.9, with all four emission lines detected) are classified as AGN based on these criteria. We reiterate that this subsample may be biased towards strong line emitters (due to the requirement to have detected lines in our low-resolution spectra) and so this is perhaps not a surprising result.
Moreover, we must interpret the BPT diagram with caution since “superwind” ejecta (shock-driven line emitting gas) can occupy a very similar region to AGN (Dopita & Sutherland 1995). To illustrate this possibility in more detail, we plot the emission line ratio of the wind structure in M 82 from a kpc region (Shopbell & Bland-Hawthorn 1998) and in a kpc2 area of NGC 6240 (Schmitt et al. 1996). The former is indicative of a wind which is dominated by photoionization, and the latter illustrates the line ratios expected from shocks in a very dense environment. Some SMGs show very similar emission line ratios to NGC 6240, although most of them have lower [Nii]/H and higher [Oiii]/H ratios. Further support for the wind scenario is that P-Cygni features are seen in the rest-UV emission lines (Chapman et al. 2003a, 2005) of a significant fraction of the SMG population, supporting the presence of “winds” arising from the vigorous starburst activity. Indeed, the majority (6/8) of this subsample (with four detected emission lines) are classified as “SB” or “int” from their rest UV spectroscopic features (Chapman et al. 2005; Table 2). The power sources in SMGs is discussed further in §4.2.
Looking at the individual sources in Figure 4, we note that SMM J123622.65+621629.7 has a very low [Nii]/H () emission line ratio and no detection of [Oiii] and H (see also Figure 5 in Smail et al. 2004) with H/H 4.25 and [Oiii]/H . This sources is an interacting system of a relatively blue() galaxy with extremely red () companion, where the latter is a hard X-ray source. Whilst the slit was aligned along the major axis of the red X-ray source, it is possible that it also passed through the blue component and the line emission may be contaminated. To avoid biasing our sample, we have therefore eliminated this source from our subsequent analysis and discussion.
4.2. Extinction and Hidden Star Formation
SMGs are dusty systems with large dust masses, M⊙, and high bolometric luminosities (). The presence of large quantities of dust and its associated reddening may also explain the large discrepancies between the SFRs derived for SMGs from their far-infrared and H luminosities (Swinbank et al. 2004), which imply extinction in H of factors –100. There are of course alternative explanations: that the bulk of the far-infrared emission originates from other sources which are too dusty to see even at restframe optical wavelengths, such as very highly obscured AGN, or due to emission which falls outside of the slits used in the H measurements. Although, the latter explanation is unlikely as these observations are based on radio-identified sources with precise positions (; Chapman et al. 2005), and so it is unlikely that a major source of bolometric emission has been missed by the observations.
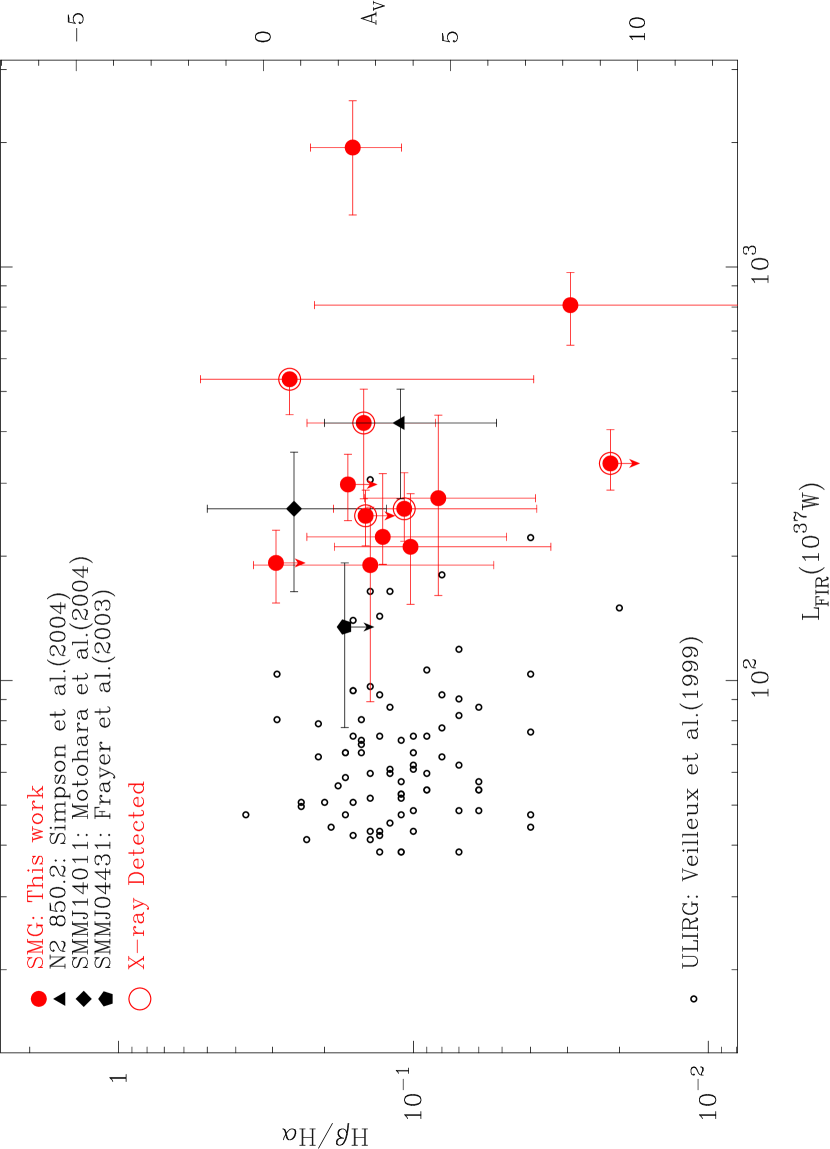
To investigate the internal reddening of SMGs (at least for those regions which are visible in the restframe optical) we plot the H/H ratios as a function of their far-infrared luminosities in Figure 5. To calculate , we use the reddening curve from Calzetti et al. (2000), and assume an intrinsic H/H ratio of 3.0, which is between the values for typical Seyfert 2 galaxies and/or LINERs (3.1, Halpern & Steiner 1983; Gaskel & Ferland 1984) and star-forming galaxies, 2.85 (Veilleux & Osterbrock 1987). The observed H/H ratio for the SMGs is typically 5–20 and the derived extinction spans –4 with a median value of (where the error comes from bootstrap resampling). This estimate is consistent with the results based on the spectral energy distribution (SED) fitting of optical to near-infrared photometric data (Smail et al. 2004), and slightly higher than that derived from optical to mid-infrared SEDs (, Borys et al. 2005) where the latter did not include any contribution from Thermally Pulsed-AGB stars in the model SEDs, which might lead to an underestimation of the reddening (Maraston 206).
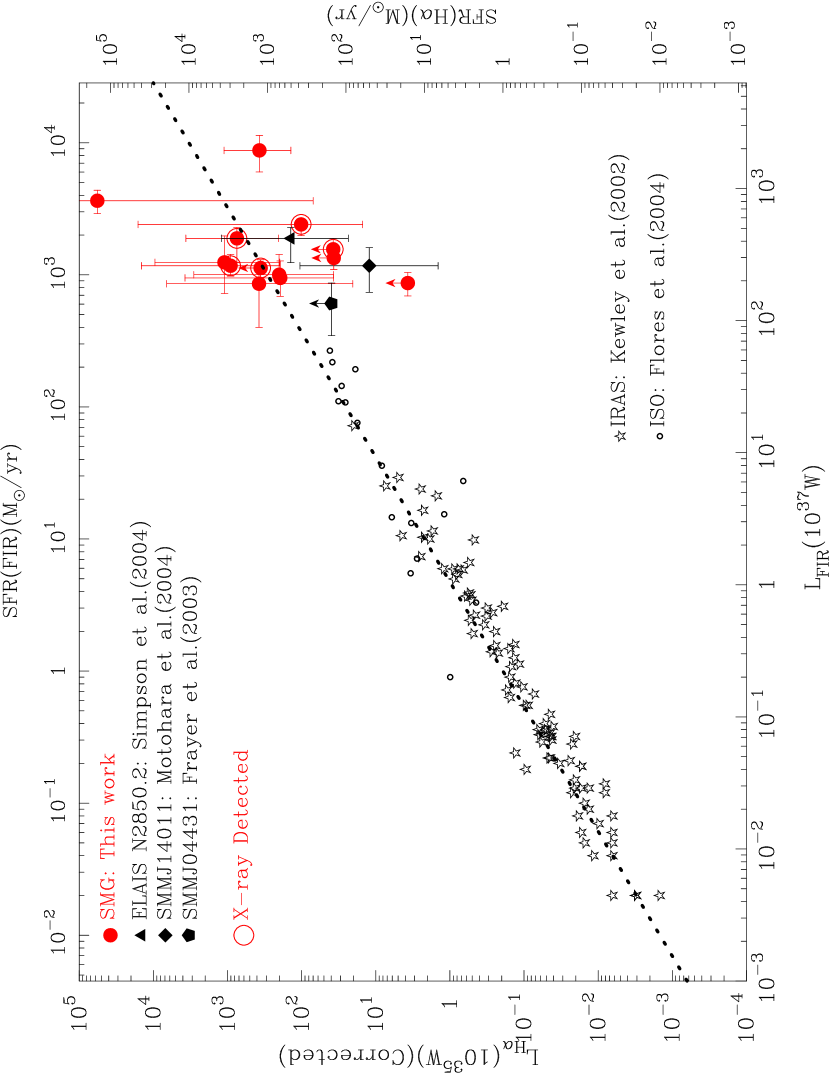
In Figure 6 we compare the extinction corrected SFRs derived from the H and far-infrared luminosities. The far-infrared luminosities come from Chapman et al. (2003b; 2004) based on SED model fitting to the observed 850m and 1.4-GHz fluxes at their known redshifts, assuming the local far-infrared-radio correlation holds (Condon et al. 1991; Garrett 2002). We also include observations for local IRAS galaxies (Kewley et al. 2002) and ISO galaxies (Flores et al. 2004). The typical in these samples are and , respectively. The extinction corrected H luminosities for the IRAS and the ISO galaxies are all calibrated in the same manner as for our SMG samples based on their H/H ratio. The SFRs from the H and from the far-infrared luminosities are derived using the equations given in Kennicutt (1998).
The correlation between the far-infrared and reddening-corrected H luminosities (Figure 6) appears to be relatively good with a linear relation extending over five orders of magnitude in SFR, although with some scatter, with the most luminous SMGs in our sample having SFRs approximately an order of magnitude higher than those of the brightest ISO galaxies. The good agreement between the two SFRs when using the reddening-corrected H-estimate confirms that the discrepancies between the SFRs seen in Swinbank et al. (2004) are in large part due to dust extinction and moreover that the bulk of the far-infrared luminosity in these galaxies is probably derived from star formation. We note that it is likely that slit-losses and placement contribute to the scatter in these measurements as we are combining observations of H and H from different telescopes and instruments. For example, our brightest far-infrared source, SMM J163650.43+405734.5 (N2 850.4), has a lower SFR measured from H than from the far-infrared. However, this galaxy is spatially extended and has a very complex structure in the restframe optical (Smail et al. 2003; Swinbank et al. 2005). It is therefore likely that our slit covered only a part of the H emitting region. Finally, any remaining systematic offset between the two SFR estimates may be caused by the fact that our AV estimates only reflect the reddening to the optically detectable gas and thus are not necessarily a good indicator of the total column towards the bolometric sources in these objects.
4.3. Growing Black Holes in the SMGs
4.3.1 Spectral Similarity with Narrow Line Seyfert 1 Galaxies
SMGs are proposed to be the progenitors of present-day massive spheroidal galaxies, because of their high star-formation rates and their large stellar, gas and dynamical masses (Smail et al. 2004; Neri et al. 2003; Greve et al. 2005; Borys et al. 2005; Tacconi et al. 2006; Swinbank et al. 2006). Most massive galaxies in the local Universe contain super-massive black holes (SMBHs) (e.g., Ferrarese & Merritt 2000; Gebhardt et al. 2000; Marconi & Hunt 2003; Heckman et al. 2004). Equally an AGN appears to be almost universally present in SMGs: based on the extremely sensitive X-ray observations of the Chandra Deep Field North (CDFN), Alexander et al. (2003; 2005a,b) found more than % of SMGs to be detected in hard X-rays, indicating they contain an accreting SMBH. It is therefore interesting to estimate the mass of, and accretion rates onto, the central black holes of SMGs to constrain the coevolution of the SMBHs and the stellar masses of their surrounding bulge (Kawakatu et al. 2003; Granato et al. 2004).
The three sources classified as “QSO” in our sample have characteristics typical of local NLS1: low [Oiii]/H ratios (–1.8), and detectable Feii emission in their individual and also composite spectra (Figures 1 & 3). NLS1 are commonly interpreted as hosting rapidly growing SMBHs (Collin & Kawaguti 2004), and hence the spectral similarities of these SMG-QSOs with local NLS1s could imply comparable physical conditions in the accretion disk around the SMBH in the SMGs. However, the SMGs have FWHM–2500 km sec-1 for their Balmer emission lines, and so they are not formally NLS1s because these lines width are higher than the definition used for NLS1 (FWHMrest of H of km sec-1). Nevertheless, it is however worth noting that their H FWHMrest are close to the minimum for QSOs at –2.1 (Jarvis & McLure 2006), and narrower than the average of radio quiet/loud QSOs(–6500 km sec-1). Although, we caution that with the limited signal to noise in our spectra we may underestimate the line widths, missing weak and broader line components. For instance, in the composite spectrum of SMG-QSOs we estimate the FWHMrest of the H line as km sec-1 using a single Gaussian fit. This is 500–1000 km sec-1 broader than the mean of the individual spectra, suggesting there may be an undetected broad component present in them. More secure estimates of the line widths would either need observations of stronger emission lines such as H which are not available for these sources, or much deeper observations.
The FWHMrest of the Balmer emission lines in those SMGs with AGN-like features (but omitting the three sources classified as “QSO”), are 1000–3000 km sec-1. They are at least 1000–2000 km sec-1 lower than the average FWHM of QSOs at –2.1 measured from H and/or Mgii lines (Jarvis & McLure 2006) suggesting that the SMGs host lower mass SMBHs. This would support the claims of Alexander et al, (2005a,b; see also Borys et al. 2005) based on Eddington-limited assumptions.
The similarities of the rest-frame optical spectral features of some SMGs to NLS1s implies rapid growth of the SMBH in SMG’s nuclei. A total of 5/9 of the SMGs classified as “AGN” in our sample have relatively narrow FWHMrest (up to –3700 km sec-1) for their H or H emission lines, and 3/5 show marginal Feii emission. Therefore, the Eddington-limited accretion determined for local NLS1 galaxies may also be appropriate for SMGs. Assuming this, the measured line-widths are then consistent with the estimate of the central BH masses derived from their X-ray luminosities under the assumption of Eddington-limited accretion (, Alexander et al. 2005a). However, this conclusion appears to be undermined by the fact that three of these NLS1-like SMGs display high () [Oiii]/H ratios which far exceed the NLS1 definition of [Oiii]/H , and thus these comparisons may not be appropriate.
4.3.2 The origin of [Oiii] excesses in SMGs
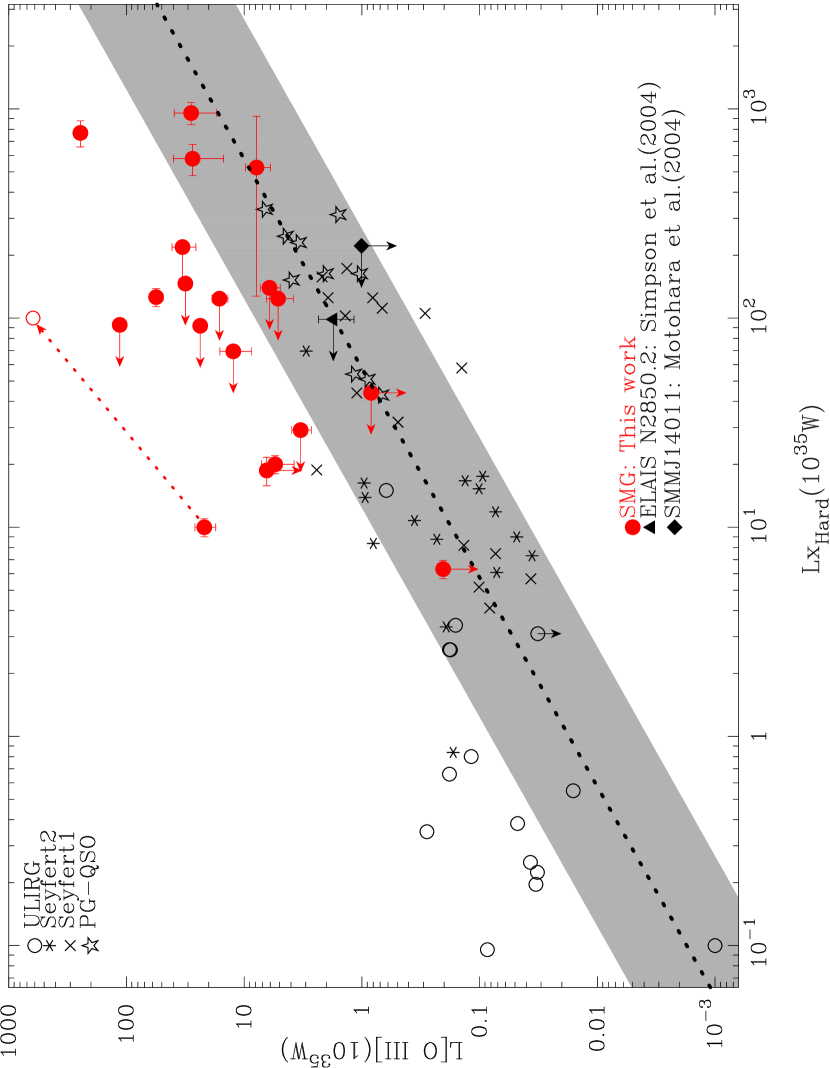
To further test the claim that SMGs have small SMBH masses we compare the [Oiii] and hard X-ray luminosities. There is a well-studied correlation between the hard X-ray and the optical [Oiii] emission line luminosities in local AGN (e.g. Mulchaey et al. 1994). This correlation can be used to gauge the black hole masses and the accretion rates of AGNs within our sample.
In Figure 7, we show the hard X-ray versus [Oiii] luminosities of the SMGs (uncorrected for any extinction/absorption). All 22 SMGs in our sample have hard X-ray coverage, but of varying depth: CDFN: Alexander et al. (2003), CFRS 03hr: Waskett et al. (2004), SSA13: Mushotzky et al. (2000), SSA22: Basu-Zych & Scharf (2005), and ELAIS N2: Manners et al. (2003). We adopt the hard X-ray fluxes from these observations, although 9/22 of them yield only the upper limits. For comparison, we also plot observations of local ULIRGs (Ptak et al. 2003; Franceschini et al. 2003), as well as Seyfert 1 and Seyfert 2 galaxies and the PG QSOs, representative of more luminous type 1 AGNs (Alonso-Herrero et al. 1997; Mulchaey et al. 1994). All of these comparison samples are the observed luminosities: there are no extinction corrections applied to either the X-ray or [Oiii] measurements.
Figure 7 also shows the relation for Seyfert 2 galaxies suggested by Mulchaey et al. (1994). Compared to the QSOs and Seyfert 1 galaxies, which are selected to represent unabsorbed hard X-ray sources, the majority of our SMGs are typically an order of magnitude brighter in [Oiii] for a given hard X-ray luminosity. We note that a similar excess of [Oiii] emission is also seen in local ULIRGs.
Could this apparent excess be due to absorption/extinction? The typical Hydrogen column densities to the AGN in SMGs have been determined by Alexander et al. (2005b), yielding N cm-2, with corrections to their hard X-ray luminosities of 2.5–20 . Equally, the typical [Oiii] luminosity correction, adopting the extinction estimated from the Balmer decrement, , is also approximately a factor ten: where H/H is assumed to be 3.0 (see Bassani et al. 1999). Unfortunately we have only one source (SMM J123549.44+621536.8) with reliable estimates of the Hi column density and reddening correction which has and corrections to the hard X-ray and [Oiii] luminosities respectively and with yields corrected luminosities of erg sec-1 and erg sec-1 respectively (Figure 7).
As the extinction corrections for [Oiii] and hard X-ray luminosities run parallel to the trend in Figure 7, the [Oiii] excess can not be explained by a simple reddening effect. We also caution that the reddening corrections applied to the [Oiii] fluxes are uncertain since [Oiii] may arise in external shocks which suffer much less extinction than the H/H ratio suggests. We also note that the apparent [Oiii] excess could arise simply due to the relatively shallow X-ray coverage in several of our fields where the sources only have upper-limits on their hard X-ray fluxes. However the fact that 3/4 sources with [Oiii] and hard X-ray detections from the CDFN, which has by-far the best X-ray data, show the excess provides good evidence for the reality of this feature.
While some of the [Oiii] flux we see arises from the obscured AGN, we suggest that the excess [Oiii] flux arises, at least in part, from shock-induced (“superwind”) activity. There are some cases of plausible “superwind” driven [Oiii] excesses seen in our SMG sample as seen by the structured [Oiii] line profiles (asymmetric/broad/multi-peaked) and the spatially extended emission (Figures 1 & 2; see also Smail et al. 2003).
In order to examine the possibility that shock-induced gas causes the excess [Oiii] emission, we first search for the signature of shock-excited nebular emission using the simple criterion of [Nii]/H and [Sii]/H . Using the line ratios from the stacked spectrum of SMGs in Swinbank et al. (2004) we find that they lie outside of this shock induced criterion. However, this criterion is only valid for the shocks with large outflow velocities and a relatively weak starburst radiation field (Veilleux et al. 2005) and therefore may not be applicable to the SMGs. Another test is to use the line ratios of [Oiii]/[Oiii] and/or [Nii]/[Nii], which can be used to estimate the temperature of the nebular gas. These ratios will provide robust estimates of electron temperature of the emission nebulae, yielding high ( K) temperatures if the gas is ionized mainly by shocks (as in the Cygnus Loop) and lower temperature ( K) for photoionization-dominated clouds seen in star-forming regions (Osterbrock 1989). As these methods rely on measurements of relatively weak emission lines [Oiii] and [Nii], only our composite spectra have sufficient signal to noise to be useful. From the composite spectrum in Figure 3 and also from the total SMG composite spectrum in Swinbank et al. (2004), we derive an upper limit on [Oiii]/[Oiii] , and [Nii]/[Nii]. Both ratios imply an upper limit to the electron temperature of less than 20,000 K. This is consistent with the expected temperature in photoionization-dominated clouds (with an electron density of cm-2). If the electron density is higher than this, collisional de-excitation begins to play a role and the estimated temperature is reduced. These results would appear to rule out the dominance of shock excitation similar to that seen in galactic supernova remnants.
As described in Dopita & Sutherland (1995), the optical line ratios of Seyfert 2s can also be explained by fast (300–500 km sec-1) shocks, if the precursor Hii regions in front of the shock absorb most of the UV photons generated by the shocks. The calculated electron temperature is K for this “shock + precursor” model from Dopita & Sutherland (1995), which is consistent with the limit on the electron temperatures in SMGs estimated from our [Nii] and [Oiii] emission line ratios. Thus there is a plausible origin for the [Oiii] excess we see compared to typical AGN: shocks associated with supernova explosions in relatively dense gas environments, where the precursor Hii clouds are still present. Thus we suggests that those sources with high (–10) [Oiii]/H ratios and broad (2000 km sec-1) FWHM of H lines can be explained by a combination of a NLS1-type AGN residing in an environment of shocks associated with supernova explosions in relatively dense gas. This would explain all their observable properties, including the high [Oiii]/H ratios (Dopita & Sutherland 1995).
5. Conclusions
Using near-infrared spectroscopy we have observed the redshifted H the [Oiii] and [Oii] emission lines in a sample of 22 Ultra-luminous Infrared Galaxies at high redshifts. Twenty of the sources in our sample are submillimeter galaxies at –3.5. Combining our observations with previous studies of the H and the [Nii] emission from these galaxies and also with observations of their hard X-ray and far-infrared emission, we have placed constraints on the physical properties of this population. We conclude the following:
-
1.
A majority of our sample (14/22) have spectra which are classified as “AGN” or “QSO” based on several restframe optical spectroscopic diagnostics. Specifically, for those sources with detections of the four emission lines necessary to construct a BPT diagram, 8/9 are classified as “AGN”. It should be noted that there is no confirmed pure starburst galaxy in our sample, although several sources show intermediate spectral properties. This is likely to be caused by our sample selection, which is biased towards galaxies with bright near-infrared magnitudes and also to those exhibiting strong line emission. Thus we caution that our results should not be taken as representative of the whole SMG population.
-
2.
Using the H/H flux ratio we are able to estimate the internal extinction in our SMGs. We measure a median extinction of , which is similar to the extinction measured in local ULIRGs. This value is also consistent with the estimates from the SED fitting in the restframe UV/optical which are derived under the assumption of a dominant dust-reddened young starburst (Smail et al. 2004).
-
3.
We compare the SFRs derived from the dust-extinction-corrected H luminosities with those derived from the far-infrared luminosities, and find reasonable consistency between these for most of the SMGs in our sample. The fact that the corrected H-derived SFRs correspond closely to those estimated from the far-infrared suggests that star-formation is the major contributor to the far-infrared luminosities in SMGs.
-
4.
At least 11/19 of the SMGs in our sample show a clear excess in the ratio of their [Oiii] to X-ray luminosities relative to values for local AGNs. The five sources with the highest [Oiii]/H ratios (), which are classified as “AGN” from our spectral diagnostics, show this [Oiii] excess. One possible explanation for the [Oiii] excess is that it is produced by “Compton-Thick” AGNs. However, this is inconsistent with the column density measurements (NH) from fitting of the X-ray spectra for the sources in CDFN and we argue that this is unlikely in most SMGs. Instead, we suggest that the most plausible cause of the [Oiii] excess is shock-induced emission arising from vigorous star formation (“super-wind” activity). This scenario is supported in several galaxies by spatially extended and/or distorted/multiple [Oiii] emission line profiles. Furthermore, using limits on the electron temperatures from [Oiii] and [Nii] emission line ratios, we can explain the excess [Oiii] emission as arising from shocks in dense regions within these systems.
-
5.
The Balmer line widths in 9/22 sample galaxies exhibit broad emission components with relatively small FWHMs (–3700 km sec-1). Three of them are classified as “QSO”, but have smaller H FWHM (2100–2600 km sec-1) than are typical for QSOs. They also have lower [Oiii]/H ratios and relatively strong Feii emission, both of which are characteristics of local Narrow Line Seyfert 1s. Among the other six sources, only one shows a low [Oiii]/H ratio, and four show high [Oiii]/H ratios (larger than seen in NLS1’s). However, the high [Oiii]/H ratios may arise from [Oiii] excesses due to shock excitation and hence removing this contribution would yield lower ratios more consistent with NLS1 classification. Several of these sources also have tentative evidence for Feii emission, again characteristic of NLS1s. Thus, once account is taken of the potential contribution from shocks to the excess [Oiii] emission, there appears to be close similarities between SMGs and NLS1s. The spectral classification of SMGs as NLS1s may then indicate (as has been claimed for local NLS1s) that SMGs have small mass black holes which are rapidly growing at high accretion rates (Alexander et al. 2005ab; Borys et al. 2005). Deeper spectroscopic observations are essential to search for any obscured broad Balmer lines which might indicate larger SMBH masses and confirm the presence of Feii lines which are common in the NLS1s.
Summarising our results: we conclude that our sample of SMGs contains a population of vigorously star-forming galaxies with high SFRs and strong extinction. The activity in these systems is driving shocks through the dense gas reservoirs they contain and some of this material is being expelled from the galaxies. In addition, many of our sources show evidence for low-mass, but rapidly growing, super-massive black holes. These results confirm the critical place of the submillimeter-bright phase in defining the properties of massive galaxies forming at high redshifts.
References
- Alexander et al. (2003) Alexander, D.M. et al. 2003, AJ 126, 539
- Alexander et al. (2005a) Alexander, D., Smail, I., Bauer, F., Chapman, S.C., Blain, A.W., Ivison, R. 2005a, Nature 434, 738.
- Alexander et al. (2005b) Alexander, D., Smail, I., Bauer, F., Chapman, S.C., Blain, A.W., Ivison, R. 2005b, ApJ 632, 736
- Alonso-Herrero et al. (1997) Alonso-Herrero, A., Ward, M.J., & Kotilainen, J.K. 1997, MNRAS288, 977
- Baldwin et al. (1981) Baldwin, J.A., Phillips, M.M. & Terlevich, R. 1981, PASP 93, 5
- Barger et al. (1998) Barger, A.J., Cowie, L.L., Sanders, D.B., Fulton, E., Taniguchi, Y., Sato, Y., & Okuda, H. 1998, Nature 394, 248
- Bassani et al. (1999) Bassani, L., Dadina, M., Maiolino, R., Salvati, M., Risaliti, G., Della Cesa, R., Matt, G. & Zamorani, G. 1999, ApJS 121, 473
- Basu-zych & Scharf (2004) Basu-zych, A., & Scharf, C. 2004, ApJ 615, L85
- Bautz et al. (2000) Bautz, M.W. et al. 2000, ApJ 543, L119
- Blain et al. (1999) Blain, A. W., Smail, I., Ivison, R. J., & Kneib, J.-P. 1999, MNRAS 302, 632
- Blain et al. (2002) Blain, A.W., Smail, I., Ivison, R.J., Kneib, J.-P. & Frayer, D.T. 2002, Phys. Rep. 369, 111
- Blain et al. (2004) Blain, A.W., Chapman, S.C., Smail, I. & Ivison, R.J. 2004 ApJ 611, 52
- Borys et al. (2005) Borys, C., Smail, I., Chapman, S.C., Blain, A.W., Alexander, D.M., & Ivison, R.J. 2005, ApJ 635, 853
- Calzetti et al. (2000) Calzetti, D., Armus, L., Bohlin, R.C., Kinney, A.L., Koornneef, J. & Storch-Bergmann, T. 2000, ApJ 533, 682
- Chapman et al. (2003a) Chapman, S.C., Blain, A.W., Ivison, R.J. & Smail, I. 2003a, Nature 422, 695
- Chapman et al. (2003b) Chapman, S.C., Windhorst, R., Odewahn, S., Yan, H. & Conselice, C. 2003b, ApJ 599, 92
- Chapman et al. (2004) Chapman, S.C., Blain, A.W., Smail, I., & Ivison, R. 2004a, ApJ 614, 671
- Chapman et al. (2005) Chapman, S.C., Blain, A.W., Smail, I., & Ivison, R. 2005, ApJ 622, 772
- Collin et al. (2004) Collin, S. & Kawaguchi, T. 2004, A&A 426, 797
- Condon et al. (1991) Condon, J.J., Anderson, M.L. & Helou, G. 1991, ApJ 376, 95
- Cowie et al. (2002) Cowie, L. L., Barger, A. J., & Kneib, J.P. 2002, AJ 123, 2197
- (22) Desai, V. et al. 2006, ApJ 641, 133
- Dopita & Sutherland (1995) Dopita, M.A., & Sutherland, R.S. 1995 ApJ 455, 468
- Fabian et al. (2000) Fabian, A.C. et al. 2000 MNRAS 315, L8
- Ferrarese et al. (2000) Ferrarese, L., & Merritt, D. 2000, ApJ 539, L9
- Flores et al. (2004) Flores, H., Hammer, F., Elbaz, D., Cesarsky, C.J., Liang, Y.C., Fadda, D. & Gruel, N. 2004, A&A 415, 885
- Franceschini et al. (2003) Franceschini, A. et al. 2003, MNRAS 343, 1181
- Frayer et al. (2003) Frayer, D.T., Armus, L., Scoville, N.Z., Blain, A.W., Reddy, N.A., Ivison, R.J. & Smail, I. 2003, AJ 126, 73
- Garrett (2002) Garrett, M.A. 2002, A&A 384, L19
- Gaskell & Ferland (1984) Gaskell, C.M. & Ferland, G.I. 1984, PASP 96, 393
- Gebhardt et al. (2000) Gebhardt, K., et al. 2000, ApJ 543, L5
- Granato et al. (2004) Granato, G.L., De Zotti, G., Silva, L., Bressan, A. & Danese, L. 2004, ApJ 600, 580
- Goodrich (1989) Goodrich, R.W. 1989, ApJ 342, 224
- Greve et al. (2004) Greve, T.M., Ivison, R.J., Bertoldi, F., Stevens, J.A., Dunlop, J.S., Lutz, D. & Carilli, C.L. 2004, MNRAS 354, 779
- Greve et al. (2005) Greve, T.M. et al. 2005, MNRAS 359, 1165
- Halpern & Steiner (1983) Halpern, J.P. & Steiner, J.E. 1983, ApJ 269, L37
- Hawarden et al. (2001) Hawarden, T.G., Leggett, S.K., Letawsky, M.B., Ballantyne, D.R. & Casali, M. 2001, MNRAS 325, 563
- Heckman et al. (2004) Heckman, T.M., Kauffmann, G., Brinchmann, J., Charlot, S., Tremonti, C. & White, S. 2004, ApJ 613, 109
- Hughes et al. (1998) Hughes, D.H. et al. 1998, Nature 394, 241
- Holland et al. (1999) Holland, W.S. et al. 1999, MNRAS 303, 659
- Houck et al. (2005) Houck, J.R. et al. 2005, ApJ 622, L105
- Ivison et al. (2006) Ivison, R.J. et al. 2006, ApJ in press (astro-ph/0607271)
- Iwamuro et al. (2001) Iwamuro, F., Motohara, K., Maihara, T., Hata, R. & Harashima, T. 2001, PASJ 53, 355
- Iye et al. (2004) Iye, M. et al. 2004, PASJ 56, 381
- Jarvis & McLure (2006) Jarvis, M.J. & McLure, R.J. 2006, MNRAS in press (astro-ph/0603231)
- Kauffmann et al. (2003) Kauffmann, G. et al. 2003, MNRAS 346, 1055
- Kawakatu et al. (2003) Kawakatu, N., Umemura, M. & Mori, M. 2003, ApJ 583, 85
- Kewley et al. (2001) Kewley, L., Dopita, M., Sutherland, R., Heisler, C., & Trevena, J. 2001, ApJ 556, 121
- Kewley et al. (2002) Kewley, L., Geller, M.J., Jansen, R.A & Dopita, M.A. 2002, AJ 124, 3135
- Kennicutt (1998) Kennicutt, R. C., Jr. 1998, ARA&A 36, 189
- Kovacs et al. (2006) Kovacs, A., et al. 2006, ApJ, in press (astro-ph/0604591)
- Ledlow et al. (2002) Ledlow, M.J., Smail, I., Owen, F.N., Keel, W.C., Ivison, R.J. & Morrison, G.E. 2002, ApJ 577, L79
- Lilly et al. (1999) Lilly, S.J., Eales, S.A., Gear, W.K.P., Hammer, F., Le Fevre, O., Crampton, D., Bond, J.R., & Dunne, L. 1999, ApJ 518, 641
- Lutz et al. (2005) Lutz, D., Yan, L., Armus, L., Helou, G., Tacconi, L.J., Genzel, R. & Baker, A.J. 2005, ApJ 632, L13
- Maraston (2006) Maraston, C., 2006, MNRAS in press
- Manners et al. (2003) Manners, J.C. et al. 2003, MNRAS 343, 293
- Marconi et al. (2003) Marconi, A., & Hunt, L. K. 2003, ApJ 589, L21
- Motohara et al. (2002) Motohara, K. et al. 2002, PASJ 54, 315
- Motohara et al. (2005) Motohara, K. et al. 2005, AJ 129, 53
- Mulchaey et al. (1994) Mulchaey, J.S. et al. 1994, ApJ 436, 586
- Mushotzky et al. (2000) Mushotzky, R.F., Cowie, L.L., Barger, A.J. & Arnaud, K.A. 2000, Nature 404, 459
- Neri et al. (2003) Neri, R., et al. 2003, ApJ 597, L113
- Osterbrock (1985) Osterbrock, D.E. & Pogge, R.W. 1985, ApJ 297, 166
- Osterbrock (1989) Osterbrock, D.E. 1989, “Astrophysics of Gaseous Nebulae and Active Galactic Nuclei”, University Science Book
- Ptak et al. (2003) Ptak, A., Heckman, T., Levenson, N.A., Weaver, K. & Strickland, D. 2003, ApJ 592, 782
- Schmitt et al. (1996) Schmitt, H.R., Bica, E. & Pastoriza, M.G. 1996, MNRAS 278, 965
- Scott et al. (2002) Scott, S., et al. 2002, MNRAS 331, 817
- Shopbell et al. (1998) Shopbell, P.L. & Bland-Hawthorn, J. 1998, ApJ 493, 129
- Simpson et al. (2004) Simpson, C., Dunlop, J.S., Eales, S.A., Ivison, R.J., Scott, S.E., Lilly, S.J., & Webb, T.M.A. 2004, MNRAS 353, 179
- Smail et al. (1997) Smail, I., Ivison, R.J. & Blain, A.W. 1997, ApJ 490, L5
- Smail et al. (2002) Smail, I., Ivison, R.J., Blain, A.W. & Kneib, J.-P. 2002, MNRAS 331, 495
- Smail et al. (2003) Smail, I., Chapman, S.C., Ivison, R.J., Blain, A.W., Takata, T., Heckman, T.M., Dunlop, J.S., & Sekiguchi, K. 2003, MNRAS 342, 1185
- Smail et al. (2004) Smail, I., Chapman, S.C., Blain, A.W. & Ivison, R. 2004, ApJ 616, 71
- Soucail et al. (1999) Soucail, G., Kneib, J.-P., Bezecourt, J., Metcalfe, L., Altieri, B. & Le Borgne, J.F. 1999, A&A343, L70
- Swinbank et al. (2004) Swinbank, M., Smail, I., Chapman, S.C., Blain, A.W., Ivison, R. & Keel, W.C. 2004, ApJ 617, 64
- Swinbank et al. (2005) Swinbank, M. et al. 2005, MNRAS 359, 401
- Swinbank et al. (2006) Swinbank, M. Chapman, S.C., Smail, I., Lindner, C., Borys, C., Blain, A.W., Ivison, R. & Lewis, G.F. 2006, MNRAS in press (astro-ph/0606372)
- Tacconi et al. (2006) Tacconi, L. et al. 2006, ApJ 640, 228
- Tecza et al. (2004) Tecza, M. et al. 2004, ApJ 605, L109
- Tremonti et al. (2004) Tremonti, C.A. et al. 2004, ApJ 613, 898
- van Dokkum et al. (2004) van Dokkum, P.G. et al. 2004, ApJ 611, 703
- Veilleux & Osterbrock (1987) Veilleux, S. & Osterbrock, D.E. 1987, ApJS 63, 295
- Veilleux, Kim & Sanders (1999) Veilleux, S., Kim, D.-C. & Sanders, D.B. 1999, ApJ 522, 113
- Veilleux, Cecil & Bland-Hawthorn (2005) Veilleux, S., Cecil, G. & Bland-Hawthorn, J. 2005, ARA&A 43, 769
- Wandel (2002) Wandel, A. 2002, ApJ 565, 762
- Waskett et al. (2004) Waskett, T.J.,Eales, S.A., Gear, W.K., McCracken, H.J., Brodwin, M., Nandra, K., Laird, E.S., & Lilly, S. 2004, MNRAS 350, 785
- Willott et al. (2003) Willott, C. et al. 2003, MNRAS 339, 397
- Yan et al. (2005) Yan, L., Chary, R., Armus, L., Teplitz, H., Helou, G., Frayer, D., Fadda, D., Surace, J. & Choi, P. 2005, ApJ 628, 604

![[Uncaptioned image]](/html/astro-ph/0607580/assets/x2.png)
![[Uncaptioned image]](/html/astro-ph/0607580/assets/x3.png)
| Object | texpaain seconds. | Observation Date | Bands | LFIRbbFIR luminosity in 10 | FHXccHard X-ray flux in 1016 erg sec-1 cm-2 | Comment |
|---|---|---|---|---|---|---|
| Subaru/OHS Observation | ||||||
| SMMJ123549.44+621536.8 | 7200 | Apr 6 2004 | J&H | 6.8ddSwinbank et al. (2004) | 12.01.4jjAlexander et al. (2003) | |
| SMMJ123606.85+621021.4 | 7200 | Feb 15 2005 | J&H | 8.7ddSwinbank et al. (2004) | 7.41.4jjAlexander et al. (2003) | |
| SMMJ123622.65+621629.7 | 7200 | Apr 7 2004 | J&H | 9.0ddSwinbank et al. (2004) | 11.01.4 jjAlexander et al. (2003) | |
| SMMJ123635.59+621424.1 | 7200 | Feb 16 2005 | J&H | 7.5ddSwinbank et al. (2004) | 25.01.4jjAlexander et al. (2003) | |
| SMMJ123716.01+620323.3 | 4000 | Feb 16 2005 | J&H | 6.3eeAlexander et al. (2005b) | 74.01.4jjAlexander et al. (2003) | |
| SMMJ123721.87+621035.3 | 7200 | Jun 24 2004 | J&H | 0.43eeAlexander et al. (2005b) | 21.01.4jjAlexander et al. (2003) | |
| SMMJ131215.27+423900.9 | 600 | Feb 16 2005 | J&H | 13.9ddSwinbank et al. (2004) | 190.023.0kkMushotzky et al. (2000) | |
| SMMJ131222.35+423814.1 | 2000 | Jun 25 2004 | J&H | 12.7ffSmail et al. (2004) | 120.020.0kkMushotzky et al. (2000) | |
| SMMJ163639.01+405635.9 | 7200 | Jun 24 2004 | J&H | 5.5ddSwinbank et al. (2004) | 22.0llManners et al. (2003) | |
| SMMJ163650.43+405734.5 | 7000 | May 18 2003 | J&H | 50.5ddSwinbank et al. (2004) | 22.0llManners et al. (2003) | Smail et al. (2003) |
| MMJ163655+4059 | 3600 | Apr 7 2004 | J&H | 10.9ddSwinbank et al. (2004) | 150.021.0llManners et al. (2003) | |
| SMMJ163706.51+405313.8 | 7200 | Apr 6 2004 | J&H | 7.2ddSwinbank et al. (2004) | 22.0llManners et al. (2003) | |
| SMMJ221733.02+000906.0 | 3000 | Jun 24 2004 | J&H | 1.9ffSmail et al. (2004) | 28.0mmBasu-Zych & Scharf (2005) | |
| SMMJ221733.79+001402.1 | 7200 | Jun 25 2004 | J&H | 4.9ddSwinbank et al. (2004) | 28.0mmBasu-Zych & Scharf (2005) | |
| VLT/ISAAC Observation | ||||||
| SMMJ02399-0134 | 4500 | Nov 24,25 2004 | J | 6.5hhSmail et al. (2002) | 32.05.0nnBautz et al. (2000) | |
| 2400 | Nov 25 2004 | z | ||||
| SMMJ030227.73+000653.5 | 6000 | Nov 23 2004 | J | 5.8ddSwinbank et al. (2004) | 60.010.0ooWaskett et al. (2004) | |
| RGJ030257.94+001016.3 | 4500 | Nov 23 2004 | H | 7.7ddSwinbank et al. (2004) | 60.010.0ooWaskett et al. (2004) | |
| SMMJ105702.50-033602.6 | 4500 | Nov 23 2004 | H | 5.0iivan Dokkum et al. (2004) | 10.0iivan Dokkum et al. (2004) | |
| SMMJ221737.39+001025.1 | 9000 | Nov 23,24 2004 | K | 21.0ffSmail et al. (2004) | 28.0mmBasu-Zych & Scharf (2005) | |
| 6000 | Nov 25 2004 | H | ||||
| Keck/NIRSPEC Observation | ||||||
| SMMJ09431+4700(H6) | 2400 | Apr 8 2004 | K | 15.0ggLedlow et al. (2002) | 13.0ggLedlow et al. (2002) | |
| SMMJ09431+4700(H7) | 2400 | Apr 8 2004 | K | 15.0ggLedlow et al. (2002) | 13.0ggLedlow et al. (2002) | |
| SMMJ131201.17+424208.1 | 2400 | Apr 8 2004 | K | 20.2ffSmail et al. (2004) | 52.840.0kkMushotzky et al. (2000) | |
| From literature | ||||||
| SMMJ04431+0210 | 3.5hhSmail et al. (2002) | — | Frayer et al. (2003) | |||
| SMMJ14011+0252(J1) | 6.8hhSmail et al. (2002) | 44.0ppFabian et al. (2000) | Motohara et al.(2005) | |||
| SMMJ163658.19+410523.8 | 10.9ddSwinbank et al. (2004) | 22.0llManners et al. (2003) | Simpson et al.(2004) | |||
| Object | aabased on [Oiii] line measurement. | H flux | H flux | [O III]λ5007 flux | [O III]λ4959 flux | [O II]λ3727 flux | Class | rest FWHM | Comment | ||
|---|---|---|---|---|---|---|---|---|---|---|---|
| 10-16erg cm-2 sec-1 | UV | Hα | Opt | kmsec-1 | |||||||
| SMMJ02399-0134 | 1.061ccbased on [Oii] line measurement. | 75.8 15.0 | 11.0 | 11.0 | 11.0 | — | AGN | AGN | — | 1530500bbbased on H line measurement. | |
| SMMJ030227.73+000653.5 | 1.408 | 15.2 2.0 | 1.9 1.1 | 10.7 3.2 | 7.2 2.6 | — | SB | AGN | AGN | 100 | |
| RGJ030258.94+001016.3 | 2.239 | 1.8 0.5 | 0.3 | 9.2 2.1 | 0.85 0.30 | — | int | AGN | AGN | — | |
| SMMJ09431+4700(H6) | 3.350 | — | 0.3 0.2 | 1.7 0.3 | 0.7 0.4 | — | SB | — | SB? | 35050 | Extended [Oiii] |
| SMMJ09431+4700(H7) | 3.347 | — | 0.15 | 0.5 0.1 | 0.15 | — | — | — | — | — | |
| SMMJ105702.50-033602.6 | 2.423bbbased on H line measurement. | 0.6 0.2 | 0.19 | 0.19 | 0.19 | — | — | SB | — | — | van Dokkum et al. (2004); miss the slit? |
| SMMJ123549.44+621536.8 | 2.195 | 15.0 1.0 | 1.6 1.0 | 6.4 1.3 | 1.9 0.8 | 2.9 0.8 | SB | int | AGN | 2150500 | [Oiii] double peaks and extended |
| SMMJ123606.85+621021.4 | 2.505bbbased on H line measurement. | 2.0 0.3 | 0.043 | 0.043 | 0.043 | 0.043 | SB | int | — | — | slit on companion object? |
| SMMJ123622.65+621629.7 | 2.462ccbased on [Oii] line measurement. | 3.4 0.6 | 0.8 | 0.8 | 0.8 | 2.1 0.5 | SB | SB | — | — | |
| SMMJ123635.59+621424.1 | 2.005 | 11.1 1.2 | — | 2.0 0.6 | 2.4 0.5 | — | AGN | AGN | AGN? | — | |
| SMMJ123716.01+620323.3 | 2.053 | — | 28.1 3.2 | 19.5 2.4 | 9.7 2.2 | — | QSO | — | AGN | 2130500 | multiple peaks and extended [Oiii] |
| SMMJ123721.87+621035.3 | 0.979bbbased on H line measurement. | 6.2 1.1 | — | — | — | — | — | SB | — | — | |
| SMMJ131201.17+424208.1 | 3.408 | — | 0.180.15 | 0.790.19 | 0.270.19 | — | AGN | — | AGN? | — | |
| SMMJ131215.27+423900.9 | 2.555 | 11.8 1.0 | 3.1 2.6 | 5.6 2.2 | 2.2 1.6 | 0.23 | QSO | — | AGN | 2540500 | |
| SMMJ131222.35+423814.1 | 2.560 | — | 12.1 4.5 | 5.5 2.5 | 2.6 2.5 | 2.0 1.5 | QSO | — | AGN | 25801000 | |
| SMMJ163639.01+405635.9 | 1.485ccbased on [Oii] line measurement. | 7.3 0.7 | 0.7 0.5 | 2.5 0.5 | 1.1 0.4 | — | SB | SB | int | 1400 | Extended H |
| SMMJ163650.43+405734.5 | 2.380 | 14.2 1.5 | 2.3 0.6 | 27.0 2.1 | 6.8 1.3 | 14.0 0.8 | int | AGN | AGN | 3720500 | Reevaluated after Smail et al. (2003) |
| MMJ163655+4059 | 2.605 | 18.4 2.4 | 2.7 1.0 | 47.1 1.6 | 15.7 1.6 | 3.6 0.9 | AGN | AGN | AGN | 2410600 | Blue wings in H and [Oiii] |
| SMMJ163706.51+405313.8 | 2.373 | 7.4 1.4 | 0.6 0.3 | 5.7 0.6 | 1.9 0.6 | 1.0 0.3 | AGN | AGN | AGN | 1590500 | |
| SMMJ221733.02+000906.0 | 0.926bbbased on H line measurement. | 9.6 1.2 | — | — | — | — | — | SB | — | — | |
| SMMJ221733.79+001402.1 | 2.551 | 8.5 3.5 | 1.2 0.6 | 1.2 0.2 | 0.5 | 0.7 0.3 | SB | SB | AGN? | 1860600 | |
| SMMJ221737.39+001025.1 | 2.610bbbased on H line measurement. | 20.7 6.0 | 0.6 0.4 | 6.0 0.4 | 1.2 0.4 | — | SB | AGN | AGN | 29050 | |
| SMMJ04431+0210 | 2.510 | 1.6 0.1 | 0.3 | 0.4 0.1 | — | — | — | AGN? | AGN | — | Frayer et al. (2003) |
| SMMJ14011+0252(J1) | 2.565 | 1.3 0.4 | 0.3 0.1 | 0.2 | 0.2dddetected in Tecza et al. 2004 | 0.40.1 | SB | SB | SB | — | Motohara et al. (2005) |
| SMMJ163658.19+410523.8 | 2.448 | 1.9 0.4 | 0.2 0.1 | 0.4 0.1 | 0.3 0.1 | 0.4 0.2 | SB | SB | AGN | — | Simpson et al. (2004) |
| Composite(all) | 1.0 | 0.7 | 0.4 | 0.3 | 3100500 | ||||||
| Composite(QSO) | 1.0 | 0.36 | 0.19 | 0.12 | 32001000 | ||||||
| Composite(OPT-AGN) | 1.0 | 3.2 | 1.2 | 1.2 | 1730500 | ||||||