XMM-Newton Observations of the Bipolar Planetary Nebulae NGC 2346 and NGC 7026
Abstract
We have obtained X-ray observations of the bipolar planetary nebulae (PNe) NGC 2346 and NGC 7026 with XMM-Newton. These observations detected diffuse X-ray emission from NGC 7026 but not from NGC 2346. The X-ray emission from NGC 7026 appears to be confined within the bipolar lobes of the PN and has spectral properties suggesting a thermal plasma emitting at a temperature of K. The X-ray spectrum of NGC 7026 is modeled using nebular and stellar abundances to assess whether a significant amount of nebular material has been mixed into the shocked-wind, but the results of this comparison are not conclusive owing to the small number of counts detected. Observations of bipolar PNe indicate that diffuse X-ray emission is much less likely detected in open-lobed nebulae than closed-lobed nebulae, possibly because open-lobed nebulae do not have strong fast winds or are unable to retain hot gas.
Subject headings:
planetary nebulae: general — planetary nebulae: individual (NGC 2346, NGC 7026) — X-rays: ISM — stars: winds1. Introduction
Planetary nebulae (PNe) consist of the stellar mass lost by their low- or intermediate-mass stellar progenitors during late evolutionary stages. As a star evolves past the asymptotic giant branch (AGB) phase, the mass loss process changes from a copious slow AGB wind to a tenuous fast wind and the interaction between the fast wind and the AGB wind forms a PN (Kwok, 1983). Frank & Mellema (1994) have demonstrated that this wind-wind interaction can produce the commonly observed elliptical and bipolar morphologies of PNe, although the bipolar morphology requires that either the AGB wind or the fast stellar wind is anisotropic and has a polar angle dependence.
The geometry of the fast wind has often been assumed to be isotropic, but the presence of bipolar jets and collimated outflows in some PNe indicates that the fast wind may span a range of geometries. For wind velocities greater than 300 km s-1, the interaction of the fast stellar wind with the AGB wind will shock-heat the wind material to temperatures greater than 106 K. This shocked fast stellar wind is too tenuous to produce appreciable X-ray emission, but at its interface with the dense nebular material, heat conduction lowers the temperature and mass evaporation raises the density of the shocked fast wind, producing optimal conditions for X-ray emission (Weaver et al., 1977; Zhekov & Perinotto, 1996). Since the hot gas in a PN is associated with shocked fast wind, the distribution of X-ray emission may be used to infer a directional dependence for the fast wind.
Chandra and XMM-Newton observations of elliptical PNe have revealed diffuse X-ray emission confined within their innermost nebular shells, e.g., NGC 2392 (Guerrero et al., 2005a) and NGC 6543 (Chu et al., 2001). The plasma temperatures implied by their X-ray spectra are a few times K. In the case of NGC 6543, the X-ray emission is well resolved, and a clear limb-brightening is observed. Of the ten elliptical PNe observed by either XMM-Newton or Chandra, six show detectable diffuse X-ray emission (Guerrero et al., 2005b).
Chandra has observed many bipolar PNe. While two of them, Mz 3 and NGC 7027, exhibit diffuse X-ray emission confined within the bipolar lobes (Kastner et al., 2001, 2003), the other bipolar PNe (e.g., MyCn 18, M 1-16, M 1-92, M 2-9, OH 231.8+4.2) were not detected. Most of these non-detections are understandable because they are associated with relatively young/exotic bipolar PNe that either have large circumstellar absorption or have collimated outflows with low wind/outflow velocities, 300 km s-1. In order to better characterize diffuse X-ray emission from bipolar PNe, we have used XMM-Newton to observe two carefully chosen bipolar PNe with contrasting lobe morphologies, NGC 2346 and NGC 7026.
NGC 2346 has a butterfly morphology with two open bipolar lobes and a bright equatorial waist that contains large amounts of molecular gas and dust (Walsh et al., 1991; Zuckerman & Gatley, 1988; Su et al., 2004). Its central star is a white dwarf with an A5 companion (Méndez, 1978), forming a single-line spectroscopic binary with a period of 16 days (Méndez & Niemela, 1981). Its nebular gas shows a bipolar velocity field with a dynamic age of 3,500–4,700 yrs (Walsh et al., 1991; Arias et al., 2001). NGC 2346 can be described as an evolved bipolar PN.
NGC 7026 has closed bipolar lobes emanating from a bright ring-like waist (Solf & Weinberger, 1984), and the lobes appear to have multiple components (Cuesta, Phillips, & Mampaso, 1996; López, 2003). Its central star is a hydrogen-deficient WC star (Aller, 1976; Acker & Neiner, 2003). The dynamic age derived from the nebular expansion, 1,000 yrs, suggests that NGC 7026 is a young bipolar PN (Solf & Weinberger, 1984).
The XMM-Newton observations of these two PNe have detected diffuse X-ray emission from NGC 7026, but not from NGC 2346. In this paper, we describe these X-ray observations and their reduction in §2, report our analysis of the observations in §3, and discuss their implications in §4.
2. Observations
NGC 2346 and NGC 7026 were observed with XMM-Newton in Revolution 876 (Obs ID 0200240501) on 2004 September 20 and Revolution 825 (Obs ID 0200240101) on 2004 June 10, respectively. The European Photon Imaging Camera (EPIC), which consists of two MOS and one PN CCD arrays, was used with a medium filter. The two EPIC/MOS cameras were operated in the Full-Frame Mode for a total exposure time of 16.5 ks for NGC 2346 and 19.2 ks for NGC 7026. The EPIC/pn camera was operated in the Extended Full-Frame Mode for a total exposure time of 11.1 ks for NGC 2346 and 14.1 ks for NGC 7026.
The XMM-Newton pipeline products have been processed using the XMM-Newton Science Analysis Software (SAS version 6.1.0) and the calibration files from the Calibration Access Layer available on 2005 April 22. The event files have been screened to eliminate bad events and periods of high background. For the EPIC/MOS observations, only events with CCD patterns 0–12 (similar to grades 0–4) were selected; for the EPIC/pn observation, only events with CCD pattern 0 (single pixel events) were selected. To assess the background rate, we obtained light curves for each instrument in the 10–12 keV energy range, where the counts are dominated by the background. The time intervals with high background, i.e., count rates cnts s-1 for the EPIC/MOS or cnts s-1 for the EPIC/pn, were discarded. The resulting exposure times for the EPIC/MOS and EPIC/pn observations were 16.5 ks and 10.9 ks for NGC 2346 and 15.5 ks and 13.3 ks for NGC 7026, respectively.
3. Results
X-ray emission was clearly detected from NGC 7026 but not from NGC 2346. We therefore describe the results from NGC 7026 first and then determine an upper limit for the X-ray luminosity of NGC 2346.
3.1. NGC 7026: Spatial Properties
To measure the faint X-ray emission from NGC 7026, we used a elliptical source aperture that encompasses the entire optical nebula and a background aperture 5 times as large as the source aperture located at a similar Y-coordinate of the detector. The EPIC/pn observation detected a total of background-subtracted counts, corresponding to a count rate of 8.310-3 cnts s-1. The EPIC/MOS1 and EPIC/MOS2 observations detected and background-subtracted counts, corresponding to count rates of 1.710-3 cnts s-1 and 2.010-3 cnts s-1, respectively.
We have merged the EPIC/pn and EPIC/MOS images to increase the signal-to-noise ratio. The merged EPIC image is displayed in Figure 1a and a smoothed image in Figure 1b. Diffuse X-ray emission is clearly detected. In order to compare the distribution of X-ray emission with the optical nebula, accurate alignment between X-ray and optical images is essential. We have determined the astrometric solution for the EPIC image with an accuracy of 05, based on stellar sources that are detected in both this X-ray image and the Digitized Sky Survey. The relative alignment of the EPIC image and a Nordic Optical Telescope (NOT) [N II] image in Figure 1c is accurate to 06.
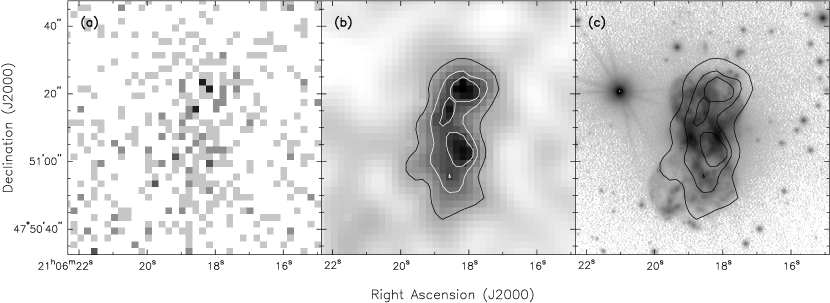
The distribution of diffuse X-ray emission from NGC 7026 is elongated in the North-South direction, matching the polar axis of the nebula. The position and orientation of the 50% contour of the smoothed EPIC image follow the bipolar lobes shown in the NOT [N ii] image (Fig. 1c). Furthermore, the X-ray emission shows two peaks that are projected within the bipolar lobes north and south of the central waist of NGC 7026. These excellent correspondences suggest that the diffuse X-ray emission from NGC 7026 is all confined within its bipolar lobes, similar to what is seen in the bipolar PN Mz 3 (Kastner et al., 2003).
We have simulated the surface brightness of diffuse X-ray emission assuming the hot gas is distributed in two spherical shells with fractional shell thickness () of 0.1, 0.2, 0.5, and 1.0. We find that the small number of counts and limited angular resolution precludes even a rough estimate of the geometry. Similarly, we cannot determine whether the local minimum along the waist is caused by higher circumstellar absorption.
3.2. NGC 7026: Spectral Properties


X-ray spectra of NGC 7026 have been extracted from the event files of the three XMM-Newton EPIC cameras using the same source and background apertures described in §3.1. Due to the limited number of counts detected by the EPIC/MOS observations, we will limit the spectral analysis to the EPIC/pn spectrum shown in Figure 2. This spectrum is soft, peaking at keV with a nearly flat distribution from 0.2 to 0.4 keV. Emission between 0.7 and 1.1 keV is detected but with low S/N ratio. There is no detectable emission at energies greater than 1.25 keV.
The EPIC/pn spectrum of NGC 7026, similar to other PNe, is suggestive of thermal plasma emission with its broad peak at 0.5 keV corresponding to emission from the He-like triplets of N vi at 0.43 keV and O vii at keV. In order to model this X-ray spectrum, we have adopted the MEKAL thin plasma emission model (Kaastra & Mewe, 1993; Liedahl et al., 1995). Spectral fits were carried out by folding the thin plasma emission model spectrum through the EPIC/pn response matrix, and comparing the modeled spectrum to the observed EPIC/pn spectrum in the 0.25–1.5 keV energy range after the spectrum was resampled to energy bins with at least 16 counts. The best-fit was judged based on the statistics. It was found that the spectral fits did not accurately constrain the absorption column density, , if it was allowed to vary as a free parameter. We therefore held fixed at 3.21021 cm-2, estimated from the observed logarithmic extinction in the H line (Kwitter & Henry, 2001; Hyung & Feibelman, 2004) and the canonical gas-to-dust ratio of atoms cm-2 mag-1 (Bohlin et al., 1978). The X-ray-emitting gas consists of shocked fast wind and mixed-in nebular gas. As the wind abundances determined from UV spectroscopic observations (Koesterke, 2001; Hamann et al., 2005) differ from the nebular abundances determined from optical spectra (Kwitter & Henry, 2001), we have made spectral fits using wind or nebular abundances separately.
The first spectral fits use the nebular abundances, with the number ratio of He, O, N, Ne, Ar, Cl, and S to hydrogen being 0.14, 7.310-4, 5.510-4, 1.810-4, 3.110-6, 3.710-7, and 1.410-5, respectively (Kwitter & Henry, 2001). The corresponding nebular abundances of these elements relative to the solar values (Anders & Grevesse, 1989) are 1.43, 0.86, 4.9, 1.8, 1.5, 2.0, and 0.96, respectively. Solar abundances are used for the other elements, which have low abundances and are not expected to contribute significantly to the diffuse X-ray emission. We have also assumed solar abundances for the foreground interstellar absorption, and adopted absorption cross-sections from Balucinska-Church & McCammon (1992). The resulting best-fit model with nebular abundances and a fixed is overplotted on the EPIC/pn spectrum in Figure 2a. The plasma temperature of the best-fit model is K (i.e., = 0.095 keV).
The second spectral fits use stellar abundances. The central star of NGC 7026 has been classified as a hydrogen-deficient WC star with the mass-fractions of He, C, and O being 70, 20, and 10%, respectively (Koesterke, 2001; Hamann et al., 2005). In order to make spectral fits using a MEKAL model we have assumed a He/H ratio of 200 and scaled the abundances of C and O according to their mass fractions. Thus, the values adopted for the stellar wind abundances relative to the solar values were 20, 500, and 80 for He, C, and O, respectively. All other abundances were set to zero and the absorption column density, , was again held fixed with a value of 3.21021 cm-2. The resulting best-fit model is shown in Figure 2b. This model with stellar abundances has roughly the same temperature as the best-fit using nebular abundances and a slightly higher reduced . The most obvious difference between the best-fit models using nebular and stellar abundances is that the model with stellar abundances underestimates the emission at 0.5 keV due to the absence of N in the stellar chemical composition. Clearly the quality of both spectral fits are limited by the relatively small number of counts in the X-ray spectrum and it is not possible to convincingly distinguish whether the chemical composition of the X-ray emitting gas in NGC 7026 better matches that of the central star or the nebula.
From the EPIC/pn spectrum we can also determine that the volume emission measure is cm-3, where is the distance to NGC 7026 in pc. The distance has been estimated to be 1700 pc based on the extinction to NGC 7026 (Hyung & Feibelman, 2004) and on the extinction-distance relationship derived by Solf & Weinberger (1984). The observed (absorbed) X-ray flux of NGC 7026 in the 0.2–2.5 keV energy range is ergs cm-2 s-1, and the intrinsic (unabsorbed) X-ray flux is ergs cm-2 s-1. The total X-ray luminosity in the 0.2–2.5 keV energy range is ergs s-1.
3.3. NGC 2346
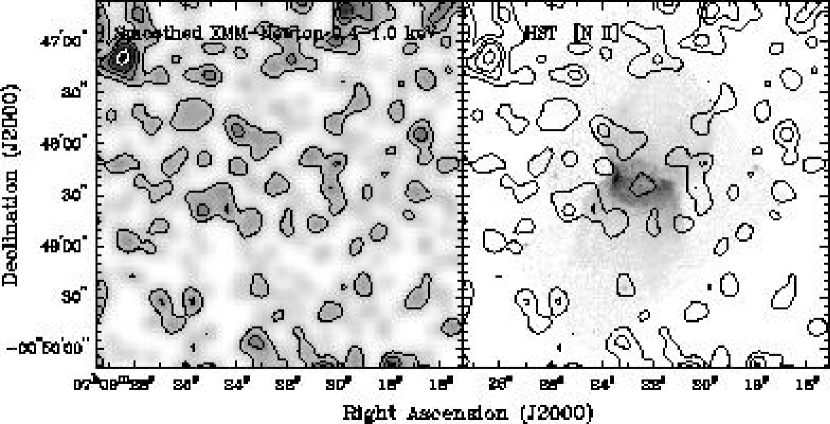
The XMM-Newton observations of NGC 2346 are compared with a Hubble Space Telescope (HST) WFPC2 [N ii] image in Figure 3. There is no statistically significant X-ray emission associated with either the nebula or the central star in these observations. The EPIC/pn observations have been used to derive an upper limit for its X-ray luminosity using a source aperture encompassing the optical nebula. The 3 upper limit for the EPIC/pn count rate in the 0.3-1.25 keV band is 4.510-3 cnts s-1. To derive an upper limit of the intrinsic (unabsorbed) flux we assume a thin plasma emission model with similar temperature and nebular abundances to the one that describes the X-ray emission from NGC 7026 (see §3.2). The foreground absorption is estimated based on the observed logarithmic extinction at the H line, c(H)=0.75 (Ciardullo et al., 1999), which corresponds to a column density of =3.01021 cm-2. At a distance to NGC 2346 of 690 pc (Terzian, 1993), the 3- upper limit of the unabsorbed flux corresponds to an X-ray luminosity 41031 ergs s-1.
4. Discussion
The XMM-Newton observations of NGC 7026 clearly show diffuse X-ray emission while the observations of NGC 2346 do not detect significant X-ray emission. We will now use these observations to discuss the production and evolution of hot gas in bipolar PNe.
4.1. NGC 7026 versus NGC 2346
The spatial distribution of the X-ray emission in NGC 7026 suggests that the X-ray-emitting gas is confined within the bipolar lobes, but its spatial distribution is unknown. Therefore, we define the hot gas filling factor, , as the ratio of the emitting volume to the total nebular volume and use a reference value of 0.5 in our analysis. Using the volume emission measure determined from the spectral fits (in §3.2) and approximating the emitting volume by a 40′′15′′15′′ rectangular box, the rms electron density is cm-3. This density and the best-fit plasma temperature can in turn be used to derive the thermal pressure of the hot gas, dynes cm-2, assuming H and He are fully ionized and that the number ratio of He/H is 0.14 (the nebular abundance).
We can compare this hot gas pressure to the thermal pressure of the warm nebular shell of NGC 7026 to see whether the nebular expansion is driven by the thermal pressure as expected by the Weaver et al. (1977) model. The electron density and temperature reported by Kwitter & Henry (2001) are generally lower than those reported by Hyung & Feibelman (2004). The lowest temperature and density are derived from the [S II] lines, 6,400 K and 3,300 cm-3 (Kwitter & Henry, 2001), resulting in a thermal pressure of dynes cm-2. The temperatures and densities derived from a variety of lines by Hyung & Feibelman (2004) are K and cm-3, resulting in a thermal pressure of dynes cm-2. These measurements were made at the bright nebular waist, where the density is expected to be the highest. While the thermal pressure of the nebular gas is higher than that of the hot gas in the waist region, it is likely that the pressure of the nebular gas in the lobes is comparable to that of the hot gas.
NGC 2346 is a larger and more evolved bipolar PN than NGC 7026. No fast wind from the central star of NGC 2346 has been detected, as the IUE observations of the stellar C IV and N V lines do not show P Cygni profiles (Patriarchi & Perinotto, 1991). If the central star of NGC 2346 had a fast stellar wind in the past, the hot gas resulting from the shocked fast wind has either cooled or is too rarefied to be detected.
While the presence of a strong fast stellar wind is a prerequisite for the production of detectable diffuse X-ray emission, the lobe structure of bipolar PNe may also play an essential role. NGC 2346 has an open-lobe structure and lacks detectable diffuse X-ray emission and NGC 7026 has a closed-lobe structure and detectable X-ray emission. Previous X-ray observations of bipolar PNe have detected only two other nebulae, NGC 7027 and Mz 3, and both have closed-lobe structures. It is possible that open lobes allow shocked-wind to be distributed to a larger volume and the lower density precludes the detection of X-ray emission. In the case of NGC 2346, hot gas is not produced currently because of a lack of fast stellar wind. Even if it had a fast wind in the recent past, its open lobes were not able to retain the shocked stellar wind to prolong the detectability of its diffuse X-ray emission.
X-ray emission is not detected from the central star of either NGC 2346 or NGC 7026. The central star of NGC 2346 is a hot white dwarf with an A5 companion. A hot white dwarf’s photospheric emission can reach the soft X-ray energy range, but is easily absorbed by the nebular gas or foreground interstellar material. A-type stars have neither fast stellar winds nor active coronae, and therefore are not expected to be X-ray sources. Even if the white dwarf possesses an accretion disk, the temperature of the accretion disk can not be high enough to produce X-ray emission. NGC 7026 has a WC-type central star. No X-ray emission has ever been detected from a single WC star even among the massive Wolf-Rayet stars (Oskinova et al., 2003) because of the high opacity in their stellar atmospheres.
4.2. Hot Gas Content of Bipolar PNe
To date, only three bipolar PNe have been detected in X-rays. Among these, Mz 3 has a symbiotic central star and its X-ray emission appears to originate from interactions between its bipolar jets and the nebular material (Kastner et al., 2003). The other two, NGC 7026 and NGC 7027, are bona fide bipolar PNe. The X-ray luminosity of NGC 7026 is one of the highest among all PNe detected in X-rays. Its hot gas mass, 0.002 , is also high compared to other PNe. Note however that these values may be overestimated because the X-ray-emitting lobes may have lower circum-nebular absorption than the waist region where the extinction was measured. The young bipolar PN NGC 7027 has a lower X-ray luminosity and smaller hot gas mass, but a higher hot gas temperature and density (Kastner et al., 2001). The differences between NGC 7026 and NGC 7027 might be due to an evolutionary effect, but more positive X-ray detections of bipolar PNe of intermediate ages are needed to investigate the properties and evolution of their hot gas.
Chandra has observed five other bipolar PNe but none were detected. Based on these non-detections we suggest that future X-ray observations of bipolar PNe should avoid objects that have open bipolar lobes and objects with low velocity outflows (300 km s-1). Instead, observations of objects with closed bipolar lobes, to confine hot gas, and with kinematic ages of no more than a few thousand years would appear best suited for understanding the generation and evolution of hot gas in bipolar PNe.
References
- Acker & Neiner (2003) Acker, A., & Neiner, C. 2003, A&A, 403, 659
- Aller (1976) Aller, L. H. 1976, Mem. Soc. R. Sci. Liège, 9, 271
- Anders & Grevesse (1989) Anders, E., & Grevesse, N. 1989, Geochimica et Cosmochimica Acta 53, 197
- Arias et al. (2001) Arias, L., Rosado, M., Salas, L., & Cruz-González, I. 2001, AJ, 122, 3293
- Balucinska-Church & McCammon (1992) Balucinska-Church, M., & McCammon, D. 1992, ApJ, 400, 699
- Bohlin et al. (1978) Bohlin, R. C., Savage, B. D., & Drake, J. F. 1978, ApJ, 224, 132
- Chu et al. (2001) Chu, Y.-H., Guerrero, M. A., Gruendl, R. A., Williams, R. M., & Kaler, J. B. 2001, ApJ, 553, L69
- Ciardullo et al. (1999) Ciardullo, R., Bond, H. E., Sipior, M. S., Fullton, L. K., Zhang, C.-Y., & Schaefer, K. G. 1999, AJ, 118, 488
- Cuesta, Phillips, & Mampaso (1996) Cuesta, L., Phillips, J. P., & Mampaso, A. 1996, A&A, 313, 243
- Frank & Mellema (1994) Frank, A., & Mellema, G. 1994, ApJ, 430, 800
- Guerrero et al. (2005a) Guerrero, M. A., Chu, Y.-H., Gruendl, R. A., & Meixner, M. 2005a, A&A, 430, L69
- Guerrero et al. (2005b) Guerrero, M. A., Chu, Y.-H., Gruendl, R. A. 2005b, in Planetary Nebulae as Astronomical Tools, Eds. R. Szczerba, G. Stasinska, and S. K. Gorny, AIP Conf. Proc. 804, 157
- Hamann et al. (2005) Hamann, W.-R., Todt, H., & Graefener, G. 2005, in Planetary Nebulae as Astronomical Tools, Eds. R. Szczerba, G. Stasinska, and S. K. Gorny, AIP Conf. Proc. 804, 153
- Hyung & Feibelman (2004) Hyung, S., & Feibelman, W. A. 2004, ApJ, 614, 745
- Kaastra & Mewe (1993) Kaastra, J. S., & Mewe, R. 1993, Legacy, 3, 16, HEASARC, NASA
- Kastner et al. (2003) Kastner, J. H., Balick, B., Blackman, E. G., Frank, A., Soker, N., Vrtílek, S. D., & Li, J. 2003, ApJ, 591, L37
- Kastner et al. (2001) Kastner, J. H., Vrtilek, S. D., & Soker, N. 2001, ApJ, 550, L189
- Koesterke (2001) Koesterke, L. 2001, Ap&SS, 275, 41
- Kwitter & Henry (2001) Kwitter, K. B., & Henry, R. B. C. 2001, ApJ, 562, 804
- Kwok (1983) Kwok, S. 1983, in IAU Symposium 103, Planetary Nebulae, ed. D. R. Flower (Dordrecht: Reidel), 293
- Liedahl et al. (1995) Liedahl, D. A., Osterheld, A. L., & Goldstein, W. H. 1995, ApJ, 438, L115
- López (2003) López, J. A. 2003, Rev. Mex. Astron. y Astrof., 13, 139
- Méndez (1978) Méndez, R. H. 1978, MNRAS, 185, 647
- Méndez & Niemela (1981) Méndez, R. H., & Niemela, V. S. 1981, ApJ, 250, 240
- Oskinova et al. (2003) Oskinova, L. M., Ignace, R., Hamann, W.-R., Pollock, A. M. T., & Brown, J. C. 2003 A&A, 402, 755
- Patriarchi & Perinotto (1991) Patriarchi, P., & Perinotto, M. 1991, A&AS, 91, 325
- Solf & Weinberger (1984) Solf, J., & Weinberger, R. 1984, A&A, 130, 269
- Su et al. (2004) Su, K. Y. L., et al. 2004, ApJS, 154, 302
- Terzian (1993) Terzian, Y. 1997, IAU Symp. 180: Planetary Nebulae, 180, 29
- Weaver et al. (1977) Weaver, R., McCray, R., Castor, J., Shapiro, P., & Moore, R. 1977, ApJ, 218, 377
- Walsh et al. (1991) Walsh, J. R., Meaburn, J., & Whitehead, M. J. 1991, A&A, 248, 613
- Zhekov & Perinotto (1996) Zhekov, S. A., & Perinotto, M. 1996, A&A, 309, 648
- Zuckerman & Gatley (1988) Zuckerman, B., & Gatley, I. 1988, ApJ, 324, 501