Minor Merger Origin for the Circumnuclear Starburst in NGC 7742
Abstract
We present an emission-line diagnostic analysis of integral-field spectroscopic observations that cover the central kiloparsec of NGC 7742. This Sa galaxy hosts a spectacular nuclear starburst ring and nuclear regions characterized by low-ionization emission. The gas in the ring rotates in the opposite sense to the stars in the galaxy, suggesting a recent merging or acquisition event. The combination of integral-field measurements for the H+[N ii] emission lines from DensePak and the H and [O iii] emission from SAURON allow the construction of diagnostic diagrams that highlight the transition from star formation in the nuclear ring to excitation by high-velocity shocks or by a central AGN towards the center. DensePak measurements for the [S ii] line ratio reveal very low gas densities in the nuclear ring, , characteristic of massive H ii regions. Comparison with MAPPINGS III models for starbursts with low gas densities show that the ring is of roughly solar metallicity. This suggests that the gas in the nuclear ring originated in a stellar system capable of substantially enriching the gas metallicity through sustained star formation. We suggest that NGC 7742 cannibalised a smaller galaxy rich in metal-poor gas, and that star formation episodes in the ring have since increased the metallicity to its present value.
Subject headings:
galaxies: spiral – galaxies: structure – galaxies: starburst – galaxies: nuclei1. Introduction
Line emission from galaxies is produced by gas heated and ionized by hot OB stars, AGN, or shocks. To help interpret the spectral properties of massive star forming regions and to recognize the role of the various excitation mechanisms, one can utilize diagnostic diagrams. Veilleux & Osterbrock (1987; hereafter VO87) introduced a diagnostic analysis that is independent of reddening and is based on the ratios of strong emission lines rather close in wavelength. Kewley et al. (2001; hereafter K01) expand upon the VO87 analysis by incorporating in their photoionization code the spectral energy distributions of young stellar clusters predicted by stellar population synthesis models (Starburst 99, Leitherer et al. 1999; PEGASE, Fioc & Rocca-Volmerange 1997). The resulting model grids can discriminate reliably between galaxies hosting an AGN or a nuclear starburst, and in the case of H ii regions, can constrain the metallicity of the starburst and the strength of the ionizing radiation relative to the density of hydrogen atoms (i.e. the ionization parameter, ).
NGC 7742 is a face-on SA(r)b LINER galaxy, whose morphology is dominated by a prominent nuclear ring with a radius of 10 arcsec or (assuming Mpc) 1.0 kpc (Mazzuca et al. 2006). The ring is lined with H ii regions that emit strongly in H (Pogge & Eskridge 1993; Knapen et al. 2006) but the H emission equivalent widths of the H ii regions show no evidence for age gradients, indicating random star formation (Mazzuca et al. 2006). The Palomar survey (Ho et al. 1997) classified the nucleus as a T2/L2 intermediate type, where the emission is representative of a mixture of low-ionization lines (i.e., LINER) and lines associated with star formation (H ii region). The galaxy is not obviously interacting at the moment, but may well form a pair with NGC 7743, which is 50 arcmin (320 kpc) away but within 50 km s-1 in radial velocity. De Zeeuw et al. (2002, hereafter deZ02) show that the gas in NGC 7742 is counterrotating with respect to the stars within the entire field of the SAURON observations. This suggests a recent merging or acquisition event.
The presence of a nuclear starburst ring and an active nucleus of composite nature in NGC 7742 makes this object particularly attractive for integral-field spectroscopy, which can capture the superposition of H ii region and AGN emission-line features. Using the model-based diagnostic diagrams of VO87 & K01, we aim to delineate the gas conditions in the nucleus and the nuclear ring. In a second paper (Sarzi et al. 2006; Paper II) we will extend the analysis presented here to a second nuclear ring galaxy, NGC 4314. Paper II will also contain a more detailed discussion on both data analysis techniques and physical interpretation.
2. Observations and Data Reduction
In this study we combined data from two integral-field units (IFUs), namely DensePak (Barden & Wade 1988) on the WIYN telescope and SAURON (Bacon et al. 2001) on the William Herschel Telescope (WHT). The combined dataset provides us with the key emission lines, , [O iii] , [O i] , [N ii] , , and [S ii] , which are necessary to produce the diagnostic diagrams of VO87 and to constrain the gas density. The SAURON data are from Falcón-Barroso et al. (2006), which covers and [O iii] ; the DensePak data (L. M. Mazzuca et al., in prep.) provides the other lines. Although both instruments are IFUs with similar fields of view (3341 and 3045 arcsec for SAURON and DensePak, respectively) the designs are very different. SAURON is a fully sampled lenslet array, whereas DensePak consists of 89 functional fibers (2.812 arcsec diameter) bonded into a staggered rectangle with center-to-center fiber spacings of 3.75 and 3.25 arcsec, horizontally and vertically. For NGC 7742, SAURON was configured in low-resolution mode, for a spectral resolution of 4.2 Å (FWHM, ). DensePak used the #860 grating centered around , which yields a spectral resolution of 0.97 Å (FWHM, ).
To combine the two datasets, the DensePak spectra were analysed using the procedure of Sarzi et al. (2006), in order to separate the stellar absorption and gas emission contribution to the observed spectra. To describe the stellar continuum we have used linear combinations of single stellar population (SSP) models based on the MILES library of Sánchez-Blázquez et al. (2006), which will be presented in detail in A. Vazdekis et al. (in prep.). These templates are particularly suited to match the DensePak data, owing to their high spectral resolution ( ), and lead to a very good match to the absorption features, such as the prominent line around 6494Å which is due to Calcium and Iron. Given the limited number of absorption lines in the H+[N ii] region, we have used only a restricted number of SSP templates adopting a Salpeter initial mass function, ages of Gyr, and metallicities of . Such an accurate description of the stellar continuum is crucial to correctly estimate the H and [S ii] line fluxes towards the center of NGC 7742, where the strength of the gas emission relative to the stellar continuum (and corresponding absorption features) decreases very sharply. Once the emission-line fluxes were measured, the DensePak integrated-flux field was fitted for each of the three pointings taken during the run to derive the position of the galaxy center. The pointings were then shifted to a common central position, adjusted to the same continuum flux level, which varied for each pointing, and then merged on a regular grid matching the sampling of the SAURON data (i.e., 0.8 x 0.8 arcsec). The same process was then used to merge the emission-line fluxes.
3. Results
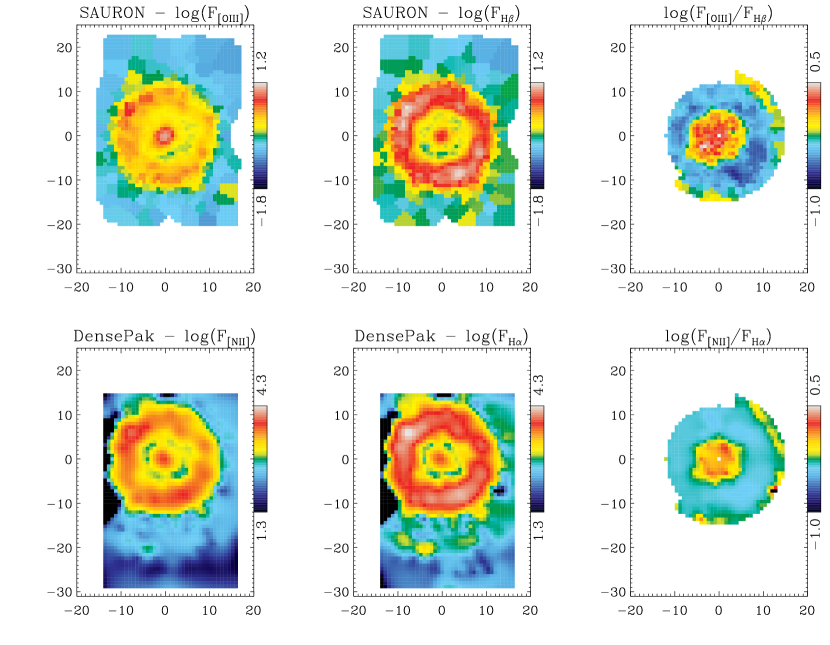
Figure 1 shows the reconstructed images for the distribution of the H and [N ii] emission as measured with DensePak, together with similar maps for the H and [O iii] fluxes obtained with SAURON. Despite the different designs of these two IFUs and the considerably coarser spatial sampling of DensePak, the overall morphology of the recombination and forbidden lines agree very well. The rightmost panels of Fig. 1 show maps for the [N ii] /H and [O iii] /H line ratios, which will be used to construct the corresponding VO87 diagnostic diagram separating star formation from other sources of ionization.
In the following we will constrain the gas density using the ratio of the [S ii] doublet lines (§ 3.1) and present [N ii]/H vs. [O iii]/H and [N ii]/[S ii] vs. [O iii]/H diagnostic diagrams to constrain the role of the various ionizing mechanisms in different regions of NGC 7742 as well as the metallicity of the starburst in the circumnuclear regions (§ 3.2).
3.1. Gas Density
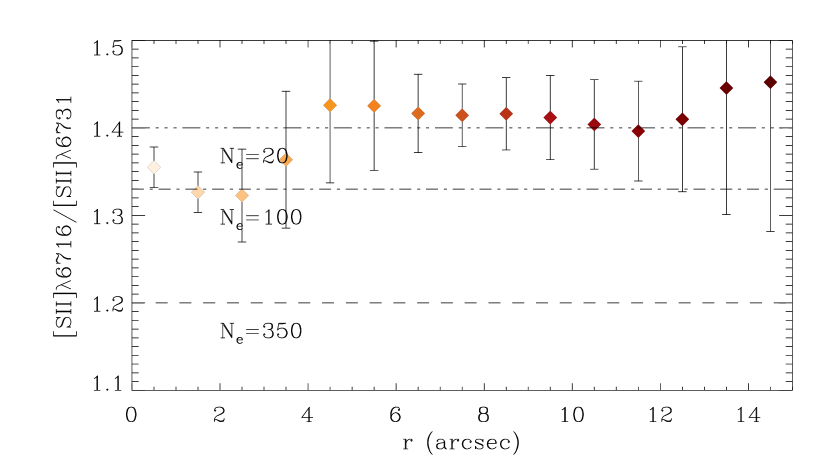
The relative strength of the lines in the [S ii] doublet is a strong function of the gas electron density , only depending weakly on the gas temperature. The observed line ratio can therefore be used to estimate , although for low and high values of , the [S ii] /[S ii] ratio saturates to values of and , respectively (Osterbrock 1989). Figure 2 shows, as a function of galactic radius, the ratio of the [S ii] lines within the region of NGC 7742 considered for the emission-line diagnostic analysis (see Fig. 1). The [S ii] lines ratio indicate, on average, . However, due to the poor sensitivity of this ratio below , we conclude that the ring is predominantly populated by clouds of very low electronic density, . Such low values for are typical of extragalactic H ii regions, but considerably smaller than observed in the central regions of starburst galaxies, where the typical value is within 1 kpc (K01). increases towards the center of NGC 7742, although only to . Following this result, we will adopt the lower option of gas densities, , for the MAPPINGS III photoionization models (K01) that will be used in the next section to further interpret our data.
3.2. Excitation Mechanisms
Among the reddening-insensitive diagnostic diagrams introduced by VO87, the [O i] /H vs. [O iii] /H diagnostic is arguably the best suited to separate OB-star excitation from other excitation sources, since the [O i] emission originates in partially ionized regions arising only in the presence of a hard ionizing spectrum. Unfortunately in NGC 7742 the weak [O i] emission is detected only in the nuclear ring, where the equivalent width of the emission line is the largest. Furthermore, Dopita et al. (2000) showed that the models cannot distinguish precisely between ionization by hot stars and other sources of ionization using the [O i]/H and, to some extent, the [S ii]/H diagnostics, as these ratios can be affected by weak shocks from supernovae.
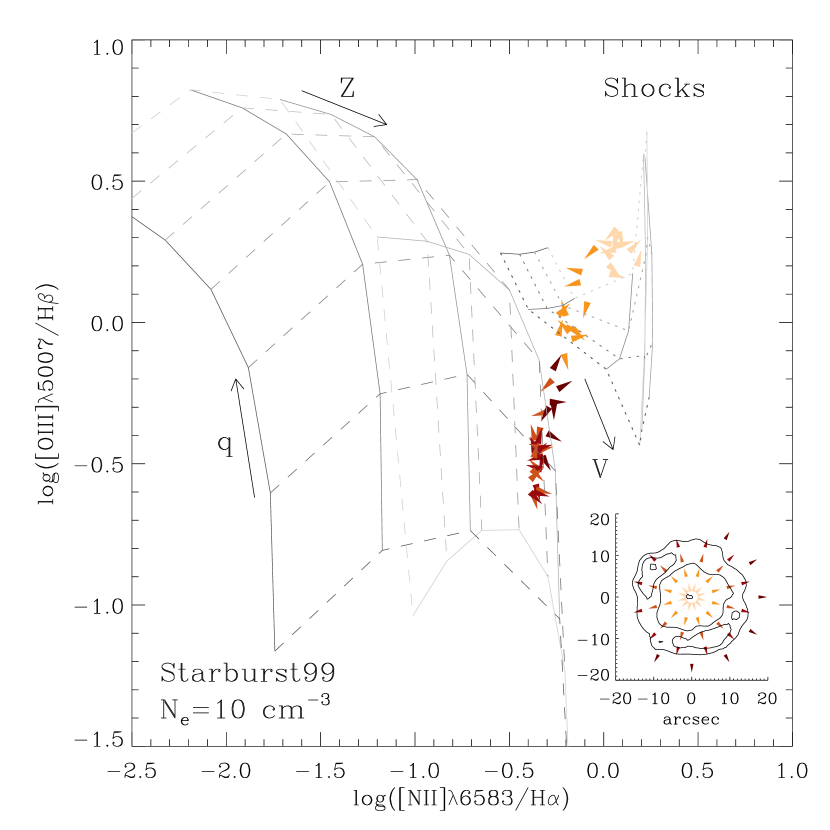
For all these reasons, we thus use the alternative [N ii]/H vs. [O iii]/H diagnostic diagram, which we show in Fig. 3 (left panel) together with the predictions of MAPPINGS III models for H ii regions in an instantaneous starburst or for clouds excited by shocks.111Both sets of models were obtained from the MAPPINGS III portal at http://www.ifa.hawaii.edu/~kewley/Mappings/ The starburst models use a spectral energy distribution obtained from Starburst99 (Leitherer et al. 1999) and assume a range of metallicity for both stars and gas in the starburst and different values of . The shock models assume a range of values for the shock velocity and for the magnetic parameter . For a thorough description of these models see Dopita et al. (2000) and Allen, Dopita & Tsvetanov (1998).
The [N ii]/H vs. [O iii]/H diagram (Fig. 3) clearly separates the emission arising in the nuclear ring (red and orange triangles) from emitting regions both outside (brown) and inside the ring (yellow). The line emission from the ring region is consistent with the predictions of the starburst models, whereas the position of the data points measured outside the ring suggests that shocks may play a role in this region, particularly near the inner edge of the ring. As far as the nuclear regions are concerned, however, it is important to keep in mind that models for photoionization by an AGN can predict line ratios very similar to those shown for the shock models (Allen et al. 1998), so that excitation by a central engine cannot be excluded.
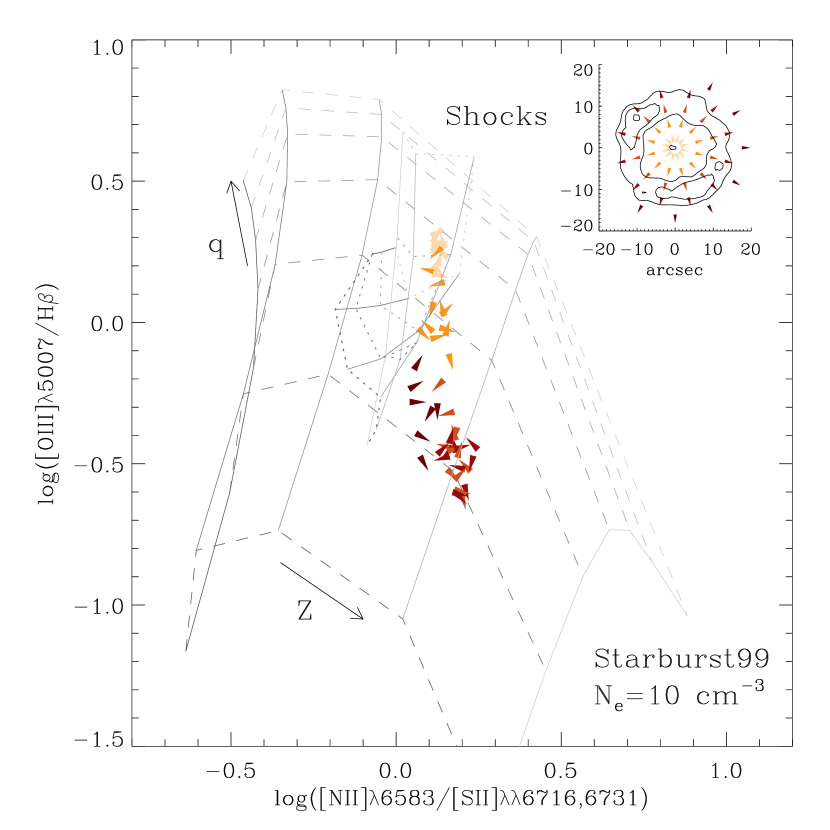
Although the [N ii]/H vs. [O iii]/H diagnostic diagram is useful to show the role of different excitation mechanisms in different galactic regions, it cannot generally be used to derive the physical condition of the H ii regions, except in the very low metallicity regime. The models in fact fold around, so that any given location in the diagnostic diagram occupied by starburst models with could correspond either to an H ii region of low metallicity and low ionization parameter or to an H ii region with considerably larger values of and . In the combined wavelength range of the DensePak and SAURON observations the best diagnostic to constrain the metallicity of the ring starburst is the [N ii]/[S ii] ratio. Rubin, Ford & Whitmore (1984) were the first to demonstrate the utility of this line ratio, which serves well to estimate metallicities from slightly sub-solar to super-solar values (Kewley & Dopita 2002). The right panel of Fig. 3 shows the location of our data in the [N ii]/[S ii] vs. [O iii]/H diagnostic diagram, which unequivocally demonstrates that the nuclear ring is predominantly populated by H ii regions with near-solar metallicity. Having learned from the [N ii]/H vs. [O iii]/H diagram that, both inside and outside the ring, sources other than OB stars may contribute to the gas excitation, we note that the regions outside the ring (brown symbols) seem to approach the shock-model grid from a different direction than the point inside the ring (orange symbols). This suggests that if indeed shocks are contributing to heating and/or ionizing the gas, they may occur under different conditions at the opposite edges of the ring.
4. Discussion and Conclusions
We have combined two integral-field spectroscopic data sets to study the role of various ionizing mechanisms in powering the gas emission in the central kpc of NGC 7742. Our spatially resolved emission-line diagnostic analysis reveals a sharp transition between regions powered by OB stars in the nuclear ring to LINER-like emission both inside and outside the ring. Comparison with models for shock ionization indicates that shocks can contribute to the gas excitation in these regions, in particular outside the ring. Toward the center photoionization by a central AGN could also be important. The ratio of the [S ii] doublet lines indicates low electron density, , in the ring, where comparison with MAPPINGS III photoionization models shows that the gas and stars have approximately solar metallicity.
NGC 7742 shows a clear signature of past galaxy interaction, namely the counter-rotation of the gas and the stars. Although NGC 7743 accompanies NGC 7742 and is sufficiently massive that it could, in principle, have provided the metal-rich gaseous material observed in the nuclear ring, the large distance between the two galaxies and the morphologically pristine characteristics of both objects rule out a recent interaction. This leads us to consider an alternative scenario, whereby NGC 7742 cannibalized a smaller galaxy, rich in gas of low metallicity. This material was then funneled into the ring where star formation proceeded long enough for the metallicity of the starburst to increase to its present value. Falcón-Barroso et al. estimated a mass for the ionised-gas in NGC 7742 of few , a lower limit to the total amount of gas in the ring. To reach an oxygen mass fraction of 1%, corresponding to solar metallicity, it would take just tens of Myr to have enough supernovae injecting enriched material in the ring, assuming a star formation rate of few .
We propose that the gas which has fallen into NGC 7742 has reached a rather relaxed, though counterrotating, state where massive star formation in the nuclear ring has gradually enriched the metallicity. An analysis of the absorption-line indices in the nuclear ring of NGC 7742 by Allard et al. (2006, in prep.) supports this by confirming that massive star formation has occurred intermittently there for maybe half a Gyr, in a very similar way as recently modelled in detail by Allard et al. (2006) for M100. Like the ring in that galaxy, the one in NGC 7742 is thus a stable configuration which can easily enrich its metallicity.
All the observational evidence presented or reviewed here thus suggests strongly that the counterrotating gas came into NGC 7742 through a minor merger event at some time in the history of the galaxy, and that this gas has since reached solar metallicity as a result of the massive star formation in the nuclear ring. Although the counterrotation is unique to the ring host NGC 7742, a very similar picture of a minor merger at the origin of the nuclear ring in the non-barred galaxy NGC 278 was proposed on the basis of the disturbed H i morphology and kinematics in NGC 278 (Knapen et al. 2004).
More constraints on the gas dynamics are needed to construct a detailed chemo-dynamical model allowing to verify this scenario. Alternatively, deeper spectroscopic data could be used to constrain the metallicity of the gas outside the ring, which according to our model should have a lower metallicity than the nuclear ring material. In addition, deep H i imaging might reveal the results of the minor merger we postulate for NGC 7742, possibly in the form of tidal tails or disturbed kinematics.
References
- Allen et al. (1998) Allen, M. G., Dopita, M. A., & Tsvetanov, Z. I. 1998, ApJ, 493, 571
- Bacon et al. (2001) Bacon, R., et al. 2001, MNRAS, 326, 23
- (3) Barden, S. C, & Armandroff, T. 1995, HYDRA/WIYN User’s Manual
- Barden & Wade (1988) Barden, S. C., & Wade, R. A. 1988, ASP Conf. Ser. 3, 113
- de Zeeuw et al. (2002) de Zeeuw, P. T., et al. 2002, MNRAS, 329, 513
- Dopita et al. (2000) Dopita, M. A., Kewley, L. J., Heisler, C. A., & Sutherland, R. S. 2000, ApJ, 542, 224
- Falcón-Barroso et al. (2006) Falcón-Barroso, J., et al. 2006, MNRAS, 369, 529
- Fioc & Rocca-Volmerange (1997) Fioc, M., & Rocca-Volmerange, B. 1997, A&A, 326, 950
- Ho et al. (1997) Ho, L. C., Filippenko, A. V., & Sargent, W. L. W. 1997, ApJ, 487, 568
- Kewley et al. (2001) Kewley, L. J., Dopita, M. A., Sutherland, R. S., Heisler, C. A., & Trevena, J. 2001, ApJ, 556, 121
- Kewley & Dopita (2002) Kewley, L. J., & Dopita, M. A. 2002, ApJS, 142, 35
- Knapen et al. (2006) Knapen, J.H., Mazzuca, L.M., Böker, T, Shlosman, I., Colina, L. Combes, F., Axon, D.J. 2005, A&A, 448, 489
- Leitherer et al. (1999) Leitherer, C., et al. 1999, ApJS, 123, 3
- (14) Mazzuca, L., M, Knapen, J. H., Veilleux, S., Regan, M. W., 2006, ApJ, submitted
- Osterbrock (1989) Osterbrock, D. E. Astrophysic of Gaseous Nebulae and Active Galactic Nuclei, University Science Books, 1989
- Pogge & Eskridge (1993) Pogge, R. W., & Eskridge, P. B. 1993, AJ, 106, 1405
- Rubin et al. (1984) Rubin, V. C., Ford, W. K., & Whitmore, B. C. 1984, ApJ, 281, L21
- Sanchez-Blazquez et al. (2006) Sánchez-Blázquez, P., Gorgas, J., Cardiel, N., & González, J. J. 2006, ArXiv Astrophysics e-prints, arXiv:astro-ph/0607009
- Sarzi et al. (2006) Sarzi, M., et al. 2006, MNRAS, 366, 1151
- Veilleux & Osterbrock (1987) Veilleux, S., & Osterbrock, D. E. 1987, ApJS, 63, 295