Self-Regulated Reionization
Abstract
Recently, we have presented the first, truly large-scale radiative transfer simulations of inhomogeneous cosmic reionization which resolve all the possible halo sources down to the dwarf galaxy mass range, , in a comoving volume . This is large enough to sample the global mean history, geometry and statistical properties of reionization fairly and accurately for the first time. Here we present new simulations which extend the source halo mass range downward to , to capture the full range of halo masses thought to be primarily responsible for reionization by their star formation following atomic hydrogen radiative cooling and gravitational collapse. Haloes below about , however, are subject to Jeans-mass filtering in the ionized regions, which suppresses their baryonic content and their ability to release ionizing radiation. By including these smaller-mass haloes but accounting for their suppression, too, we find that reionization is “self-regulating,” as follows. As the mean ionized fraction rises, so does the fraction of the volume within which suppression occurs. Hence, the degree of suppression is related to the mean ionized fraction. Since low-mass haloes with high efficiency (i.e. high emissivity) achieve a given mean ionized fraction earlier than do those with low efficiency, Jeans-mass filtering compensates for the difference in the emissivity of the suppressible haloes in these two cases. As a result, in the presence of lower-mass source haloes, reionization begins earlier, but the later stages of reionization and the time of overlap are dictated by the efficiency of the higher-mass haloes, independent of the efficiency of the suppressible, lower-mass haloes. Hence, while the lower-mass haloes do not alter the overlap redshift, , they serve to boost the electron-scattering optical depth of the universe, . This may explain why observations of quasar absorption spectra at high redshift find that reionization ended late (), while CMB polarization measurements report a large enough that reionization must have begun much earlier (). We present results for the CDM universe with cosmological parameters from both 1-year and 3-year data releases of WMAP. Reionization histories consistent with current constraints on and are shown to be achievable with standard stellar sources in haloes above . Neither minihalos nor exotic sources are required, and the phenomenon of “double reionization” previously suggested does not occur.
keywords:
cosmology: theory — radiative transfer — intergalactic medium — large-scale structure of universe — galaxies: formation — radio lines: galaxies1 Introduction
The inhomogeneous reionization of the intergalactic medium (IGM) at high redshift proceeded by the propagation of ionization fronts (I-fronts) outward from the early galaxies that formed sources of ionizing radiation, like stars and mini-quasars. This process continued until the H II regions bounded by these I-fronts grew to overlap. Shapiro & Giroux (1987) showed that the I-fronts during reionization were generally weak, R-type, which move supersonically relative to both the neutral gas ahead of and the ionized gas behind them, outracing the hydrodynamic response of the IGM to the radiation. This property makes it possible to simulate inhomogeneous reionization in a cosmological universe like CDM by performing a radiative transfer calculation on a pre-computed, 3-D, cosmological density field generated by either a pure N-body or a gas and N-body dynamics simulation of large-scale structure formation. In this approximation – the “static limit” – the dark matter and baryonic gas evolve just as they would have without reionization, with no back-reaction from the gas pressure forces associated with photoheating in an inhomogeneous density field. These structure formation simulations also yield the mass and location of the galactic halos which are the sites of star formation and, hence, of ionizing photon release. Attempts to simulate reionization in a CDM universe this way include Ciardi et al. (2000); Nakamoto et al. (2001); Razoumov et al. (2002); Ciardi et al. (2003b); Sokasian et al. (2003); Iliev et al. (2006b); Mellema et al. (2006b). Of these, the simulations described in Iliev et al. (2006b) and Mellema et al. (2006b) represent the first truly large-scale radiative transfer simulations of reionization, in a comoving volume of , which resolve all the individual halo sources down to the dwarf galaxy range, above about a billion solar masses. This represents a more than two orders of magnitude volume increase over previous work, as is required in order to make statistically meaningful predictions of observable consequences and features of reionization. To accomplish this, a new and efficient radiative transfer method, called C2-Ray (Conservative, Causal Ray-Tracing) was developed (Mellema et al. 2006a). It was then coupled to the results of very large N-body simulations of the CDM universe involving billion particles on a cubic lattice of cells by the parallel PMFAST method (Merz et al. 2005).
The back-reaction of the IGM and of the halos which collapse out of it to make sources cannot be entirely neglected, however. These effects become important at small scales, in particular. As first described in Shapiro et al. (1994, henceforth, SGB94), the heating of the IGM during reionization introduces pressure forces which oppose the growth of linear perturbations in the baryonic component by gravitational instability – sometimes referred to as “Jeans-mass filtering” – resulting in a negative feedback on the rate of collapse of new baryons out of the IGM into dark matter halos. Since small-mass halos form first and merge to make larger-mass halos later during hierarchical structure formation in the CDM universe, this feedback effect (which prevents the smaller-mass halo sources from forming inside H II regions) acts as a “self-regulator” on reionization, as follows. The more sources that form, the higher the mean ionized fraction of the universe, but the higher the fraction of the IGM which is ionized, the more of these small-mass halos are suppressed. This slows the rapid exponential rise of the source population and, with it, the rise of the ionized fraction. Eventually, when halos massive enough to overcome this feedback effect and capture their fair share of baryons even inside H II regions become common enough, they are able to finish reionization without being inhibited by radiative feedback. This phenomenon of Jeans-mass filtering was subsequently revisited and confirmed by comparison with simulations by Gnedin & Hui (1998) and Gnedin (2000), see also Bi & Davidsen (1997). Estimates of the minimum halo mass scale which is sufficient to overcome the effects of uniform photoionization and accrete or retain enough baryons to make star formation possible have also been refined over the years, by 1-D and 3-D gasdynamical simulations (e.g. Efstathiou 1992; Thoul & Weinberg 1996; Navarro & Steinmetz 1997; Dijkstra et al. 2004). Roughly speaking, for halos during the epoch of reionization (EOR) at redshifts , the minimum halo mass required to avoid suppression is about a billion solar masses.
This mass scale corresponds roughly to the minimum mass of the source halos included in the large-scale reionization simulations described in Iliev et al. (2006b) and Mellema et al. (2006b) for comoving simulation volumes of , those of Ciardi et al. (2003b, a); Ciardi et al. (2006), for simulation volumes and those of Zahn et al. (2006) for a volume of . For these simulations the Jeans-mass filtering is not taken into account, since the mass range of the source halos they resolved is above the range which is suppressed by reionization.
The minimum mass of the halos responsible for reionization may have been smaller than this, however. The star-forming abilities of halos are generally thought to be different for halos with virial temperatures above and below K, respectively. Halos with K (roughly ) called “minihaloes” only form stars if they can form a trace of molecules sufficient to cool the gas well below by collisional excitation of rotational-vibrational lines. Since minihaloes are the earliest halos to form in the CDM universe, they are expected to be the first sites of star formation. Minihaloes are highly vulnerable to radiative feedback from these very stars, however. Simulations currently suggest that these first stars were massive and hot and, hence, were strong emitters of ionizing and dissociating UV radiation (Abel et al. 2002; Bromm et al. 2002). A single star was then sufficient to expel the gas from the minihalo that made it, by photoionizing the gas (Whalen et al. 2004; Kitayama et al. 2004; Alvarez et al. 2006a). The UV background from these stars in the Lyman-Werner bands is likely to have dissociated the molecules in minihaloes which had not yet formed stars, long before they released enough ionizing photons to reionize the universe (Haiman et al. 2000). This suggests that minihaloes were not the primary source of reionization, although this conclusion remains highly uncertain. Those minihaloes which were “sterilized” in this way against their own star formation would have trapped the intergalactic I-fronts which encountered them during reionization, transforming these I-fronts from R-type to D-type, and expelling their gas in a photoevaporative wind (Shapiro et al. 2004; Iliev et al. 2005b). This process might have affected the progress of reionization by consuming additional ionizing photons (Iliev et al. 2005b, a; Ciardi et al. 2006). The effect of minihaloes as sinks of ionizing photons tends to be degenerate, in fact, with the unknown efficiency for release of ionizing photons by higher-mass sources, as a result of the tendency for minihaloes to cluster around them (Iliev et al. 2005a).
By contrast with the minihaloes, halos with K () were less vulnerable to the suppression of their star formation. These halos were able to cool radiatively and collapse by collisional excitation of the atomic hydrogen Ly line, leading to star formation even in the presence of the rising UV dissociation background from other stars. As described above, however, these halos were nevertheless subject to Jeans-mass filtering inside H II regions.
Halos in the intermediate mass range (), therefore, can be important sources of additional ionizing photons not explicitly accounted for in our previous large-scale simulations of reionization. These sources would have been suppressed inside H II regions, however, so their overall impact remains to be determined. Semi-analytical studies suggest that the inclusion of halos subject to Jeans-mass filtering has a significant effect on the mean reionization history (Shapiro et al. 1994; Shapiro 1995; Chiu & Ostriker 2000; Haiman & Holder 2003; Wyithe & Loeb 2003; Onken & Miralda-Escudé 2004; Furlanetto & Loeb 2005). This may help explain why the CMB polarization experiments indicate that reionization was well advanced by (Spergel & et al. 2006), while quasar absorption spectra suggest that reionization ended later, at (e.g. Fan et al. 2002; White et al. 2003), implying that the EOR was extended in time.
Some smaller-scale reionization simulations have been performed that couple gas and N-body dynamics to radiative transfer, which, in principle, takes account of the feedback effect of Jeans-mass filtering (Ricotti et al. 2002). However, these simulation volumes are too small to describe the global reionization history or its geometry and statistical properties. As a result, they failed to anticipate the extended nature of reionization which self-regulation by Jeans-mass filtering makes possible111Recently, small-scale reionization simulations like these were also used as the basis for a phenomenological “subgrid model” in a large-scale reionization simulation which was too coarse-grained to resolve the small-scale structure and source halos directly (Kohler et al. 2005). That will be the subject of the current paper.
In this paper we assume a flat () CDM cosmology with parameters ( (Spergel & et al. 2003), hereafter WMAP1, where , , and are the total matter, vacuum, and baryonic densities in units of the critical density, is the rms density fluctuations extrapolated to the present on the scale of according to the linear perturbation theory, and is the index of the primordial power spectrum of density fluctuations. The new, 3-year WMAP data yielded somewhat different parameters (Spergel & et al. 2006), (, hereafter WMAP3.
The differences between these WMAP1 and WMAP3 parameters can have a significant impact on the progress of reionization (Alvarez et al. 2006b). Structure formation is delayed in the WMAP3 universe relative to the WMAP1 universe, especially on the small scales relevant to the formation of reionization source halos at high redshift, so the epoch of reionization is shifted to lower redshifts. In particular, if source halos of a given mass are assumed to have released ionizing photons with the same efficiency in either case, then reionization for WMAP3 is predicted to have occurred at -values which are roughly 1.4 times smaller than for WMAP1. As such, the predicted electron-scattering optical depth of the IGM accumulated since the beginning of the EOR would have been smaller for WMAP3 than for WMAP1 by a factor of , just as the observations of large-angle fluctuations in the CMB polarization require. This means that the ionizing efficiency per collapsed baryon required to make reionization early enough to explain the value of reported for WMAP1 and WMAP3 are nearly the same, despite the fact that is smaller for WMAP3 than for WMAP1.
In Section 2, we describe our simulations, the method, input parameters and cases. We motivate these simulations and anticipate some of the trends by a simple analytical toy model for the mean ionization history in Section 3. Simulation results are presented in Section 4, with conclusions in Section 5. Appendix A describes how we can use the simulation results to improve upon the toy model introduced in Section 3.
2 The Simulations
Our basic methodology was described in detail in Iliev et al. (2006b) (hereafter Paper I) and Mellema et al. (2006b) (hereafter Paper II). Hence, here we will outline the main simulation parameters and concentrate on the simulations which have not been presented before and the new features we introduce.
We use very high resolution N-body simulations to derive halo catalogues, which include the detailed halo properties, as well as their positions and velocities at a number of time-slices (between 50 and 100 per simulation) and the corresponding gas density fields. All the halos found in the simulation volume at a given redshift are assumed to be sources of ionizing radiation (unless they are suppressed by Jeans mass filtering, see below). This results typically in tens to hundreds of thousands of sources, depending on the case. We use a simple recipe to assign a photon emissivity to each source, by assuming a constant mass-to-light ratio. We follow the time-dependent propagation of the ionization fronts produced by all sources in the simulation volume using our detailed radiative transfer and non-equilibrium chemistry code -Ray (Mellema et al. 2006a), which has been extensively tested against available analytical solutions (Mellema et al. 2006a) and a number of other cosmological radiative transfer codes (Iliev et al. 2006a).
The underlying N-body simulations have a spatial grid of cells and follow the evolution of billion particles using the particle-mesh code PMFAST (Merz et al. 2005). The number of resolved halos for the simulations with WMAP1 cosmology parameters are () halos at () in the volume, and () halos at () in the volume. The corresponding numbers for the WMAP3 simulations are () halos at () in the volume and () halos at () in the volume.
Simulating the transfer of ionizing radiation with the same grid resolution as the underlying N-body is still not feasible on current computers. We therefore re-grid the data to lower resolution, with either or cells, for the radiative transfer simulations. We combine sources which fall into the same coarse cell, which reduces slightly the number of sources to be considered compared to the total number of halos.
2.1 Source suppression by Jeans-mass filtering
The process of photoionization also heats the gas to temperatures above K. The exact value of the temperature reached varies and generally depends on the local level of the ionizing flux and its spectrum (see Shapiro et al. 2004, for detailed numerical calculations). Typical values are K, but it could be as high as K for hot (Pop. III) black-body spectrum. However, as was mentioned above, the hydrogen line cooling is highly efficient for K, particularly at high redshifts, where the gas is denser on average, which would typically bring its temperature down to K, and possibly somewhat below that due to the adiabatic cooling from the expansion of the universe.
This increase of the IGM temperature caused by its photoheating results in a corresponding increase in the Jeans mass. The adiabatic IGM temperature at , after Compton scattering ceases to couple to as it does at earlier times, is well-approximated by
| (1) |
(Couchman 1985; Glover & Brand 2003). In linear theory, the instantaneous cosmological Jeans mass of the neutral IGM in the absence of heating is then given by
| (2) |
(e.g. Shapiro et al. 1994; Iliev et al. 2002), and increases with temperature as , where is the mean molecular weight. Using this simple scaling with temperature we obtain
for the ionized IGM.
The actual filter mass differs somewhat from this instantaneous Jeans mass since the mass scale on which baryons succeed in collapsing out of the IGM along with the dark matter must be determined, even in linear theory, by integrating the differential equation for perturbation growth over time for the evolving IGM (Shapiro et al. 1994; Gnedin & Hui 1998; Gnedin 2000). In reality, determining the minimum mass necessary for a halo collapsing inside an ionized and heated region to acquire its fair share of baryons which subsequently cool further to form stars is even more complicated. It depends on the detailed, non-linear, gas dynamics of the process and on radiative cooling. There is no single mass above which a collapsing halo retains all its gas, and below which the gas does not collapse with the dark matter. Instead, simulations show that the cooled gas fraction in halos decreases gradually with decreasing halo mass (Efstathiou 1992; Thoul & Weinberg 1996; Navarro & Steinmetz 1997; Dijkstra et al. 2004). The typical halo sizes at which this transition occurs as derived by these different studies also vary. Thoul & Weinberg (1996) found that photoionization suppresses star formation in halos with circular velocities below , and decreases the cooled gas mass fraction in larger halos, with circular velocities up to . The halo circular velocity is related to its virial temperature as follows
| (4) |
(e.g. Iliev & Shapiro 2001), where is the mean molecular weight for ionized gas, and the virial temperature is related to the halo mass by
| (5) |
Navarro & Steinmetz (1997) found that the cooled gas fraction is affected by photoionization even in larger galaxies, with circular velocities up to . On the other hand, Dijkstra et al. (2004) recently showed, using the same method as Thoul & Weinberg (1996), that at high redshifts the suppression is not as effective, and somewhat smaller galaxies can still retain some cooled gas. For simplicity, we assume that star formation is suppressed in halos with masses below and not suppressed in larger halos, in rough agreement with the linear Jeans mass estimate for K gas and the above dynamical studies.
2.2 Source efficiencies and Pop. III to Pop. II transition
We model the sources by assuming a constant mass-to-light ratio. Each halo found in the simulation volume at a given time, which is not suppressed by Jeans mass filtering is a source. For a source with halo mass and lifetime we assign ionizing photon emissivity according to
| (6) |
where the proportionality coefficient reflects the ionizing photon production efficiency of the stars per stellar atom, , the star formation efficiency, , and the escape fraction, :
| (7) |
(e.g. Haiman & Holder 2003). All these quantities are still quite uncertain, especially at high redshift, see e.g. Iliev et al. (2005a) for discussion. Recent theoretical studies have indicated that the first, metal-free stars (Pop. III) might have been quite massive (Bromm et al. 2002; Abel et al. 2000). Massive stars are more efficient producers of ionizing photons, emitting up to ionizing photons per stellar atom (Bromm et al. 2001; Schaerer 2002; Venkatesan & Truran 2003). Integrating over a top-heavy IMF for Pop. III stars leads to estimates of (Schaerer 2002). The Salpeter IMF for Pop. II stars gives (Leitherer et al. 1999). The values of and are even less certain, ranging from to for each of these quantities. There are also indications that the photon escape fraction is mass-dependent and significantly higher for small galaxies at high redshift than for large galaxies observed at later times (Kitayama et al. 2004; Alvarez et al. 2006a). Thus, many of the currently viable reionization scenarios involve an early population of small sources with high ionizing efficiency, which eventually evolve into the population of less efficient emitters we see at later times. In this work we adopt (corresponding to e.g. , and , i.e. top-heavy IMF and relatively efficient star formation and photon escape) for modelling the high-efficiency emitters and (corresponding to e.g. , and , or , and , i.e. either moderately top-heavy IMF and moderate efficiencies, or Salpeter IMF and relatively high, but not unreasonable, efficiencies).
The detailed mechanisms of this possible transition from high to low efficiency emitters, and even the question of whether it actually occurred are still unclear. We therefore have simulated cases both with and without such a transition. In the latter case, all sources, both large and small, have the same ionizing photon production efficiency. The possible physical mechanisms which result in decreasing the ionizing efficiency are quite varied and complex, including e.g. production, expulsion and mixing of metals, which modifies the stellar IMF, and thus , and the increase of the mean halo mass over time as a consequence of hierarchical structure formation, which is expected to decrease the escape fraction. Modelling and studying the detailed features and mechanisms of this transition is not the aim of this paper. Instead of trying to model these complex processes and the many related uncertainties, we adopt a simple model which should nonetheless capture the main features of the efficiency transition, as follows. For the simulations with varying ionizing efficiency, we assign the high value of to the sources smaller than some characteristic mass, and the low efficiency to the larger halos. Since the CDM structure formation proceeds hierarchically, the small halos form first, and gradually merge up to form ever larger halos. This process of merging is presumed to lead to a gradual increase in the mean metallicity of the halo gas, and decrease of the escape fractions. Physically, it is expected that this transition is inhomogeneous in space and extended in time (e.g. Furlanetto & Loeb 2005) and proceeded faster in the high-density peaks, which are the first to form halos and are the first sites of vigorous merging. We assume the characteristic halo mass at which the efficiency transition occurs to be . For computational simplicity, we chose it to be the same one as the Jeans filtering mass since this procedure yields only two types of sources (small, efficient and suppressible and large, less efficient and unsuppressible), rather than multiple source types. This assumption does not affect any of our main qualitative conclusions, though the exact value of the characteristic mass may affect some of the detailed quantitative estimates. If this transition mass were somewhat lower, e.g. , rather than , then the largest of the suppressed halos (between and ) would have Pop. II efficiency, while the smaller ones would have Pop. III efficiency. This would simply yield a case somewhere in-between our cases of high and low Pop. III efficiencies and our main conclusions would hold, although some quantitative numbers would change.
| f2000 | f2000_406 | f250 | f2000C | f250C | f2000_250 | f2000_250S | f2000_250S_406 | f250_250S | f2000C_250S | f250C_250S | |
| mesh | |||||||||||
| box size | 100 | 100 | 100 | 100 | 100 | 35 | 35 | 35 | 35 | 35 | 35 |
| 2000 | 2000 | 250 | 2000 | 250 | 250 | 250 | 250 | 250 | 250 | 250 | |
| - | - | - | - | - | 2000 | 2000 | 2000 | 250 | 2000 | 250 | |
| 1 | 1 | 1 | 1 | 1 | 1 | 1 | |||||
| Jeans supp. | - | - | - | - | - | no | yes | yes | yes | yes | yes |
| 13.6 | 13.5 | 11.7 | 12.6 | 11 | 16.2 | 14.5 | 14.9 | 12.6 | 13.8 | 11.6 | |
| 11.3 | 9.3 | 10.2 | 13.5 | 10.4 | 10.4 | 9.9 | 9.1 | 8.4 | |||
| 0.130 | 0.109 | 0.121 | 0.098 | 0.173 | 0.148 | 0.149 | 0.124 | 0.134 | 0.111 |
2.3 Sub-grid gas clumping
We also study the effect of gas clumping at very small scales, below the resolution of our current simulations. This clumping would increase the recombination rate. The sub-grid clumping coefficient, , we use is given by
| (8) |
for WMAP1 cosmology (a good fit for ) and
| (9) |
for WMAP3 cosmology (a good fit for ), in which case the structures form later. These fits to the small-scale clumping factor are a more precise version of the one we presented in Iliev et al. (2005a). To derive it we used a PMFAST simulation with the same computational mesh, , and number of particles, , but a much smaller computational volume, , and thus much higher resolution. These parameters correspond to particle mass of , minimum resolved halo mass of , and a spatial resolution of kpc comoving. This box size was chosen so as to resolve the scales most relevant to the clumping - on smaller scales the gas would be Jeans smoothed, while on larger scales the density fluctuations are already present in our computational density fields and should not be included again.
The expressions in equations (8) and (9) exclude the matter residing inside collapsed halos since these contribute to the recombination rate differently from the unshielded IGM. The minihalos are self-shielded, which results in their lower contribution to the total number of recombinations than one would infer from a simple gas clumping argument (Shapiro et al. 2004; Iliev et al. 2005b). In principle, the additional consumption of ionizing photons by minihalos can also be included as a sub-grid prescription, as we have done elsewhere (Ciardi et al. 2006), which results in a further delay of the final overlap. As discussed by Iliev et al. (2005a), however, the biased clustering of minihaloes around the larger mass source halos tends to make the minihalo photon consumption correction degenerate with the efficiency for source-halos to release ionizing photons, so we will assume here that this efficiency parameter takes approximate account of this effect. The larger halos, on the other hand, are assumed to be ionizing sources, and their recombinations are implicitly included in the photon production efficiency, , through their escape fraction. We can neglect the gas density fluctuations associated with suppressed sources. This gas is presumed to have been prevented by pressure forces from collapsing out of the IGM into these suppressed halos, so it should not contribute to the clumping factor as if it were inside the halos. Pressure forces may also have affected the clumping of the diffuse IGM inside the H II regions. Our estimate of the clumping factor, therefore, serves to bracket the effect of IGM clumping. A fully self-consistent treatment requires following the detailed gas dynamics coupled to the radiative transfer, but this would require numerical resolution ( kpc resolution at Mpc scale) which is currently unfeasible.
2.4 Simulation Cases
| f250 | f2000_250S | f2000C_250S | f250_250S | |
| mesh | ||||
| box size | 100 | 35 | 35 | 35 |
| 250 | 250 | 250 | 250 | |
| - | 2000 | 2000 | 250 | |
| 1 | 1 | 1 | ||
| Jeans supp. | - | yes | yes | yes |
| 8.9 | 10.4 | 9.7 | 9.3 | |
| 7.5 | 7.9 | 6.9 | 7.5 | |
| 0.082 | 0.103 | 0.096 | 0.089 |
In this paper we present a total of 15 simulations, of which 11 utilize the WMAP1 background cosmology. Five of these have a simulation box size of Mpc and were presented in Papers I and II. This corresponds to a particle mass of and minimum resolved halo mass of (requiring 100 particles or more to make sure halos are properly identified). The other six simulations have a smaller box size of Mpc. This allows for better mass and spatial resolution, corresponding to a particle mass of and minimum resolved halo mass of . This last mass roughly corresponds to the (generally redshift-dependent) minimum halo mass required for its gas to be able to cool efficiently by hydrogen line cooling (a gas virial temperature of K) (e.g. Iliev & Shapiro 2001). These simulations and their basic parameters and features are summarized in Table 1222The integrated electron-scattering optical depths for our large-box simulations were estimated incorrectly in Iliev et al. (2006b) and Mellema et al. (2006b), the correct, slightly lower, values are listed in Table 1. Note that two of our simulations, f2000_406 and f2000_250S_406 have the higher grid resolution of for the radiative transfer calculation but are otherwise identical to simulations f2000 and f2000_250S, respectively, and thus serve to study possible resolution effects.
Additionally, we investigate the effects of varying the background cosmological parameters by doing four additional simulations for which we adopt the WMAP3 background cosmology but otherwise make the exact same assumptions about the reionization sources as the corresponding WMAP1 simulations. These simulations also impose periodic boundary conditions on the ray-tracing, rather than the transmissive ones adopted for the simulations in Table 1. The periodic boundary conditions in the radiative transfer simulations are implemented by (logically) positioning each ionizing source at the center of the grid using the periodicity of the density field, before calculating its contribution to the global ionization rates. This results in each source having a region of influence of the same size as our box. Since our boxes are large, they are optically-thick along most lines-of-sight throughout most of the evolution and thus the majority of the radiation is absorbed within the box. Any radiation that still leaves the computational volume is collected and put back in as a diffuse background, which boosts the effective local photoionization rates. The simulations using WMAP3 background cosmology are summarized in Table 2.
The radiative transfer simulations presented in this work were run on a variety of computers at CITA and The University of Texas, from single- and dual-processor Opteron 64-bit workstations (at effective GHz), to quad-processor Itanium-2 server (at GHz), to a 32-processor DEC-Alpha machine (at MHz). The run times varied from 500 up to Opteron-equivalent processor-hours for the simulations with mesh, and about 8 times longer than that for the simulations with mesh.
The maximum number of sources which we ray-trace per time-step for the large-box [ volume] simulations is up to for WMAP1 cosmological parameters, and up to for WMAP3 cosmological parameters. The corresponding numbers for the smaller-box, [ volume] simulations are somewhat lower, at for WMAP1 and for WMAP3. The net cumulative source-halo episodes explicitly ray-traced over the course of each simulation is typically a few million for the large-box simulations, and a few hundred thousand for the smaller-box simulations.
3 A Simple analytical toy model for self-regulated reionization
The effect of the suppression of small-mass sources when their halos form inside an H II region can be illustrated by a simple, analytical toy model. This will anticipate the phenomenon of self-regulation of reionization and the effects of varying the photon release efficiencies of large and small halos and the IGM clumping factor on the evolution of the mean ionized fraction of the universe. The universe is assumed to be comprised of H II regions which fill a fraction of the total volume and H I regions in the remaining volume. The global average rate of change of the ionized volume fraction with time, , is determined by the rate of emission of ionizing photons and the rate of recombinations (all per atom in the universe). The volume-averaged rates of emission of ionizing photons per collapsed atom can be different for low-mass and high-mass source haloes, respectively, if the photon release efficiencies, and per atom are different. In addition, the low-mass source haloes are subject to Jeans-mass filtering, which means that the only atoms which should be counted as collapsed onto the low-mass haloes are those associated with haloes in the neutral regions, which occupy a volume fraction of the universe equal to . In the simplest approximation, in which the low-mass haloes are assumed to be distributed uniformly or randomly in space, the volume-averaged ionization rate contributed by the low-mass haloes is , if is the emission rate per atom if we neglect suppression. Recombinations occur only in the ionized regions, so the volume-averaged recombination rate per atom is the one for fully-ionized gas, , multiplied by , where . This yields a simple differential equation for the mean reionization history of the IGM,
| (10) |
where is the emission rate of the high-mass haloes per atom in the universe. Equation (10) is conveniently rewritten in a non-dimensional form as
| (11) |
where
| (12) |
and
| (13) |
The formal solution of equation (11) is given by
| (14) |
where
| (15) |
This solution is familiar since equation (11) is identical to the static equation of radiative transfer in which is intensity, is optical depth and is the source function. The contribution of the term to the integral in equation (14) is the cumulative number of ionizing photons released by all the low-mass sources over time if suppression by Jeans-mass filtering is neglected, , while the integral over is just the cumulative total number of recombinations per atom in a fully-ionized universe, a large number. As long as we start the time integration at some finite cosmic time after the Big Bang (e.g. the recombination epoch), this recombination integral remains finite. In that case, and , and we can replace by , yielding
| (16) |
According to equation (16), reionization ends at overlap epoch such that , when , while equation (10) tells us that .
The solution without suppression is given by first setting in the equations above and then replacing by :
| (17) |
In this case, reionization ends (i.e. ) when , and the derivative is again zero.
A comparison of the solutions above for the cases with and without suppression shows several things. Suppression delays the completion of reionization, since the emission of ionizing photons by the low-mass sources adds to that of the high-mass haloes to reionize the universe and balance the recombinations at an earlier epoch when suppression is neglected. With suppression, the overlap epoch is determined entirely by the balance between the emission contribution of the high-mass haloes and recombinations, independent of the contribution from the low-mass haloes. This illustrates just what is meant by “self-regulation”, since the overlap epoch in the presence of suppression is independent of the efficiency for photon release by the low-mass haloes. Apparently, if they are more efficient at releasing photons, they are also more efficient at suppressing the formation of other low-mass sources, so their net effect is the same. In either case, overlap is achieved by the high-mass sources, which are free of suppression. Prior to overlap, however, the volume ionized fraction is higher at every epoch when suppression is neglected. If we were to neglect the small-mass sources altogether, we would find that reionization is also delayed, of course. But these results indicate that if we add the contribution of small-mass sources but account for their suppression, the resulting overlap will be the same as if we neglected the small-mass sources altogether.
Reionization is extended by the presence of low-mass haloes, however, relative to the case with no low-mass haloes. According to equations (16) and (17), is higher at all times when than when , because , since at all times prior to the instant of overlap (i.e. since before overlap, when ). This means that the effect of adding low-mass haloes would be to increase the integrated electron-scattering optical depth without changing the overlap redshift.
Similar simple analytical models, based on equation (10), with some variations, has been explored in several recent works, albeit none derived the analytical solution presented in equations (16) and (17) (Haiman & Holder 2003; Wyithe & Loeb 2003; Onken & Miralda-Escudé 2004; Furlanetto & Loeb 2005). These studies largely reached analogous conclusions to ours, namely that the Jeans-mass suppression extends reionization, but only rarely, if ever, does this lead to a non-monotonic evolution of the ionized fraction, or to a double reionization.
In reality, the reionization history is more complicated than our toy model suggests. As we shall see, the source haloes and their H II regions are spatially-clustered and thus biased relative to the matter distribution, so our assumptions above of uniformly distributed low-mass haloes and uniform gas density are not correct. We will revisit this issue in § 4 and the Appendix and show how we can improve the toy model with hindsight from our detailed simulation results. None of the above previously-published semi-analytical reionization models above include the effects of bias.
4 Simulation Results
4.1 Mean reionization history milestones
We start by examining the mean global reionization histories derived from our simulations. These can be characterized by several basic parameters. The first of these parameters is the epoch of overlap, , which we define as the time when the mass-weighted ionized fraction of the gas first surpasses 99%. This also quantifies the overall duration of reionization, since its start is determined by when the first resolved halos form in our simulations, and thus is fixed by the structure formation alone. The second global parameter is the total electron scattering optical depth, , integrated from the beginning of reionization to the present. The third and final parameter is the redshift when 50% of the gas mass is ionized for the first time. This is of direct interest for observations since this half-ionization point is a good indicator of the epoch when the fluctuations of the redshifted 21-cm emission from neutral hydrogen reach their maximum (Mellema et al. 2006b).
For all the large-box simulations of comoving size Mpc on a side the first resolved halo forms, and thus reionization starts, at (16) in WMAP1 (WMAP3) cosmology. For the smaller-box simulations of size Mpc this occurs earlier, at for WMAP1 cosmology and at for WMAP3 cosmology. This earlier start for smaller simulation volume is due to the hierarchical nature of CDM structure formation, whereby the smaller halos form earlier. Our N-body simulations have the same number of particles, thus the smaller boxes have correspondingly higher mass resolution, and hence the first halos form earlier. Among our simulations, the earliest epoch of overlap is , achieved in the (somewhat artificial) case f2000_250, i.e. when small-mass sources are never suppressed by Jeans mass filtering, while at the same time they are highly efficient at producing ionizing photons. The combination of these two properties results in a very large photon emissivity, and as a consequence, a very fast reionization and too early overlap. In the more realistic cases, in which the small-mass source suppression is included, the overlap occurs significantly later, between redshift (f2000_250S) and 8.4 (f250C_250S). For the large-volume simulations, the redshifts of overlap are similar, ranging from (f2000) to (f250C). The reason for these similar end-of-reionization times despite the lack of small-mass sources in the large-volume simulations is that most of these small sources become suppressed by the time of overlap, and thus, in either case, the reionization is brought to an end by the same large-mass sources. However, at early times there are significant differences between the results for the two box sizes. As we noted above, the small-mass sources start forming significantly earlier, thus models which resolve these sources have higher ionized fraction at early times. This results in higher integrated optical depths when small-mass sources are resolved. For the WMAP1 cases, these range from (f2000_250) when the small-mass sources are high-efficiency but not suppressed, to (f2000_250S) when suppression is taken into account, to (f250C_250S) when low-mass sources have the same efficiency as the high-mass ones and sub-grid IGM clumping is taken into account, all of which are roughly within 1- from the WMAP1 estimate, . In the Mpc box simulations, the small-mass sources are not present and thus reionization starts later. This results in somewhat lower values of the integrated optical depth, ranging from (f2000), which is nevertheless still in agreement with the WMAP1 measurement, to (f250C), which is a bit low.
Increasing the resolution to grid has only a modest effect on the reionization histories. In these cases the underlying density field is resolved better, which results in an increased recombination rate, and a slightly more extended reionization history.
4.2 WMAP1 vs. WMAP3 and ionizing source efficiencies
Within the WMAP3 background cosmology, structure formation occurs later and all the evolution shifts to correspondingly lower redshifts. For the same efficiencies, overlap is now reached at redshifts between (f2000_250S) and (f2000C_250S), in rough agreement with the data from high-redshift galaxies and SDSS QSO’s, which indicate a tail-end of reionization at (e.g. Fan et al. 2002; White et al. 2003; Malhotra & Rhoads 2004). The resulting integrated electron scattering optical depths are correspondingly lower, at , in complete agreement with the WMAP3 constraints. These results confirm that the delay in structure formation due to the lower values of and , higher value of and the slight tilt of the primordial power spectrum found by WMAP3 results yield a decrease of the integrated optical depth from the WMAP1 value of to the WMAP3 value of , as was previously predicted analytically (Alvarez et al. 2006b). This analytical estimate predicted that the change of the cosmological parameters from the WMAP1 to WMAP3 values would result in a delay of reionization by a factor of 1.4 in and a corresponding lower optical depth by a factor of . These predictions are nicely confirmed by our current simulations, which yield a decrease in the redshift of 50% ionization by a factor of 1.3-1.4, and in the overlap redshift by a factor of 1.3, while the values decrease by factors of . The correction factors are slightly smaller than the ones derived analytically. These differences are due mostly to the use of periodic boundary conditions in our WMAP3 simulations (which ensures that no photons are lost through the simulation box boundary), vs. our use of transmissive boundary conditions in the earlier simulations. This yields a slightly faster evolution at the late stages of reionization, and correspondingly earlier overlap.
There has been a recent claim (Popa 2006) that the delay in structure formation due to the different background cosmological parameters derived by WMAP3 is not in fact sufficient to account for the reduction of the derived optical depth, once the feedback and radiative transfer effects are accounted for. This work claimed, instead, that the WMAP3 cosmology requires a more top-heavy IMF in order to match the new value of the integrated optical depth. Our simulations show conclusively that this is not the case.
Our results show that, while a very top-heavy IMF is not required, ionizing sources nonetheless must have been fairly efficient photon producers. This means that, compared to the present-day observed galaxies, the high-redshift galaxies must have had either a moderately top-heavy IMF, a higher star formation efficiency, a higher photon escape fraction, or some combination of these.
Recently, Zahn et al. (2006) performed a simulation similar to the ones we presented in Papers I and II. This work used an approach similar to ours in coupling a radiative transfer scheme to the results of an N-body simulation of the density field. They adopted WMAP1 cosmology parameters, but utilized a smaller simulation volume and a different radiative transfer method. The sources resolved in these simulations have minimum mass , very similar to the resolution of our large-box simulations. In terms of ionizing source efficiencies, they assumed that all the sources only produce a cumulative one photon per every atom in the universe by redshift . This corresponds to a much lower source emissivity than the ones we have assumed. Such a model predicts quite late reionization and a very low integrated electron scattering optical depth of . The final overlap is achieved by only if the number of recombinations per atom integrated over time is negligible. As we noted above, adopting the WMAP3 cosmology for these simulations would inevitably push the redshift of overlap down to and the optical depth down to 0.035 (and even further down if recombinations are included), in clear disagreement with the observations. This again demonstrates that relatively high photon production efficiencies are required for the high redshift sources, similar to the ones we adopt here.

4.3 Globally-averaged reionization histories
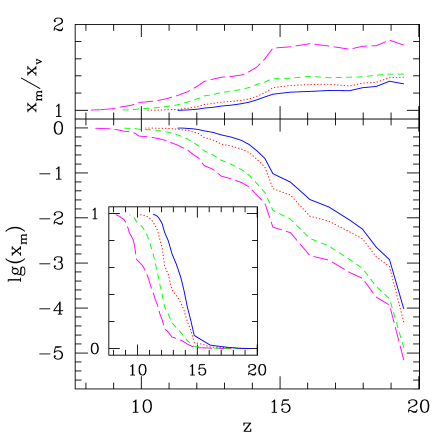
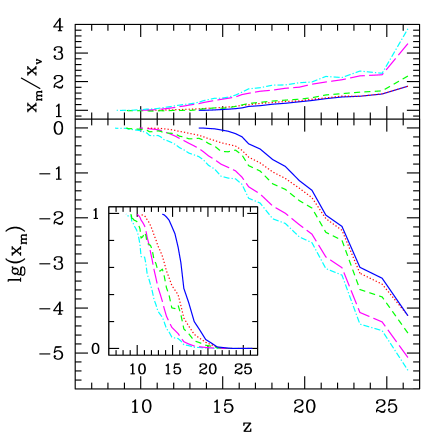
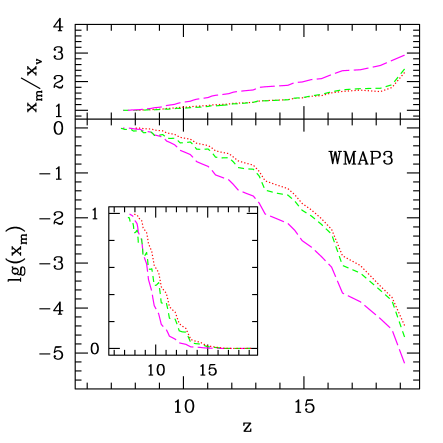
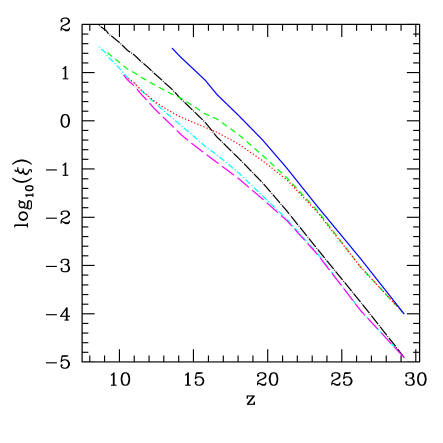
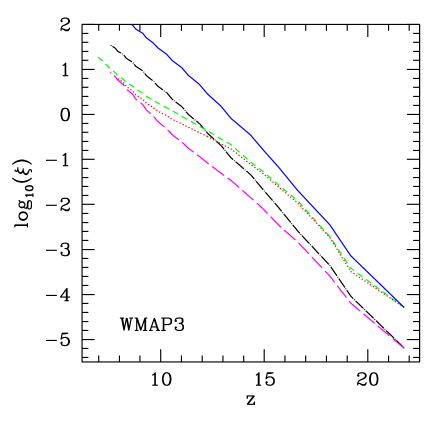
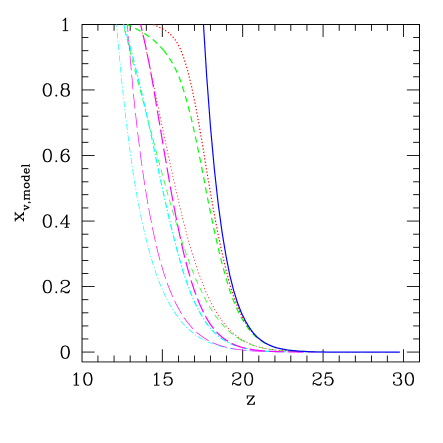
The full reionization histories (mass-weighted ionized fractions vs. redshift) from all of our simulations are shown in Figs. 1 and 2. The character of reionization is similar in all cases, regardless of the simulation volume or the background cosmology. In all cases reionization is clearly inside-out, with the high-density regions being ionized on average earlier than the low-density regions, as shown by the ratio of the mass-weighted to the volume-weighted ionized fraction, , which reflects the mean density of the ionized bubbles compared to the mean density of the universe, as reported previously in (Iliev et al. 2006b). These ratios are plotted in the top panels of Figs. 1 and 2. In all cases and at all times the ionized regions are overdense, more significantly so at early times. This inside-out character of the reionization process is more pronounced for the small-box simulations which have higher spatial resolution and thus follow the underlying density field more closely.
The evolution is always monotonic, and in no case we do see a double reionization or even a modest temporary decrease of the ionized fraction. The evolving source efficiencies (from a high one early-on to a low one later), small-scale gas clumping (from low values early to higher values later), and the Jeans-mass filtering of sources all only slow the process down and extend it in time, but never manage to reverse it even temporarily. The high-resolution, small-box simulations find somewhat more extended reionization than the large-box simulations, due to the earlier onset of reionization in these cases, combined with the suppression of small-mass sources.
4.4 Self-regulation
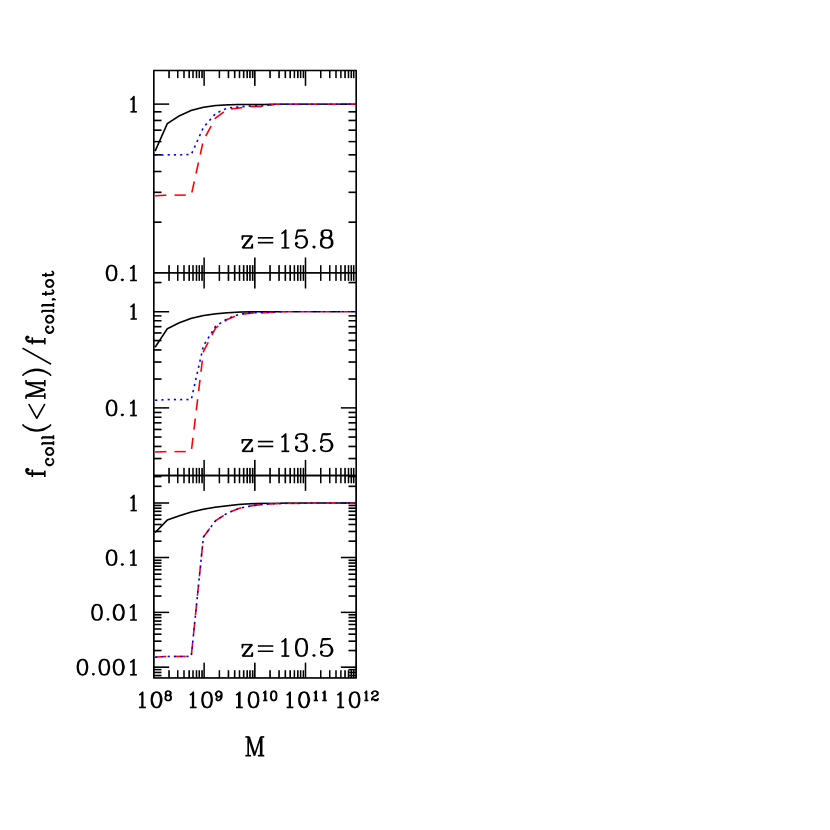
One interesting and important consequence of the low-mass source suppression is that the time of overlap becomes fairly insensitive to the efficiency of the small-mass sources, since these are almost completely suppressed by the reionization end. Furthermore, in cases when the small-mass sources are more efficient photon emitters, their H II regions expand quickly, thereby suppressing further source formation in a larger volume than less efficient sources do. This is illustrated in Figure 3, where we show the cumulative source halo collapsed fraction with and without suppression, normalized to the corresponding totals, at three different redshifts - early, middle and late in the evolution. During the early evolution, the high-efficiency of the small sources helps suppress a significantly larger fraction of them, by a factor of a few or more, compared to the low-efficiency case. At late times, the level of suppression becomes very large and essentially independent of the small-source efficiency. By then most of the volume is ionized, and due to the strong bias in their spatial clustering, concentrating them in the ionized regions, the effect on the small-mass sources is even more dramatic than simply the ionized volume would suggest. This suppression notably slows down the further expansion of the ionized bubbles, thus resulting in a very efficient self-regulation of reionization and a relative insensitivity of the global evolution to the assumed small-mass source efficiency. For example, if we compare the cases f2000_250S and f250_250S (with WMAP1 parameters), we find that the ratio of their mass ionized fractions starts at early-on (), decreasing to at and to or less for . The assumed small-mass source efficiency is 8 times larger in the former than in the latter case, while the larger, unsuppressible sources have the same efficiency in the two cases. This shows that during the very early evolution the ratio of the ionized fractions matches the ratio of the number of photons produced, but then the ionized fractions ratio quickly decreases as the evolution progresses and the low-mass source suppression and the corresponding self-regulation start to dominate the reionization process. With the WMAP3 background cosmology we observe the same generic behaviour, except that it is shifted to later times, as we discussed above.
In Figure 4 we show the total collapsed fractions in low-mass and high-mass halos for the computational box with WMAP1 parameters. At early times the collapsed fraction in small-mass halos rises faster and without suppression they dominate the large-mass halos at all times. The collapsed fraction in high-mass halos rises exponentially below . The collapsed fractions in the two mass ranges become comparable at . When suppression is included, large-mass halos begin to dominate the reionization progress much earlier, after , depending on the small-mass source efficiency, as shown in Figure 3 above.
In Figure 5 we show the evolution of the cumulative number of ionizing photons, , emitted by all sources in our Mpc simulation volume, for both the WMAP1 and the WMAP3 cases. The suppression of sources due to radiative feedback clearly has a quite dramatic effect on the cumulative , and can reduce it by up to 2 orders of magnitude in some cases compared to the case when no sources get suppressed. The effect is stronger when the small-mass sources are more efficient at producing ionizing photons, again demonstrating the self-regulated nature of reionization - more efficient sources suppress more, partially compensating for the higher efficiency. The emissivity per unit time and per baryon in the universe is given by . This derivative is strictly positive at all times since , and based on Fig. 5 also ), so the emissivity per baryon rises with time in all models we consider here .
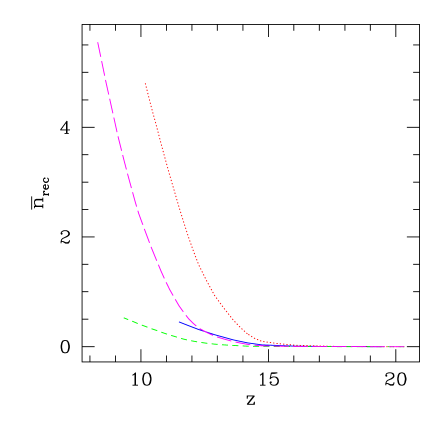
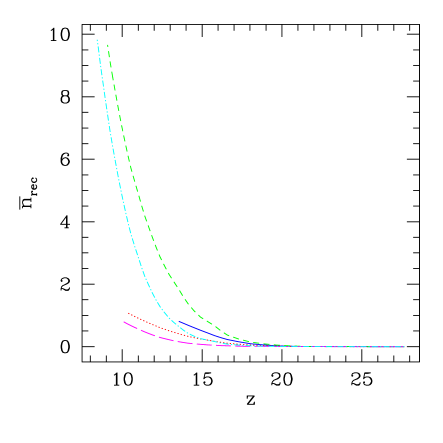
In Figure 6 we show the cumulative number of recombinations per atom in our computational volume. The number of recombinations is initially small since a very small fraction of the volume is ionized. This is despite the fact that these first H II regions are highly-overdense, and thus their recombination times are short. At later times, the recombinations become more important, consuming 0.5-1 additional photon per atom when sub-grid gas clumping is ignored (which underestimates the recombinations) and up to 5-10 additional photons per atom when sub-grid clumping is included. This demonstrates that recombinations play an important role during reionization and should not be ignored in any simulations or analytical models.
Some of these trends for the basic self-regulation of reionization were roughly anticipated by our analytical toy model in § 3. That model neglects several effects which our detailed simulations show are quite important, however. These include the inhomogeneous gas density inside the ionized regions and the clustered formation of source haloes in time and space, which biases their distribution and that of the H II regions relative to the underlying matter density field. In order to account for some of these neglected effects in an approximate way, to gain further insight and use the toy model quantitatively, we have incorporated the results of our simulations to improve the simple analytical model described in § 3 (see Appendix for details). In this improved model the volume-weighted ionized fraction evolves according to:
| (18) |
where is the correction factor which accounts for the fact that low-mass halos are concentrated toward the ionized regions rather than being distributed uniformly, or randomly in space. The photon emission rate is the mean photon emissivity per atom coming from the small-mass sources based on our modelling of sources in the radiative transfer simulations, where is the time between two time slices ( Myr), over which we hold the underlying gas density field and halo population fixed while we integrate the radiative transfer and the non-equilibrium ionization balance rate equations. In the toy model in § 3, the source suppression by Jeans-mass filtering is assumed to be limited to the ionized volume, with source halos randomly, or uniformly, distributed in space, thus the unsuppressed fraction is proportional to the neutral volume fraction, (i.e. in eq. [10]). We also consider a second case, where we empirically model the effects of halo spatial clustering bias by setting in equation (10) (see Appendix). The second term, is the same as but for the larger, unsuppressible sources. Finally, the last term, is the rate of recombinations per atom (assuming fully-ionized gas within the H II regions at the mean density). Recombinations only occur in the ionized volume, and so the volume-averaged rate is just proportional to . In reality, the H II regions are overdense on average, which we ignore here, and thus our model somewhat underestimates the effect of recombinations.
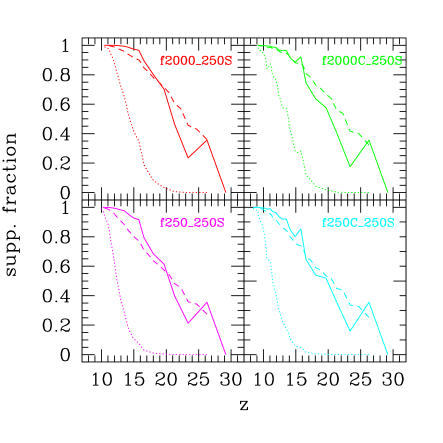
Solutions for the evolution of the mean ionized fraction based on our toy models are plotted in Figure 7 for the small-box simulation cases in Table 1. These curves show that when low-mass sources and their suppression are included, but bias is neglected (), the end of reionization is nearly the same, regardless of the efficiency adopted for photon release per low-mass halo atom (see curves for cases f2000_250S and f250_250S). When bias is incorporated () there is a very modest trend toward an earlier end of reionization when the low-mass source efficiency is higher. When bias is neglected, the reionization evolution tends to be too fast compared to the simulations; bias serves to slow reionization down because a larger fraction of the low-mass sources are suppressed at any given time than the neutral volume fraction , since these halos are concentrated in the H II regions. The effect of gas clumping is to delay the end of reionization, but since clumping grows with time and the contribution from recombinations in the ionized regions is small at early times, soon after the sources turn on, the evolution at early times is similar with and without clumping.
4.5 Effect of small-mass sources on the reionization morphology
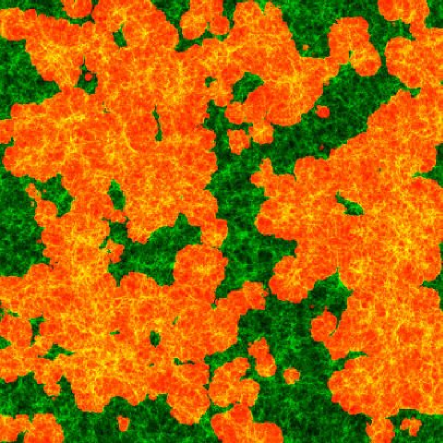
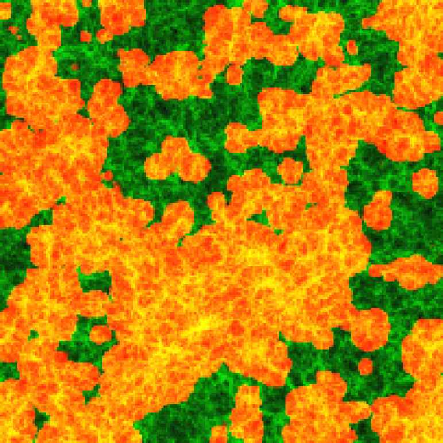
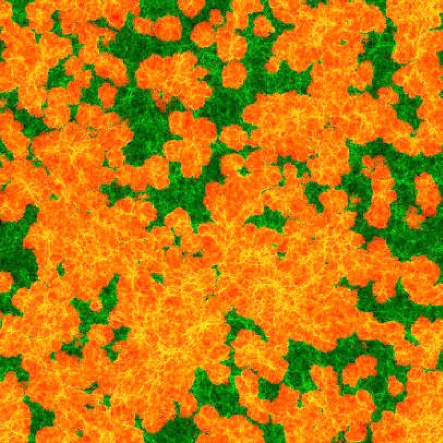
The morphology of the H II regions during reionization shows many common features, but also some interesting variations (Figs. 9 and 9). In general, H II regions persist and grow over time, as new sources form to add their ionizing luminosity to the total emission rate inside each ionized volume. In all cases reionization occurs inside-out, i.e. the denser regions around the high-density peaks are ionized first. Locally, at any given scale the ionized bubbles percolate at very different times. This local overlap leads to quite large (of size 10 Mpc comoving, or larger) ionized regions fairly early, well before the whole universe is ionized. This explains why previous, small-box simulations failed to see the gradual build-up of the ionized volume of the universe over time, prior to the final overlap epoch, and mistakenly found that reionization is a very rapid transition. At all times prior to overlap, there are also many isolated sources or small groups of sources which create a number of small H II regions. The low-density regions remain largely neutral during most of the evolution, since they are devoid of sources.
The case when only the large (and unsuppressible) sources are present (case f2000_406; Figure 9, left) has been discussed in some detail in Paper I. When smaller sources are also present, the resulting geometry depends on the radiative feedback upon them. When the low-mass sources are not suppressed, the basic morphology is similar to that when only larger sources were present (Figure 9), with some additional small-scale features due to the now-resolved small-mass sources. However, when the small-source suppression is included, the morphology changes, even with the same source efficiencies (Figure 9). There is more small-scale structure present, although the large, locally-percolated regions are of similar sizes to the ionized regions observed in the large-box simulations, indicating that by this time reionization is already dominated by the large-mass sources. In the presence of the small-mass, suppressible sources, there are also small, ”relic” H II regions occasionally, i.e. regions which were ionized earlier but are now recombining because some (or all) of the sources which made them originally were suppressed (these relic H II regions are seen as darker spots, mostly around the edges of the large ionized bubbles). Generally, these relic H II regions are short-lived, however, being quickly overrun by the I-fronts from neighbouring ionized bubbles, and thus do not have strong effects on the evolution.
A direct comparison of the morphology of reionization in the simulations presented here with those by other methods, such as reported by (Ciardi et al. 2003b) or (Zahn et al. 2006) is difficult, since some or all of the properties which determined their outcome, including box size, resolution, source efficiencies and cosmological parameters, are generally different. Of these, moreover, only the simulations presented here were able to resolve the low-mass source halos subject to suppression and took this suppression into account. We shall present a more detailed discussion of the characteristic scales and topology of reionization based upon our simulation results in a forthcoming paper, along with further comparisons. The purpose of the current paper, however, is to demonstrate the differences made by improving the resolution to take account of Jeans-mass filtering, as described above.
5 Conclusions
We have studied the effects of small-mass sources on the progress and duration of reionization based on a large suite of detailed radiative transfer simulations. We found that these small-mass sources play an important role during reionization. In their presence reionization starts much earlier, by in WMAP1 cosmology (at rather than at ), and by in WMAP3 cosmology (at rather than at ). They also supply most or all of the ionizing emissivity at early times, when the larger galaxies are still exceedingly rare.
However, the same low-mass sources are also a subject to suppression in the ionized regions due to Jeans-mass filtering. This low-mass source suppression decreases the global ionizing photon emissivity by factors of up to 100, depending on the photon production efficiency of the small-mass sources. As a consequence, the Jeans-mass filtering of small-mass sources effects the global reionization history profoundly, delaying overlap by , and decreasing the integrated electron-scattering optical depth by compared to the case without suppression. The evolving gas clumping at small (sub-grid) scales extends the reionization significantly, by , but has only a modest effect on the corresponding electron scattering optical depth, decreasing it by .
Furthermore, the reionization process is strongly self-regulated - the more efficient the small-mass sources are, the larger the fraction of them that are suppressed. This results in a corresponding decrease in the number of ionizing photons emitted, partially canceling the effects of the high efficiency. However, the later stages of reionization are completely dominated by the larger-mass sources which do not get suppressed. Their numbers rise exponentially as they become more common, while, in contrast, the low-mass halos are strongly suppressed at late times. As a result, the overlap epoch is not very sensitive to the properties of the low-mass sources, but instead is largely determined by the numbers and efficiencies of the high-mass sources. As a consequence, for a given overlap redshift there is a significant degeneracy between the small-mass source’s efficiency and the - by changing the efficiency of the small-mass sources we can easily increase or decrease the global integrated optical depth without changing the overlap redshift.
In short, the end of reionization is dictated by the higher-mass haloes which are not subject to Jeans-mass filtering, but the addition of small-mass, suppressible haloes serves to extend the reionization epoch to earlier times, thereby boosting . This naturally explains why WMAP CMB polarization measurements indicate a large and early beginning for reionization, for WMAP3, while the absorption spectra for quasars at indicate that the overlap epoch was at . Previous simulations failed to see this because they failed to include the small-mass halo sources with Jeans-mass filtering in a simulation volume big enough to sample the global reionization history fairly.
The combined effects of low-mass source suppression in the ionized regions, decreasing ionizing source efficiency and increasing gas clumping over time can cause reionization to “linger” at a given ionization fraction for some time, before eventually reaching overlap. However, none of our models show the double reionization predicted by Wyithe & Loeb (2003) and Cen (2003). What prevents double reionization from occurring is the large spread in the reionization histories from one region to another, combined with the strong source clustering and the self-regulation. Double reionization scenarios require that the highly-efficient Pop. III sources emit enough photons to reionize the universe at high redshift, but then die or become less efficient, causing the universe to partially recombine and be finally reionized later by the rise of Pop. II sources. However, these highly-efficient sources form at very different times in different places, and thus the transition from high-efficiency to low-efficiency sources is spread over time. These early sources also get suppressed quite efficiently, thus never get to large enough total emissivity at any given time, so as to reionize the whole universe. These self-regulation mechanisms should hold under quite generic circumstances, beyond our specific realizations. Some of these were previously discussed by Furlanetto & Loeb (2005) within a simplified analytical framework, which did not include some important effects like the strongly increased Jeans-mass filtering due to source clustering. Nevertheless, they reached conclusions similar to ours, namely that double reionization is not physically plausible.
Reionization proceeds in an inside-out fashion, whereby the high-density peaks become ionized first and voids last, thereby confirming the results of Iliev et al. (2006b). The mean overdensity of the ionized regions is always greater than one, and up to 4 at early times. This trend is even more pronounced in the smaller-box, high-resolution simulations, where the density fluctuations are resolved better. In this case also the shapes of the H II regions are more non-spherical during their early evolution. Since at early times both the ionized density field and the source distribution are strongly biased relative to the underlying density field, it is crucial to perform detailed numerical simulations in order to obtain the correct geometry, size and spatial distributions of the ionized bubbles. Most current semi-analytical models of reionization ignore the effects of halo bias on the Jeans-mass filtering, which leads to a large underestimate of the low-mass source suppression. The only exception is the very recent work of Kramer et al. (2006) which presented a model with an approximate, spherically-averaged source bias model. While such models cannot give the full H II region geometry, it would be interesting to compare their results to full simulations in order to see to what extend their statistical results are representing the bias effects reliably.
The overlap by redshift indicated by current observations is easily achieved by stellar sources with either a Salpeter or a slightly top-heavy IMF. There is, therefore, no need for additional, more “exotic” sources of radiation (e.g. decaying particles) in order to satisfy both the electron scattering optical depth constraint from WMAP and the end-of-reionization constraints coming from the SDSS QSO’s and high-redshift Ly- surveys, as they currently stand.
In WMAP3 cosmology the formation of cosmic structures, and thus the epoch of reionization, are delayed compared to WMAP1 cosmology, due to a combination of the lower normalization of the power spectrum of density fluctuations, tilt, lower matter density and slightly higher Hubble constant. This delay is such that it almost exactly compensates for the lower value of found by WMAP3, given ionizing sources with the same efficiency. This was predicted analytically by Alvarez et al. (2006b) and confirmed by our current simulations.
Our results show that our large-box simulations which include only the large-mass, unsuppressible sources, nevertheless predict correctly the overlap epoch and the large-scale features of reionization. This feature is a consequence of the strong self-regulation of reionization, due to which by the time H II regions grow large (roughly when ) the vast majority of the low-mass sources are already suppressed and the reionization process is driven by the large-mass sources. However, any simulations which do not include the low-mass sources would underestimate the ionized fraction, particularly at early times, and the small-scale features of reionization, both of which are influenced by the low-mass sources. The total integrated electron-scattering optical depth is thus also underestimated. Semi-analytical reionization models which do not include the self-regulation properly would similarly underestimate the mean ionized fraction history and the corresponding optical depth. On the other hand, the large-scale features of reionization are not very sensitive to the low-mass sources and their efficiencies, but depend significantly on the large-scale features of the density field, the clustering of the ionizing sources and level of clumpiness of the gas, all of which are most reliably modelled through large-scale reionization simulations.
Acknowledgments
This work was partially supported by NASA Astrophysical Theory Program grants NAG5-10825 and NNG04G177G to PRS.
References
- Abel et al. (2000) Abel T., Bryan G. L., Norman M. L., 2000, ApJ, 540, 39
- Abel et al. (2002) Abel T., Bryan G. L., Norman M. L., 2002, Science, 295, 93
- Alvarez et al. (2006a) Alvarez M. A., Bromm V., Shapiro P. R., 2006a, ApJ, 639, 621
- Alvarez et al. (2006b) Alvarez M. A., Shapiro P. R., Ahn K., Iliev I. T., 2006b, ApJL, 644, L101
- Bi & Davidsen (1997) Bi H., Davidsen A. F., 1997, ApJ, 479, 523
- Bromm et al. (2002) Bromm V., Coppi P. S., Larson R. B., 2002, ApJ, 564, 23
- Bromm et al. (2001) Bromm V., Kudritzki R. P., Loeb A., 2001, ApJ, 552, 464
- Cen (2003) Cen R., 2003, ApJ, 591, 12
- Chiu & Ostriker (2000) Chiu W. A., Ostriker J. P., 2000, ApJ, 534, 507
- Ciardi et al. (2000) Ciardi B., Ferrara A., Governato F., Jenkins A., 2000, MNRAS, 314, 611
- Ciardi et al. (2003a) Ciardi B., Ferrara A., White S. D. M., 2003a, MNRAS, 344, L7
- Ciardi et al. (2006) Ciardi B., Scannapieco E., Stoehr F., Ferrara A., Iliev I. T., Shapiro P. R., 2006, MNRAS, 366, 689
- Ciardi et al. (2003b) Ciardi B., Stoehr F., White S. D. M., 2003b, MNRAS, 343, 1101
- Couchman (1985) Couchman H. M. P., 1985, MNRAS, 214, 137
- Dijkstra et al. (2004) Dijkstra M., Haiman Z., Rees M. J., Weinberg D. H., 2004, ApJ, 601, 666
- Efstathiou (1992) Efstathiou G., 1992, MNRAS, 256, 43P
- Fan et al. (2002) Fan X., Narayanan V. K., Strauss M. A., White R. L., Becker R. H., Pentericci L., Rix H.-W., 2002, AJ, 123, 1247
- Furlanetto & Loeb (2005) Furlanetto S. R., Loeb A., 2005, ApJ, 634, 1
- Glover & Brand (2003) Glover S. C. O., Brand P. W. J. L., 2003, MNRAS, 340, 210
- Gnedin (2000) Gnedin N. Y., 2000, ApJ, 542, 535
- Gnedin & Hui (1998) Gnedin N. Y., Hui L., 1998, MNRAS, 296, 44
- Haiman et al. (2000) Haiman Z., Abel T., Rees M. J., 2000, ApJ, 534, 11
- Haiman & Holder (2003) Haiman Z., Holder G. P., 2003, ApJ, 595, 1
- Iliev et al. (2006a) Iliev I. T., Ciardi B., Alvarez M. A., Maselli A., Ferrara A., Gnedin N. Y., Mellema G., Nakamoto T., Norman M. L., Razoumov A. O., Rijkhorst E.-J., Ritzerveld J., Shapiro P. R., Susa H., Umemura M., Whalen D. J., 2006a, MNRAS, 371, 1057
- Iliev et al. (2006b) Iliev I. T., Mellema G., Pen U.-L., Merz H., Shapiro P. R., Alvarez M. A., 2006b, MNRAS, 369, 1625
- Iliev et al. (2005a) Iliev I. T., Scannapieco E., Shapiro P. R., 2005a, ApJ, 624, 491
- Iliev & Shapiro (2001) Iliev I. T., Shapiro P. R., 2001, MNRAS, 325, 468
- Iliev et al. (2002) Iliev I. T., Shapiro P. R., Ferrara A., Martel H., 2002, ApJL, 572, L123
- Iliev et al. (2005b) Iliev I. T., Shapiro P. R., Raga A. C., 2005b, MNRAS, 361, 405
- Kitayama et al. (2004) Kitayama T., Yoshida N., Susa H., Umemura M., 2004, ApJ, 613, 631
- Kohler et al. (2005) Kohler K., Gnedin N. Y., Hamilton A. J. S., 2005, ArXiv Astrophysics e-prints (astro-ph/0511627)
- Kramer et al. (2006) Kramer R. H., Haiman Z., Oh S. P., 2006, ApJ, 649, 570
- Leitherer et al. (1999) Leitherer C., Schaerer D., Goldader J. D., Delgado R. M. G., Robert C., Kune D. F., de Mello D. F., Devost D., Heckman T. M., 1999, ApJS, 123, 3
- Malhotra & Rhoads (2004) Malhotra S., Rhoads J. E., 2004, ApJL, 617, L5
- Mellema et al. (2006a) Mellema G., Iliev I. T., Alvarez M. A., Shapiro P. R., 2006a, New Astronomy, 11, 374
- Mellema et al. (2006b) Mellema G., Iliev I. T., Pen U.-L., Shapiro P. R., 2006b, MNRAS, 372, 679
- Merz et al. (2005) Merz H., Pen U.-L., Trac H., 2005, New Astronomy, 10, 393
- Nakamoto et al. (2001) Nakamoto T., Umemura M., Susa H., 2001, MNRAS, 321, 593
- Navarro & Steinmetz (1997) Navarro J. F., Steinmetz M., 1997, ApJ, 478, 13
- Onken & Miralda-Escudé (2004) Onken C. A., Miralda-Escudé J., 2004, ApJ, 610, 1
- Popa (2006) Popa L. A., 2006, ArXiv Astrophysics e-prints (astro-ph/0605358)
- Razoumov et al. (2002) Razoumov A. O., Norman M. L., Abel T., Scott D., 2002, ApJ, 572, 695
- Ricotti et al. (2002) Ricotti M., Gnedin N. Y., Shull J. M., 2002, ApJ, 575, 49
- Schaerer (2002) Schaerer D., 2002, A&A, 382, 28
- Shapiro (1995) Shapiro P. R., 1995, in Ferrara A., McKee C. F., Heiles C., Shapiro P. R., eds, ASP Conf. Ser. 80: The Physics of the Interstellar Medium and Intergalactic Medium The Reionization of the Intergalactic Medium. pp 55–+
- Shapiro & Giroux (1987) Shapiro P. R., Giroux M. L., 1987, ApJ, 321, L107
- Shapiro et al. (1994) Shapiro P. R., Giroux M. L., Babul A., 1994, ApJ, 427, 25
- Shapiro et al. (2004) Shapiro P. R., Iliev I. T., Raga A. C., 2004, MNRAS, 348, 753
- Sokasian et al. (2003) Sokasian A., Abel T., Hernquist L., Springel V., 2003, MNRAS, 344, 607
- Spergel & et al. (2003) Spergel D. N., et al. 2003, ApJS, 148, 175
- Spergel & et al. (2006) Spergel D. N., et al. 2006, ArXiv Astrophysics e-prints (arXiv:astro-ph/0603449)
- Thoul & Weinberg (1996) Thoul A. A., Weinberg D. H., 1996, ApJ, 465, 608
- Venkatesan & Truran (2003) Venkatesan A., Truran J. W., 2003, ApJL, 594, L1
- Whalen et al. (2004) Whalen D., Abel T., Norman M. L., 2004, ApJ, 610, 14
- White et al. (2003) White R. L., Becker R. H., Fan X., Strauss M. A., 2003, AJ, 126, 1
- Wyithe & Loeb (2003) Wyithe J. S. B., Loeb A., 2003, ApJ, 586, 693
- Zahn et al. (2006) Zahn O., Lidz A., McQuinn M., Dutta S., Hernquist L., Zaldarriaga M., Furlanetto S. R., 2006, ArXiv Astrophysics e-prints (astro-ph/0604177)
Appendix A A Simple toy model for reionization with self-regulation and halo bias
In order to gain some further insight into the self-regulation of reionization and its dependence on the assumed parameters, we construct the following simple toy model. The global average rate of change of the ionized volume fraction with time, , is determined by the rate of emission of ionizing photons and the rate of recombinations (per atom in the universe). The ionizing source model we use in our radiative transfer simulations assumes that their emissivity is proportional to the collapsed gas fraction in halos, , with a given efficiency, (see § 2.2). In this, we distinguish the sources whose formation is suppressed inside the H II regions by Jeans-mass filtering from the high-mass sources, whose formation is not suppressed. In this framework the rates of emission of ionizing photons from the small-mass and large-mass sources are given by and , respectively, where is the time over which these photons are emitted. The former rate should also be modulated by the ionized fraction, since small sources are suppressed in ionized regions. In the simplest approximation, one can assume that the suppressed fraction of small-mass sources is simply proportional to the ionized volume fraction, , i.e. the emitting (unsuppressed) fraction is given by . Such a model would be exact if the small-mass sources were randomly distributed in space. In practice, however, the halos that host the sources are generally clustered together, thus the suppression of small-mass sources should be stronger than a random distribution would give, as these sources cluster around the high-density peaks, which are ionized earlier in the inside-out reionization yielded by simulations. Therefore, in an effort to crudely model the effects of this source bias, we also consider a second case, where we modulate the suppression by a factor of , where we set ( corresponds to the random distribution above). This power of 0.1 was determined empirically, by roughly matching the actual Jeans-mass suppressed fraction from our simulations to . In Figure 10 we plot both models against the actual data from the simulations (for WMAP1 parameters). We note that this simple model is not intended to match the simulation results perfectly, but rather to show how the mean reionization histories vary under different assumptions. Thus, even though it does not follow the Jeans-suppressed source fraction exactly, it it is appropriate for our purposes here, as it reflects the main evolutionary trends seen in our simulations.
Finally, the rate of recombinations per unit time per atom is given simply by the inverse of the recombination time, , where is the (evolving) clumping factor, is the Case B recombination rate of hydrogen, and we assume full ionization in the H II regions. Combining these factors, we can write the equation for the evolution of the volume-weighted ionized fraction as:
| (19) |
Based on our simulation data (in WMAP1 cosmology), the functions and as function of redshift are well-fit by the following expressions:
| (20) | |||||
| (21) |
while is given by
| (22) |
Finally, in order to use these expressions directly, we need to change the independent variable in equation 19 from time to redshift, using
| (23) |
as appropriate for flat cosmology. The results given by this model are plotted in Figure 7 and discussed in the main text.