Spitzer Observations of the Prototypical Extremely Red Objects
HR 10 and LBDS 53W091: Separating Dusty Starbursts from Old Elliptical Galaxies
Abstract
We present Spitzer Space Telescope observations of the well-studied extremely red objects (EROs) HR 10 and LBDS 53W091 from 3.6 m to 160 m. These galaxies are the prototypes of the two primary classes of EROs: dusty starbursts and old, evolved galaxies, respectively. Both galaxies, as well as LBDS 53W069, another example of an old, quiescent galaxy, are well-detected out to 8 m. However, only the dusty starburst HR 10 is detected in the far-infrared. All three EROs have stellar masses of a few . Using evolutionary model fits to their multiband photometry, we predict the infrared colors of similar EROs at . We find that blueward of observed 10 m, the two ERO classes are virtually indistinguishable photometrically. Deep spectroscopy and 24 m data allow the classes to be separated.
1 Introduction
It has now been nearly twenty years since the first near-infrared surveys identified an intriguing population of optically faint galaxies with surprisingly bright near-infrared magnitudes (Elston, Rieke, & Rieke 1988, 1989). Initially proposed to be extremely distant () sources whose optical emission was absorbed by intergalactic hydrogen (e.g. Mobasher et al. 2005), the “extremely red object” (ERO) population111EROs are typically selected to have extreme optical-minus-infrared colors, such as . is now instead recognized to be primarily comprised of two interesting galaxy populations: (1) old, evolved galaxies whose red colors are caused by a dearth of young, luminous, massive stars, and (2) dusty starburst galaxies whose red colors are caused by dust absorption of the bluer light in actively star-forming regions. The prototype of each class is, respectively, the “old, dead, and red” radio galaxy LBDS 53W091 at (Dunlop et al. 1996; Spinrad et al. 1997) and the dusty starburst galaxy HR 10 at (Hu & Ridgway 1994; Graham & Dey 1996; Dey et al. 1999). The weak radio galaxy LBDS 53W069 at (Nolan et al. 2003; Dey et al. 2006) is a second well-studied example of the old, evolved ERO class. EROs have a surface density of approximately 1000 deg-2 for and (Vega), and comprise of all -selected galaxies to (Thompson et al. 1999; Moustakas et al. 2004). For a recent comprehensive review of EROs see McCarthy (2004).
With redshifts (e.g. Cimatti et al. 2003), clustering properties similar to elliptical galaxies (Daddi et al. 2003; Moustakas & Somerville 2002), and substantial stellar masses that contribute significant fractions of the global stellar mass density at the redshifts they are found (e.g. Kong et al. 2006), EROs clearly are an important population in the context of understanding galaxy formation and evolution (e.g. Somerville et al. 2004; Nagamine et al. 2005). Volume-limited galaxy surveys of the local universe find a clear bimodality in galaxy properties, with the “red sequence” generally populated by the more massive and established galaxies (e.g. Kauffmann et al. 2003; Blanton et al. 2005). There is increasing evidence that this sequence is securely in place not only out to (Bell et al. 2004; Faber et al. 2006), but possibly to much higher redshifts (Rocca-Volmerange et al. 2004; Labbé et al. 2005; Papovich et al. 2006). The processes by which these massive galaxies form must happen early. This is consistent with measurements of the evolution of the global stellar mass density in field surveys. While between half and three-quarters of the present-day stellar mass is in place by (Dickinson et al. 2003; Rudnick et al. 2003; Fontana et al. 2004; Drory et al. 2004), only of the present-day stellar mass is in place at (Drory et al. 2005). The evolution of is dramatic: either the high-redshift accountings are incomplete (e.g. because of cosmic variance effects, unaccounted for obscured populations, or significant population synthesis deficiencies), or probes in that redshift range will see the most dramatic epoch of galaxy assembly in progress. Indeed, studies of infrared selected samples of distant galaxies in the Great Observatories Origins Deep Survey (GOODS; Giavalisco et al. 2004) find significant evidence of massive galaxy assembly at (Caputi et al. 2006; Papovich et al. 2006). Understanding ERO demographics and energetics will provide key insight into all of these fundamental questions.
EROs are represented by two different galaxy populations. With enough dedicated time and effort, young, dusty starbursts and old, evolved galaxies may be distinguished through spectroscopic features in the restframe UV and optical (e.g. Cimatti et al. 2002a). A photometric technique proposed by Pozzetti & Mannucci (2000) to distinguish between ERO types using combinations of optical and near-infrared colors was designed to work for objects around (e.g. Mannucci et al. 2002). Dorman, O’Connell, & Rood (2003) suggest an alternate discriminating technique using mid-ultraviolet colors. A more detailed look at the actual m spectral energy distributions (SEDs) of EROs by Moustakas et al. (2004) demonstrates that a larger baseline, extending longward of the observed -band, is needed to differentiate all but the most dramatic EROs.
In this paper we present 3.6 m to 160 m observations of the archetypical EROs obtained with the Spitzer Space Telescope (Werner et al. 2004). Section 2 briefly summarizes previous studies of these three EROs. Section 3 describes the Spitzer observations and data reduction, followed by an analysis of the broadband SEDs of these galaxies in § 4. Surprisingly, the two ERO populations remain nearly indistinguishable out to observed 8 m (rest-frame 3.2 m) and it is only at longer wavelengths that the populations separate (§ 5). We adopt the concordance cosmology and use Vega-system magnitudes unless stated otherwise.
2 Prototypical EROs
2.1 HR 10
HR 10 (or ERO J1645024626.4) is the archetype of the dusty starburst subclass of EROs. With and , HR 10 was first identified by Hu & Ridgway (1994) in deep, multiband imaging of the damped Ly quasar PC 16434631A (; Schneider, Schmidt, & Gunn 1991). Hu & Ridgway (1994) initially suggested that HR 10 and another ERO in the field (HR 14 or ERO J1644574626.0) could be distant, evolved ellipticals lying at , but subsequent observations from the Keck telescopes by Graham & Dey (1996) and Dey et al. (1999) showed that HR 10 is a moderately distant () galaxy with an asymmetric morphology and [O II] and H in emission. This suggested that HR 10 was not related to an evolved elliptical, but was rather a distant counterpart of the local ultraluminous infrared galaxies (ULIRGs) discovered by the Infrared Astronomical Satellite (IRAS). Strong detections of HR 10 at submillimeter wavelengths (Cimatti et al. 1998; Dey et al. 1999; Greve, Ivison, & Papadopoulos 2003) showed the presence of significant dust (; Greve et al. 2003), unambiguously demonstrating that HR 10 is indeed a gas-rich, dust-enshrouded galaxy.
A long-standing open issue has been the role of a possible active nucleus in the (long-wavelength) energetics of HR 10. Assuming the submillimeter flux is mainly due to optically-thin thermal emission from dust heated by a young, star-forming population, the m luminosity, , translates to a star formation rate of about (Greve et al. 2003). This starburst-dominant hypothesis has been favored by the lack of strong evidence of an AGN in the spectral data (Dey et al. 1999). Furthermore, the mid-infrared SED of HR 10 as measured by ISOCAM on the Infrared Space Observatory (ISO) is similar to that of Arp 220, a well-studied, local ULIRG whose dominant source of energy is believed to be star formation (Elbaz et al. 2002).
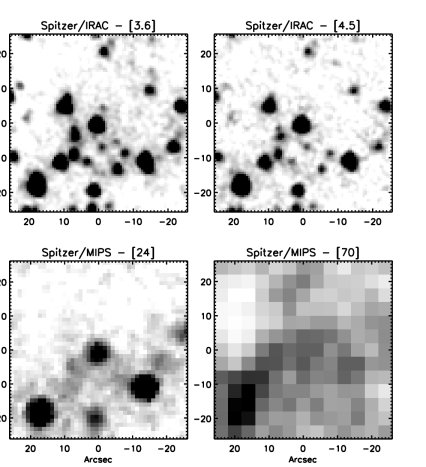
The m photometry of HR 10 remains somewhat uncertain, with several Submillimetre Common-User Bolometer Array (SCUBA; Holland et al. 1999) observations resulting in disparate flux density measurements (see Table Spitzer Observations of the Prototypical Extremely Red Objects HR 10 and LBDS 53W091: Separating Dusty Starbursts from Old Elliptical Galaxies). The observations by Cimatti et al. (1998) and Dey et al. (1999) were both obtained using SCUBA in “photometry mode”, providing a single pixel measurement. The latter data set is twice as large and was obtained in exceptional observing conditions and is therefore presumed the more reliable measurement. The observations by Greve et al. (2003) were obtained in “jiggle map mode”, providing an image of the field and photometry closer to that measured by Cimatti et al. (1998). Greve et al. (2003) identify a mJy SCUBA source approximately 50″ SSW of HR 10, and suggest that the extended emission from this second source may have affected the sky background estimates in the photometry mode observations, thereby corrupting those measurements. An additional source, approximately 30″ SE of HR 10, may also be confusing the SCUBA measurements. This source is faintly visible in the jiggle map of Greve et al. (2003), and is well-detected in our Spitzer observations described in § 3, becoming significantly brighter than HR 10 at wavelengths longward of m (see Fig. 1a).
2.2 LBDS 53W091
LBDS 53W091 is the archetype of the evolved elliptical subclass of EROs. With and , LBDS 53W091 is among the reddest counterparts to weak radio sources (1 mJy mJy) in the Leiden-Berkeley Deep Survey (LBDS; Windhorst, van Heerde, & Katgert 1984b; Windhorst, Kron, & Koo 1984a). Probing sources with these faint radio fluxes is expected to identify sources whose scattered AGN contribution to the total continuum emission is small (e.g. Dunlop & Peacock 1993; Eales & Rawlings 1993). Spectroscopic observations with the Keck telescope provided an absorption-line redshift, , and a rest-frame ultraviolet spectrum very similar to an F6 V star and the local elliptical galaxy M32 (Dunlop et al. 1996; Spinrad et al. 1997). The optical spectrum shows no evidence of either an AGN or recent star formation.
The implied stellar age of Gyr was cosmologically-interesting and controversial at the time of initial publication (e.g. Spinrad et al. 1997; Krauss 1997; Yi et al. 2000), which was prior to the current “concordance cosmology.” For example, an and Einstein-de Sitter universe is only 2.3 Gyr old at . Even for the “concordance cosmology” ( and ), the universe is only 4.1 Gyr old at , requiring an early formation of the stellar populations of LBDS 53W091. Galaxy 3a, approximately 3″ SE of LBDS 53W091 and a few tenths of a magnitude fainter, has an optical spectrum and optical to near-IR colors similar to LBDS 53W091. Galaxy 3a is thought to be a faint companion, of similar age and redshift to LBDS 53W091 (Spinrad et al. 1997; Bunker et al. 2006).
Images of LBDS 53W091 with the Near-Infrared Camera and Multiobject Spectrograph (NICMOS) on the Hubble Space Telescope (HST) reveal LBDS 53W091 to have a regular de Vaucouleurs (1948) profile with an effective radius of ( kpc; Waddington et al. 2002; Bunker et al. 2006). Assuming passive evolution of its stellar populations, LBDS 53W091 lies well within the scatter of the Kormendy (1977) relation, consistent with this milliJansky radio source at being an early-type galaxy which will passively evolve into an ordinary elliptical by the present day.
2.3 LBDS 53W069
LBDS 53W069 is a second, well-studied example of the evolved elliptical subclass of EROs. Slightly brighter than LBDS 53W091 at optical and near-infrared wavelengths, LBDS 53W069 is a weak radio source whose optical spectrum reveals an Gyr-old stellar population at (Nolan et al. 2003; Dey et al. 2006). NICMOS images again reveal a regular, profile, consistent with the Kormendy relation (Waddington et al. 2002; Bunker et al. 2006). Submillimeter observations of LBDS 53W069 obtained by Archibald et al. (2001) fail to detect this galaxy, again consistent with LBDS 53W069 no longer being actively involved in star formation.
3 Observations and Data Reduction
We obtained images from 3.6 m to 160 m of these prototypical EROs with the Spitzer Space Telescope as part of guaranteed time observations. These observations employed both the Infrared Array Camera (IRAC; Fazio et al. 2004) and the Multiband Imaging Photometer for Spitzer (MIPS; Rieke et al. 2004).
3.1 IRAC
Both LBDS 53W091 and LBDS 53W069 were observed with IRAC on 2004 February 17, and HR 10 was observed on 2004 February 18. Exposures with IRAC totaled 900 sec per target, obtained as nine 100 sec dithered frames using the small-scale, cycling dither pattern. Due to the higher background at longer wavelengths, there are twice as many frames in IRAC channel 4 (8.0 m), each with half the frame time.
We made minor modifications to the pipeline-processed data. Beginning with the basic calibrated data from the IRAC pipeline (version S11.0.2), we corrected the “pulldown” and “muxbleed” associated with well-exposed pixels in IRAC channels 1 (3.6 m) and 2 (4.5 m). The empirically-derived muxbleed corrections were derived from a large set of IRAC data taken with the same exposure time. We then reran the MOPEX222http://ssc.spitzer.caltech.edu/postbcd/. mosaicing software with modified cosmic-ray rejection parameters and an output pixel scale reduced by 50% to improve the sampling of the final images. Source Extractor (Bertin & Arnouts 1996) was used to derive photometry in diameter apertures for most sources, which were then corrected to total magnitudes assuming sources are unresolved at the relatively coarse () spatial resolution of Spitzer. The exceptions were galaxies in close proximity to other sources, e.g. LBDS 53W091. For these galaxies, where source blending can compromise accurate photometry, we measured fluxes in diameter apertures, which were then corrected to total magnitudes assuming the sources were unresolved.
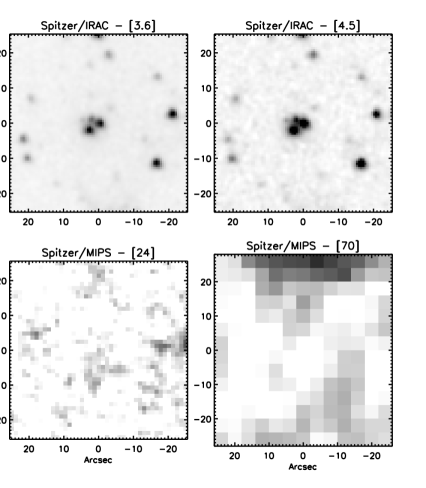
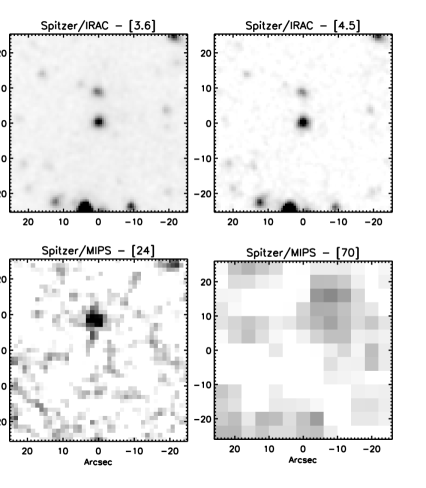
Fig. 1 presents the processed IRAC images. For reference, optical images obtained with the Wide-Field Planetary Camera 2 (WFPC2; Trauger, Ballester, & Burrows 1994) on the HST are also presented. These data, all obtained with the F814W filter, are from the Multimission Archive at the Space Telescope Science Institute333http://archive.stsci.edu/.
3.2 MIPS
Both HR 10 and LBDS 53W069 were observed with MIPS on 2004 April 8, and LBDS 53W091 was observed on 2004 April 10. The observations were performed in MIPS small scale photometry mode with 30 sec 5 cycles, 10 sec 10 cycles and 10 sec 5 cycles at 24, 70 and 160 m, respectively. The 160 m observations also incorporated a 1 3 map, stepping by 75% of the field of view. The total integration times on source were 2100 sec at 24 m, 1000 sec at 70 m and 300 sec at 160m.
The 24 m and 70 m pipeline (version S11.4.0) basic calibrated data (BCD) products were the starting point for the reductions. The 24 m BCDs were then reprocessed to correct for flat fielding patterns due to residue on the MIPS scan mirror, “jailbar” patterns caused by bright cosmic rays artificially suppressing one or more of the four readout channels, and gradients in the background subtraction due to variation in either the dark current or the actual sky background. The 70 m BCDs were column and time filtered to correct for cosmic rays and response variations. Details of 24 m and 70 m artifacts can be found in the MIPS data handbook. The reprocessed BCD frames were mosaiced together using MOPEX. For 160 m, the default pipeline processed mosaic failed to detect any of the sources. For this bandpass, we present upper limits derived from the Spitzer Sensitivity Performance Estimation Tool444http://ssc.spitzer.caltech.edu/tools/senspet/. for medium background level. This is a conservative limit since all three sources were actually observed at low background levels ( MJy sr-1).
Photometry at 24 m and 70 m was performed using a point source fitting algorithm, whereby the positions of the source in the shorter wavelength IRAC data was fed in as a prior. This has been shown to provide accurate photometry as demonstrated in the GOODS datasets (Chary et al., in preparation). The 70 m photometry derived here was corrected upwards by approximately 5% to account for flux suppression by the time and column filtering process.
The Spitzer photometry is presented in Tables Spitzer Observations of the Prototypical Extremely Red Objects HR 10 and LBDS 53W091: Separating Dusty Starbursts from Old Elliptical Galaxies Spitzer Observations of the Prototypical Extremely Red Objects HR 10 and LBDS 53W091: Separating Dusty Starbursts from Old Elliptical Galaxies, along with photometry at other wavelengths derived from the literature. Where no detection is made, upper limits are given. The broadband SEDs of all three EROs are presented in Fig. 2.
4 Spectral Energy Distributions
We next fit the broadband SEDs with galaxy template models with the goal of deriving basic properties of the galaxies, such as stellar mass and far-infrared luminosity. The new data from Spitzer have the capacity to significantly refine previous determinations of these properties. For the SED fitting, described below, we omit some of the photometric points presented in Table 1. First, where HST imaging is available at similar wavelengths to ground-based imaging (e.g. -band/F814W and -band/F110W), we use only the higher signal-to-noise ratio HST photometry. Second, we do not include detections in our fits. Finally, we omit the early (circa 1985) CCD Palomar 200′′ imaging of the LBDS sources whose photometry typically compare poorly with more recent, deeper photometry obtained by HST and the Keck telescopes.
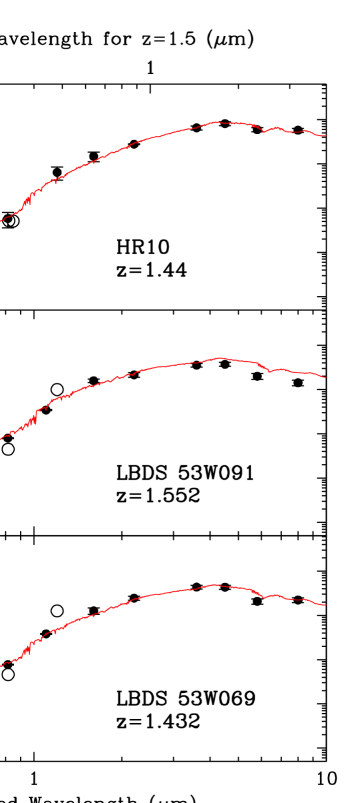
We fit Bruzual & Charlot (2003, BC03) model SEDs to the optical thru mid-infrared (m) fluxes of these sources. We adopt a Salpeter initial mass function with solar metallicity templates, leaving the mass of the galaxy, dust extinction, age of the starburst and -folding time of the starburst as free parameters. Dust was assumed to be distributed in a screen. Both starburst and galactic extinction laws were tried. The models were redshifted and convolved through the relevant filter response/quantum efficiency curves. A weighted, reduced, chi-square fit was performed to the observed data points after multiplication with a model normalization factor which represents the combined mass of stars and gas. The mass fraction in stars was extracted from the corresponding BC03 model file and multiplied by the normalization factor to derive the total mass in stars. Fig. 2 presents the best-fit BC03 models to all three EROs and Table 4 presents the parameters of the best-fit models. Fig. 2a presents the full SED, while Fig. 2b only shows the bluer wavelengths of the SED, where the emission is dominated by starlight.
We find that the LBDS galaxies have stellar masses of , while HR 10 has a stellar mass roughly twice as large. Modulo differences in the assumed initial mass function, these values are the average stellar mass of an galaxy in the local universe (; Cole et al. 2001) or of evolved infrared-selected galaxies in the Hubble Deep Field - South (; Labbé et al. 2005). We find ages of a few Gyr for the evolved galaxies, comparable to the more carefully determined ages based on fitting the observed optical spectra (Spinrad et al. 1997; Nolan et al. 2003). Surprisingly, our best-fit model to HR 10 has a comparable age, albeit with heavy extinction, .
To fit the longer wavelength Spitzer and (sub)mm data for HR 10, we adopted the Chary & Elbaz (2001, CE01) range of far-infrared spectral energy distributions. The CE01 templates provide a range of mid- and far-infrared SEDs as a function of the far-infrared luminosity, . They are empirically derived templates based on observations of nearby infrared luminous galaxies and incorporate components associated with continua from multi-temperature dust grains, emission from polycyclic aromatic hydrocarbons, and absorption due to silicate dust. These templates have been shown to follow the luminosity-luminosity correlations in IRAS passbands seen for nearby galaxies. As with the BC03 fits to the stellar emission, the dust emission has been redshifted and convolved through the relevant passbands. We also attempted to fit the observed fluxes with a combination of the CE01 templates and obscuration based on the Li & Draine (2002) model which would most prominently introduce a spectral feature at 9.7m corresponding to silicate absorption. We find that a fit including the Li & Draine (2002) model for dust obscuration provides a better fit to the mid-infrared data points, although the derived remains essentially unchanged. The resultant obscuration corresponds to mag, which is significantly larger than that seen in the optical/near-infrared. This suggests that HR10 has regions of heavily obscured star-formation which make it a ULIRG. With more accurate measurements of the Wien side of the thermal dust emission, our derived far-infrared luminosity is approximately 40% that derived by Greve et al. (2003) and Elbaz et al. (2002). Fig. 2a presents the best-fit CE01 far-infrared template. Since the CE01 templates are based on real galaxies and include stellar populations, Fig. 2a shows the best-fit CE01 template only at longer wavelengths (m), stitched to the best-fit BC03 stellar population template at shorter wavelengths.
It has been suggested that HR 10 is a scaled up version of Arp 220 (Elbaz et al. 2002). We find that the mid-infrared and far-infrared SED of HR 10 shows significant differences in comparison with Arp 220 (Fig. 3). The mid-infrared colors of HR 10 are better fit by an SED including strong polycyclic aromatic hydrocarbon (PAH) in emission and weak silicate in absorption. The derived extinction from the silicate absorption is mag. In contrast, Arp 220 has a very strong silicate feature, indicative of mags. Since HR 10 is approximately twice as luminous than Arp 220 (Elbaz et al. 2002), the strength of the silicate feature apparently does not scale with far-infrared luminosity as would be naively expected. HR 10 also appears to have a cooler color temperature for the far-infrared emission which is more typical for the local ULIRG population than the SED exhibited by Arp 220.
Since the photometry of HR 10 is well-fit with purely stellar populations with dust, we infer that the energetics of this galaxy is dominated by starlight. The radio detection of HR 10 is fully consistent with the CE01 template, implying that it obeys the radio – far-infrared correlation observed in local star-forming galaxies (Yun & Carilli 2002). If HR 10 does indeed host an AGN, the active nucleus apparently plays a negligible role in the broadband emission from this galaxy.
Finally, to fit the radio portion of the LBDS SEDs, we fit the data with a self-absorbed synchrotron emission spectrum. Neglecting the high-energy cut-off, this can be approximated by a parabola-shaped curve in the log-log plane for frequencies lower than the frequency at which the plasma optical depth becomes unity, (e.g. Andreani et al. 2002). We adopt MHz for both sources and fit for the normalization and curvature of the radio spectrum. The results are plotted in Fig. 2a and illustrate that the synchrotron emission which dominates the radio portion of the LBDS SEDs has negligible contribution to the optical through far-infrared emission for these sources.
5 Separating Dusty Starbursts from Old Ellipticals
It has been nearly a decade since the recognition that EROs constitute a bimodal population of dusty, star-forming galaxies and quiescent, evolved galaxies. As EROs seem to be the likely progenitors of present day early-type galaxies (e.g. Moustakas & Somerville 2002), measuring their relative fractions with confidence is an important measurement for feedback into models of galaxy formation.
Deep spectroscopy can unambiguously separate the two ERO populations, but is very expensive in telescope resources and typically suffers from high incompleteness rates. Independent spectroscopic samples of EROs studied by Cimatti et al. (2002b) and Yan, Thompson, & Soifer (2004a) both found roughly equal distributions of emission line galaxies and purely absorption line galaxies. These spectroscopic classes are presumed associated with dusty starbursts and evolved early-type EROs, respectively. More recently, Doherty et al. (2005) reported on a spectroscopic sample of EROs nearly twice as large as the previous studies, finding that 75% of their sample have a dominant old stellar population, but only 28% of the sample is completely devoid of evidence of recent star formation. With typically one-third of the observed EROs lacking sufficient signal to enter the spectroscopic samples, the error bars on these population statistics are substantial.
In principle, high resolution morphologies from HST would be useful at distinguishing dusty starbursts from quiescent, old galaxies. This expectation is supported by Fig. 1, which shows that the dusty starburst HR 10 has a disturbed morphology at observed -band, while both LBDS 53W091 and LBDS 53W069 have regular, undisturbed morphologies. From a deep HST WFPC2 archival study of 115 EROs, Yan & Thompson (2003) found that % of EROs are bulge-dominated, % are disk-dominated, and only 6% defy morphological classification. However, from their spectroscopic study, Yan et al. (2004a) found very little correlation between spectroscopic classification and morphological classification, with both emission line galaxies and absorption line galaxies evenly comprised of bulge- and disk-dominated galaxies. Similarly, from a large, magnitude-limited sample of EROs in the GOODS-South field, Moustakas et al. (2004) found that the mean SEDs at m are basically independent of morphology. The implication is that there is no robust way to distinguish ERO subclasses based purely on imaging data shortward of m.
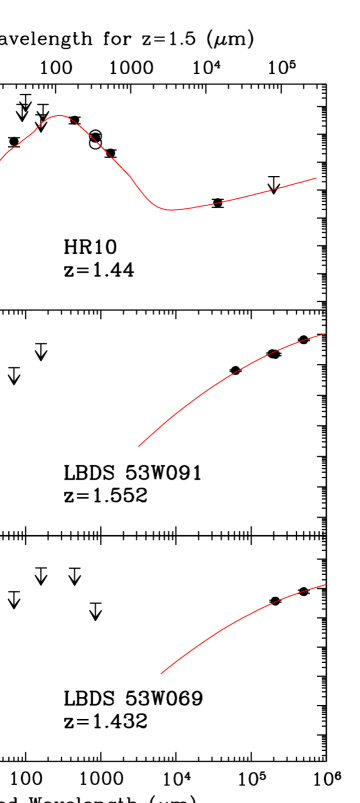
However, Spitzer mid-infrared data enable the ERO subclasses to be separated. Fig. 4 presents the best-fit ERO SEDs (§ 4) redshifted to , the range at which most EROs are thought to reside. Despite previous claims that might be a useful discriminant between the ERO subclasses (e.g. Pozzetti & Mannucci 2000), Fig. 4 clearly demonstrates that ground-based near-infrared data cannot robustly distinguish the subclasses.
In theory, the best-fit SEDs suggest that IRAC data out to m might be useful at separating the populations. While the quiescent, evolved galaxies have SEDs which are falling longward of the m stellar peak, the star-forming SED rises into the mid- and far-infrared due to the cold gas and dust associated with star formation. Though the models differ by mag in [8.0] and [3.6] [8.0] colors, actual observations show more subtle color differences. Not surprisingly, the difference in the m properties of the best-fit SED provide the most robust separation of the star-forming and evolved galaxy EROs.
6 Conclusions
We present Spitzer IRAC and MIPS observations of three well-studied EROs. HR 10 is a dusty starburst class of EROs, while the weak radio sources LBDS 53W091 and LBDS 53W069 are evolved, quiescent EROs. The IRAC data show the m stellar peak in all three sources, providing accurate derivations of basic properties of their stellar populations. Consistent with the bright near-infrared magnitudes, we find all three galaxies are massive, with stellar masses . We also derive ages of a few Gyr for all three galaxies, though HR 10 is found to be dustier and to have proportionally more recent star formation.
Only HR 10 is detected by MIPS, illustrating that m photometry provides a robust discriminant between the two primary classes of EROs. Blueward of m, we find that both ERO classes are similar; identifying the relative fractions of massive galaxies at which are old or dusty and starforming requires either longer wavelength data or deep spectroscopy. From a sample of EROs in a 64 square arcmin area of the Spitzer First Look Survey, Yan et al. (2004b) find that approximately half of the ERO population is detected to a m flux limit of Jy (3), suggesting a roughly even distribution of starbursts and quiescent galaxies in the ERO classification. This breakdown is consistent with the courageous, yet incomplete, spectroscopic studies (e.g. Cimatti et al. 2002a; Yan et al. 2004a; Doherty et al. 2005). Since EROs are the likely progenitors of massive early-type galaxies in the early universe, this suggests both that substantial formation of early-type galaxies occurs at , but that many massive galaxies are also still actively forming stars at .
References
- Andreani, Fosbury, van Bemmel, & Freudling (2002) Andreani, P., Fosbury, R. A. E., van Bemmel, I., & Freudling, W. 2002, A&A, 381, 389
- Archibald, Dunlop, Hughes, Rawlings, Eales, & Ivison (2001) Archibald, E. N., Dunlop, J. S., Hughes, D. H., Rawlings, S., Eales, S. A., & Ivison, R. J. 2001, MNRAS, 323, 417
- Bell et al. (2004) Bell, E. F. et al. 2004, ApJ, 608, 752
- Bertin & Arnouts (1996) Bertin, E. & Arnouts, S. 1996, A&AS, 117, 393
- Blanton et al. (2005) Blanton, M. R. et al. 2005, ApJ, 629, 143
- Bruzual & Charlot (2003) Bruzual, G. & Charlot, S. 2003, MNRAS, 344, 1000
- Bunker, Stern, et al. (2006) Bunker, A. J., Stern, D., et al. 2006, ApJ, in preparation
- Caputi et al. (2006) Caputi, K. I., McLure, R. J., Dunlop, J. S., Cirasuolo, M., & Schael, A. M. 2006, MNRAS, 366, 609.
- Chary & Elbaz (2001) Chary, R. & Elbaz, D. 2001, ApJ, 556, 562
- Cimatti, Andreani, Röttgering, & Tilanus (1998) Cimatti, A., Andreani, P., Röttgering, H., & Tilanus, R. 1998, Nature, 392, 895
- (11) Cimatti, A. et al. 2002a, A&A, 392, 395
- (12) —. 2002b, A&A, 381, 68
- Cimatti et al. (2003) —. 2003, A&A, 412, L1
- Cole et al. (2001) Cole, S. et al. 2001, MNRAS, 326, 255
- Daddi et al. (2003) Daddi, E. et al. 2003, ApJ, 588, 50
- de Vaucouleurs (1948) de Vaucouleurs, G. 1948, Annales d’Astrophysique, 11, 247
- Dey, Graham, Ivison, Smail, Wright, & Liu (1999) Dey, A., Graham, J. R., Ivison, R. J., Smail, I., Wright, G. S., & Liu, M. C. 1999, ApJ, 519, 610
- Dey et al. (2006) Dey, A. et al. 2006, ApJ, in preparation
- Dickinson, Papovich, Ferguson, & Budavári (2003) Dickinson, M., Papovich, C., Ferguson, H. C., & Budavári, T. 2003, ApJ, 587, 25
- Doherty, Bunker, Ellis, & McCarthy (2005) Doherty, M., Bunker, A. J., Ellis, R. S., & McCarthy, P. J. 2005, MNRAS, 361, 525
- Dorman, O’Connell, & Rood (2003) Dorman, B., O’Connell, R. W., & Rood, R. T. 2003, ApJ, 591, 878
- Drory, Bender, Feulner, Hopp, Maraston, Snigula, & Hill (2004) Drory, N., Bender, R., Feulner, G., Hopp, U., Maraston, C., Snigula, J., & Hill, G. J. 2004, ApJ, 608, 742
- Drory, Salvato, Gabasch, Bender, Hopp, Feulner, & Pannella (2005) Drory, N., Salvato, M., Gabasch, A., Bender, R., Hopp, U., Feulner, G., & Pannella, M. 2005, ApJ, 619, L134
- Dunlop & Peacock (1993) Dunlop, J. S. & Peacock, J. A. 1993, MNRAS, 263, 936
- Dunlop, Peacock, Spinrad, Dey, Jimenez, Stern, & Windhorst (1996) Dunlop, J. S., Peacock, J. A., Spinrad, H., Dey, A., Jimenez, R., Stern, D., & Windhorst, R. A. 1996, Nature, 381, 581
- Eales & Rawlings (1993) Eales, S. & Rawlings, S. 1993, ApJ, 411, 67
- Elbaz, Flores, Chanial, Mirabel, Sanders, Duc, Cesarsky, & Aussel (2002) Elbaz, D., Flores, H., Chanial, P., Mirabel, I. F., Sanders, D., Duc, P., Cesarsky, C. J., & Aussel, H. 2002, A&A, 381, L1
- Elston, Rieke, & Rieke (1988) Elston, R., Rieke, G. H., & Rieke, M. J. 1988, ApJ, 331, L77
- Elston, Rieke, & Rieke (1989) Elston, R., Rieke, M. J., & Rieke, G. H. 1989, ApJ, 341, 80
- Faber et al. (2006) Faber, S. M. et al. 2006, ApJ, submitted (astro-ph/0506044)
- Fazio et al. (2004) Fazio, G. G. et al. 2004, ApJS, 154, 10
- Fontana et al. (2004) Fontana, A. et al. 2004, A&A, 424, 23
- Frayer (1996) Frayer, D. T. 1996, Ph.D. thesis (Univ. Virginia)
- Giavalisco et al. (2004) Giavalisco, M. et al. 2004, ApJ, 600, L93
- Graham & Dey (1996) Graham, J. R. & Dey, A. 1996, ApJ, 471, 720
- Greve, Ivison, & Papadopoulos (2003) Greve, T. R., Ivison, R. J., & Papadopoulos, P. P. 2003, ApJ, 599, 839
- Haynes, Cotter, Baker, Eales, Jones, Rawlings, & Saunders (2002) Haynes, T., Cotter, G., Baker, J. C., Eales, S., Jones, M. E., Rawlings, S., & Saunders, R. 2002, MNRAS, 334, 262
- Holland et al. (1999) Holland, W. S. et al. 1999, MNRAS, 303, 659
- Hu & Ridgway (1994) Hu, E. M. & Ridgway, S. E. 1994, AJ, 107, 1303
- Kauffmann et al. (2003) Kauffmann, G. et al. 2003, MNRAS, 341, 33
- Kong et al. (2006) Kong, X. et al. 2006, ApJ, 638, 72
- Kormendy (1977) Kormendy, J. 1977, ApJ, 217, 406
- Krauss (1997) Krauss, L. M. 1997, ApJ, 480, 466
- Labbé et al. (2005) Labbé, I. et al. 2005, ApJ, 624, L81
- Li & Draine (2002) Li, A. & Draine, B. T. 2002, ApJ, 572, 232
- Mannucci et al. (2002) Mannucci, F. et al. 2002, MNRAS, 329, L57
- McCarthy (2004) McCarthy, P. J. 2004, ARA&A, 42, 477
- Mobasher et al. (2005) Mobasher, B. et al. 2005, ApJ, 635, 832
- Moustakas & Somerville (2002) Moustakas, L. A. & Somerville, R. S. 2002, ApJ, 577, 1
- Moustakas et al. (2004) Moustakas, L. A. et al. 2004, ApJ, 600, L131
- Nagamine, Cen, Hernquist, Ostriker, & Springel (2005) Nagamine, K., Cen, R., Hernquist, L., Ostriker, J. P., & Springel, V. 2005, ApJ, 627, 608
- Nolan, Dunlop, Jimenez, & Heavens (2003) Nolan, L. A., Dunlop, J. S., Jimenez, R., & Heavens, A. F. 2003, MNRAS, 341, 464
- Papovich et al. (2006) Papovich, C. et al. 2006, ApJ, 640, 92
- Pozzetti & Mannucci (2000) Pozzetti, L. & Mannucci, F. 2000, MNRAS, 317, 17
- Rieke et al. (2004) Rieke, G. H. et al. 2004, ApJS, 154, 25
- Rocca-Volmerange, Le Borgne, De Breuck, Fioc, & Moy (2004) Rocca-Volmerange, B., Le Borgne, D., De Breuck, C., Fioc, M., & Moy, E. 2004, A&A, 415, 931
- Rudnick et al. (2003) Rudnick, G. et al. 2003, ApJ, 599, 847
- Schneider, Schmidt, & Gunn (1991) Schneider, D. P., Schmidt, M., & Gunn, J. E. 1991, AJ, 101, 2004
- Somerville et al. (2004) Somerville, R. S. et al. 2004, ApJ, 600, L135
- Spinrad, Dey, Stern, Peacock, Dunlop, Jimenez, & Windhorst (1997) Spinrad, H., Dey, A., Stern, D., Peacock, J. A., Dunlop, J., Jimenez, R., & Windhorst, R. A. 1997, ApJ, 484, 581
- Thompson, Storrie-Lombardi, Weymann, Rieke, Schneider, Stobie, & Lytle (1999) Thompson, R. I., Storrie-Lombardi, L. J., Weymann, R. J., Rieke, M. J., Schneider, G., Stobie, E., & Lytle, D. 1999, AJ, 117, 17
- Trauger, Ballester, & Burrows (1994) Trauger, J. T., Ballester, G. E., & Burrows, C. J. 1994, ApJ, 435, L3
- Waddington, Windhorst, Cohen, Dunlop, McLure, Peacock, Bunker, Spinrad, Dey, & Stern (2002) Waddington, I., Windhorst, R. A., Cohen, H. S., Dunlop, J. S., McLure, R. J., Peacock, J. A., Bunker, A. J., Spinrad, H., et al., 2002, MNRAS, 336, 1342
- Waddington, Windhorst, Dunlop, Koo, & Peacock (2000) Waddington, I., Windhorst, R. A., Dunlop, J. S., Koo, D. C., & Peacock, J. A. 2000, MNRAS, 317, 801
- Werner et al. (2004) Werner, M. W. et al. 2004, ApJS, 154, 1
- (66) Windhorst, R. A., Kron, R. G., & Koo, D. C. 1984a, A&AS, 58, 38
- (67) Windhorst, R. A., van Heerde, G. M., & Katgert, P. 1984b, A&AS, 58, 1
- Yan & Thompson (2003) Yan, L. & Thompson, D. 2003, ApJ, 586, 765
- (69) Yan, L., Thompson, D., & Soifer, B. T. 2004a, AJ, 127, 1274
- (70) Yan, L. et al. 2004b, ApJS, 154, 75
- Yi, Brown, Heap, Hubeny, Landsman, Lanz, & Sweigart (2000) Yi, S., Brown, T. M., Heap, S., Hubeny, I., Landsman, W., Lanz, T., & Sweigart, A. 2000, ApJ, 533, 670
- Yun & Carilli (2002) Yun, M. S. & Carilli, C. L. 2002, ApJ, 568, 88
| Observed | Rest | Detector/ | ||
|---|---|---|---|---|
| Wavelength | Wavelength | Flux Density | Instrument | Reference |
| 3620 Å() | 1480 Å | Jy | WHT | 1 |
| 4400 Å() | 1800 Å | Jy | UH 2.2 m | 2,3 |
| 4900 Å() | 2010 Å | Jy | WHT | 1 |
| 5420 Å() | 2220 Å | Jy | WHT | 1 |
| 6450 Å() | 2640 Å | Jy | WHT | 1 |
| 8140 Å(F814W)††Data used in SED modeling (§4). | 3340 Å | Jy | WFPC2/HST | 4 |
| 8200 Å() | 3360 Å | Jy | WHT | 1 |
| 8490 Å() | 3480 Å | Jy | UH 2.2 m | 2,3 |
| 1.2 m ()††Data used in SED modeling (§4). | 4920 Å | Jy | UH 2.2 m | 2,3 |
| 1.6 m ()††Data used in SED modeling (§4). | 6560 Å | Jy | UH 2.2 m | 2,3 |
| 2.2 m ()††Data used in SED modeling (§4). | 9020 Å | Jy | Keck/NIRC | 2 |
| 3.6 m††Data used in SED modeling (§4). | 1.5 m | Jy | IRAC/ | 5 |
| 4.5 m††Data used in SED modeling (§4). | 1.8 m | Jy | IRAC/ | 5 |
| 5.8 m††Data used in SED modeling (§4). | 2.4 m | Jy | IRAC/ | 5 |
| 8.0 m††Data used in SED modeling (§4). | 3.3 m | Jy | IRAC/ | 5 |
| 12 m††Data used in SED modeling (§4). | 4.9 m | Jy | ISOCAM/ISO‡‡Systematic and statistical errors have been added in quadrature. | 6 |
| 15 m††Data used in SED modeling (§4). | 6.1 m | Jy | ISOCAM/ISO‡‡Systematic and statistical errors have been added in quadrature. | 6 |
| 24 m††Data used in SED modeling (§4). | 9.8 m | Jy | MIPS/ | 5 |
| 70 m††Data used in SED modeling (§4). | 28.7 m | mJy | MIPS/ | 5 |
| 90 m | 36.9 m | mJy | ISOPHOT/ISO | 6 |
| 100 m | 41 m | mJy§§Reference does not specify significance of non-detection. | IRAS | 4 |
| 160 m††Data used in SED modeling (§4). | 66 m | mJy | MIPS/ | 5 |
| 170 m | 70 m | mJy | ISOPHOT/ISO | 6 |
| 450 m††Data used in SED modeling (§4). | 184 m | mJy | SCUBA/JCMT | 4 |
| 850 m | 348 m | mJy | SCUBA/JCMT | 7 |
| 850 m | 348 m | mJy | SCUBA/JCMT | 4 |
| 850 m††Data used in SED modeling (§4). | 348 m | mJy | SCUBA/JCMT | 8 |
| 1350 m††Data used in SED modeling (§4). | 553 m | mJy | SCUBA/JCMT | 4 |
| 3.6 cm††Data used in SED modeling (§4). | 1.5 cm | Jy | 9 | |
| 21 cm | 8.2 cm | Jy§§Reference does not specify significance of non-detection. | 4 |
References. — (1) Haynes et al. (2002), (2) Graham & Dey (1996), (3) Hu & Ridgway (1994), (4) Dey et al. (1999), (5) This paper, (6) Elbaz et al. (2002), (7) Cimatti et al. (1998), (8) Greve et al. (2003), (9) Frayer (1996)
| Observed | Rest | Detector/ | ||
|---|---|---|---|---|
| Wavelength | Wavelength | Flux Density | Instrument | Reference |
| 4960 Å() | 1940 Å | Jy | Palomar 200′′ | 1 |
| 6420 Å()††Data used in SED modeling (§4). | 2520 Å | Jy | Keck/LRIS | 2 |
| 6480 Å() | 2540 Å | Jy | Palomar 200′′ | 1 |
| 8140 Å(F814W)††Data used in SED modeling (§4). | 3190 Å | Jy | WFPC2/HST | 3 |
| 8160 Å() | 3200 Å | Jy | Palomar 200′′ | 1 |
| 1.1 m (F110W)††Data used in SED modeling (§4). | 4310 Å | Jy | NICMOS/HST | 3 |
| 1.2 m () | 4700 Å | Jy | UKIRT | 1 |
| 1.6 m ()††Data used in SED modeling (§4). | 6270 Å | Jy | UKIRT | 1 |
| 2.2 m ()††Data used in SED modeling (§4). | 8620 Å | Jy | UKIRT | 1 |
| 3.6 m††Data used in SED modeling (§4). | 1.4 m | Jy | IRAC/ | 4 |
| 4.5 m††Data used in SED modeling (§4). | 1.8 m | Jy | IRAC/ | 4 |
| 5.8 m††Data used in SED modeling (§4). | 2.3 m | Jy | IRAC/ | 4 |
| 8.0 m††Data used in SED modeling (§4). | 3.1 m | Jy | IRAC/ | 4 |
| 24 m††Data used in SED modeling (§4). | 9.4 m | Jy | MIPS/ | 4 |
| 70 m††Data used in SED modeling (§4). | 27 m | mJy | MIPS/ | 4 |
| 160 m††Data used in SED modeling (§4). | 63 m | mJy | MIPS/ | 4 |
| 6.2 cm††Data used in SED modeling (§4). | 2.4 cm | mJy | 2 | |
| 19 cm††Data used in SED modeling (§4). | 7.4 cm | mJy | 2 | |
| 21 cm††Data used in SED modeling (§4). | 8.2 cm | mJy | 1 | |
| 50 cm††Data used in SED modeling (§4). | 20 cm | mJy | 1 |
References. — (1) Waddington et al. (2000), (2) Spinrad et al. (1997), (3) Waddington et al. (2002), (4) This paper
| Observed | Rest | Detector/ | ||
|---|---|---|---|---|
| Wavelength | Wavelength | Flux Density | Instrument | Reference |
| 4960 Å() | 2040 Å | Jy | Palomar 200′′ | 1 |
| 6480 Å() | 2660 Å | Jy | Palomar 200′′ | 1 |
| 8140 Å(F814W)††Data used in SED modeling (§4). | 3350 Å | Jy | WFPC2/HST | 2 |
| 8160 Å() | 3360 Å | Jy | Palomar 200′′ | 1 |
| 1.1 m (F110W)††Data used in SED modeling (§4). | 4520 Å | Jy | NICMOS/HST | 2 |
| 1.2 m () | 4930 Å | Jy | UKIRT | 1 |
| 1.6 m ()††Data used in SED modeling (§4). | 6580 Å | Jy | UKIRT | 1 |
| 2.2 m ()††Data used in SED modeling (§4). | 9050 Å | Jy | UKIRT | 1 |
| 3.6 m††Data used in SED modeling (§4). | 1.5 m | Jy | IRAC/ | 3 |
| 4.5 m††Data used in SED modeling (§4). | 1.9 m | Jy | IRAC/ | 3 |
| 5.8 m††Data used in SED modeling (§4). | 2.4 m | Jy | IRAC/ | 3 |
| 8.0 m††Data used in SED modeling (§4). | 3.3 m | Jy | IRAC/ | 3 |
| 24 m††Data used in SED modeling (§4). | 9.9 m | Jy | MIPS/ | 3 |
| 70 m††Data used in SED modeling (§4). | 29 m | mJy | MIPS/ | 3 |
| 160 m††Data used in SED modeling (§4). | 66 m | mJy | MIPS/ | 3 |
| 450 m | 185 m | mJy | SCUBA/JCMT | 4 |
| 850 m | 360 m | mJy | SCUBA/JCMT | 4 |
| 21 cm††Data used in SED modeling (§4). | 8.6 cm | mJy | 1 | |
| 50 cm††Data used in SED modeling (§4). | 21 cm | mJy | 1 |
References. — (1) Waddington et al. (2000), (2) Waddington et al. (2002), (3) This paper, (4) Archibald et al. (2001)
| HR 10 | LBDS 53W091 | LBDS 53W069 | |
|---|---|---|---|
| [] | 5.6 | 3.0 | 3.2 |
| [mag] | 2.4 | 0.4 | 1.4 |
| age [Gyr] | 3.0 | 3.5 | 4.0 |
| -folding [Gyr] | 2.0 | 0.7 | 2.0 |
| [] |