Radio bubbles in the composite AGN-starburst galaxy NGC 6764
Abstract
We present multi-frequency radio continuum as well as H i observations of the composite galaxy NGC 6764, which has a young, circumnuclear starburst and also harbours an active galactic nucleus (AGN). These observations have been made at a number of frequencies ranging from 600 MHz to 15 GHz using both the Giant Metrewave Radio Telescope (GMRT) and the Very Large Array (VLA). They reveal the structure of the bipolar bubbles of non-thermal, radio emission which are along the minor axis of the galaxy and extend up to 1.1 and 1.5 kpc on the northern and southern sides respectively. Features in the radio bubbles appear to overlap with filaments of H emission. The high-resolution observations reveal a compact source, likely to be associated with the nucleus of the galaxy, and a possible radio jet towards the south-west. We have compiled a representative sample of galaxies with bubbles of non-thermal radio emission and find that these are found in galaxies with an AGN.
The H i observations with the GMRT show two peaks of emission on both ends of the stellar-bar and depletion of H i in the central region of the galaxy. We also detect H i in absorption against the central radio peak at the systemic velocity of the galaxy. The H i-absorption spectrum also suggests a possible weak absorption feature blue-shifted by 120 km s-1, which requires confirmation. A similar feature has also been reported from observations of CO in emission, suggesting that the circumnuclear starburst and nuclear activity affect the kinematics of the atomic and molecular gas components, in addition to the ionised gas seen in H and [Nii].
keywords:
galaxies: individual: NGC6764 – galaxies: active – galaxies: starburst – galaxies: kinematics and dynamics – radio continuum: galaxies – radio lines: galaxies| RA (J2000)b | DEC (J2000)b | Typec | a bd | Vsyse | if | log(LFIR)g | Dh |
| (h m s) | (∘ ′ ′′) | (′ ′) | (km s-1) | (∘) | (L⊙) | (Mpc) | |
| 19 08 16.428 | 50 55 59.47 | SB(s)bc | 2.3 1.3 | 2416 4 | 44.5 | 10.31 | 34.0 |
Taken from the NASA Extragalactic Database (NED), unless stated otherwise. The position of radio peak from our high-resolution, VLA A-array, 8460-MHz image. Morphological type. Optical major and minor axes. Heliocentric systemic velocity. Inclination angle from Hi study by Wilcots, Turnbull & Brinks (2001). Log of the far infra-red luminosity (Condon et al. 1996) revised for a distance of 34.0 Mpc. Distance estimated using the galaxy recessional velocity and H0=71 km s-1 Mpc-1 (Spergel et al. 2003) using the web-based cosmology calculator of Ned Wright. For this distance 1′′=163 pc.
1 Introduction
Galactic-scale outflows or galactic winds play an important role in heating and supplying kinetic energy to the intergalactic medium (IGM) and enriching it with metals (e.g. Heckman, Armus & Miley 1990; Veilleux, Cecil & Bland-Hawthorn 2005 for a review). These outflows can be driven either by a circumnuclear starburst or an active galactic nucleus (AGN), although it is often likely to be due to a combination of both these processes. The conditions for an AGN, such as a deep potential well and a supply of gas, could also lead to a circumnuclear starburst and trigger a starburst-driven galactic wind. Observationally, about half of nearby Seyfert 2 galaxies are found to host a nuclear starburst, with the proportion being larger for infra-red selected objects (e.g. Cid Fernandes et al. 2001; Veilleux 2001 and references therein). Also in some cases, such as in NGC3079, there is strong evidence that starburst-driven winds co-exist with the AGN-driven outflows (Cecil et al. 2001; Irwin & Saikia 2003). Although it is usually not straightforward to disentangle the contributions to the galactic-scale outflows from the AGN and the starburst, the galactic winds from starbursts tend to be oriented along the minor axes of their parent galaxies, while the outflows from AGN show no preferred orientation (e.g Ulvestad & Wilson 1984; Kinney et al. 2000; Gallimore et al. 2006 and references therein).
In this paper, we present radio continuum and Hi observations of the S-shaped spiral galaxy, NGC6764, which hosts an AGN and also exhibits evidence of a recent, intense starburst. It has been classified as a Seyfert 2 galaxy (Rubin, Thonnard & Ford 1975) and also as a low-ionization nuclear emission line region or LINER (Osterbrock & Cohen 1982; Schinnerer, Eckart & Boller 2000; Eckart et al. 1991, 1996). X-ray observations exhibit evidence of variability by a factor of 2 over a time scale of 7 days, consistent with the existence of an AGN (Schinnerer et al. 2000). The basic properties of the galaxy are summarised in Table 1. It is strongly barred and has a compact nuclear region, bright in both optical emission lines (Eckart et al. 1996) and radio continuum (Baum et al. 1993). There is a very prominent 466 nm Wolf-Rayet (W-R) emission feature from the nucleus (Osterbrock & Cohen 1982; Schinnerer et al. 2000), suggestive of recent star formation (Armus, Heckman & Miley 1988; Conti 1991). There is a dense concentration of molecular gas in the central region (Eckart et al. 1991, 1996; Kohno et al. 2001) with T 20K in the circumnuclear region and 10K towards the spiral arms (Eckart et al. 1991). Interferometric observations show molecular cloud complexes with an asymmetric velocity field which is blue-shifted relative to the systemic velocity. The distribution of the 2.12 m H2 line flux is orthogonal to the stellar bar and also indicates possible outflow from the circumnuclear region (Eckart et al. 1996). The radio emission is extended roughly orthogonal to the major axis, forming bubbles of emission on opposite sides. There is also an extended X-ray component similar in extent to that of the radio emission (Schinnerer et al. 2000).
The new radio continuum observations presented here were made with the Very Large Array (VLA) and the Giant Metrewave Radio Telescope (GMRT) at a number of frequencies ranging from 600 MHz to 15 GHz. These observations reveal the structure of the bubbles of non-thermal emission extending up to 7 and 9 arcsec on the northern and southern sides respectively, as well as that of the circumnuclear region, in far greater detail. We present spectral index images of these features, compare NGC6764 with other sources with bubbles of non-thermal plasma and discuss the possible origin of these features. The Hi observations were made with the GMRT to examine the distribution of Hi clouds with higher resolution and also possible kinematic effects of the circumnuclear starburst on the Hi clouds via Hi-absorption spectra. We describe the observations in Section 2, and present the observational results from our radio continuum and Hi observations in Sections 3 and 4 respectively. These are discussed in Section 5 while the conclusions are summarised in Section 6.
2 Observations and Data analysis
The observing log for both the GMRT and VLA observations is presented in Table 2, which is arranged as follows. Column 1: Name of the telescope where we also list the configuration for the VLA observations. In addition to our own data, we have also analysed some of the relevant archival VLA data on this galaxy, which are listed separately in Table 2. Column 2: The frequency of the observations where H i denotes spectral line observations. Columns 3 and 4: Dates of the observations and the time, t, spent on the source in minutes. For the archival data the dates have been taken from the image headers. However, for the observations in 2002, the precise dates seem inconsistent with the array configurations; hence only the year is listed. The project codes for the archival data are indicated below the table. Columns 5 and 6: The phase calibrator used and its flux density estimated from our observations.
| Telescope | Freq. | Obs. | t | Phase | Scal. |
| MHz | date | min | Calib. | Jy | |
| GMRT | 598 | 2004Jan04 | 180 | 2023+544 | 0.80 |
| VLA-A | 1400 | 2003Aug12 | 27 | 2023+544 | 1.11 |
| GMRT | 1408,H i | 2004Jan26 | 240 | 2023+544 | 1.03 |
| VLA-A | 4860 | 2003Aug12 | 50 | 2023+544 | 1.08 |
| VLA-A | 8460 | 2003Aug12 | 60 | 2023+544 | 0.99 |
| VLA-A | 14965 | 2003Aug12 | 10 | 2023+544 | 0.87 |
| Archival | |||||
| VLA-B1 | 4985 | 1985May25 | 45 | 1927+612 | 0.55 |
| VLA-C2 | 8435 | 1999July26 | 16 | 1944+548 | 0.66 |
| VLA-B3 | 8460 | 2002 | 9 | 1944+548 | 0.65 |
| VLA-C3 | 14964 | 2002 | 16 | 1824+568 | 1.68 |
Programme code: 1: VH17; 2: AL490; 3: AC624


The observations with the GMRT, which is described on the website http://www.gmrt.ncra.tifr.res.in, as well as with the VLA were made in the standard fashion, with each source observation interspersed with observations of the phase calibrator. The primary flux density calibrator was 3C286 whose flux density was estimated on the Baars et al. (1977) scale, using the 1999.2 VLA values. The bandwidth of the continuum observations with the GMRT at 598 MHz was 16 MHz, while for the L-band observations it was 8 MHz. The bandwidth for all the VLA observations was 50 MHz. The VLA data from both the IFs were combined to make the final images. The data analysis was done using the Astronomical Image Processing System (AIPS) of the National Radio Astronomy Observatory. Since GMRT data is acquired in the spectral-line mode with 128 spectral channels, gain and bandpass solutions were applied to each channel before combining them.
The analysis of the H i observations was also done in the standard way. 3C286 was the primary flux density and bandpass calibrator. The total bandwidth for H i observations was 8 MHz and the spectral resolution was 62.5 kHz, which corresponds to 13.5 km s-1 in the centre of the band. We discarded a few antennas with more than 3 fluctuations in the bandpass gains during the observations. One channel in the beginning and eight channels towards the end were also not included in the analysis. The AIPS task UVLIN was used for continuum subtraction and the multi-channel data were then CLEANed using IMAGR with the robustness parameter equal to zero. To estimate the overall properties of the galaxy, we made images by tapering the data to different uv distances.

We have made self-calibrated images for all the different data sets. The GMRT images and the archival VLA B- and C-array 8460-MHz images showed significant improvement after self calibration. For these data sets two cycles of phase and one cycle of amplitude self calibration were applied. For the remaining data sets, we have presented the un-selfcalibrated images. Some of the observed parameters of the GMRT and the VLA continuum images are presented in Table 3 which is arranged as follows. Columns 1 and 2 are similar to that of Table 2, except that we also list the NRAO VLA Sky Survey (NVSS). Columns 3 to 5: The resolution of the image with the major and minor axes being listed in arcsec and the position angle (PA) in degrees. Column 6: The rms noise in units of mJy/beam. Columns 7 and 8: The peak and total flux densities in units of mJy/beam and mJy respectively. These have been estimated by specifying a polygon around the source. The total error in the flux density is approximately 5%.
3 Radio continuum emission
3.1 The radio bubbles
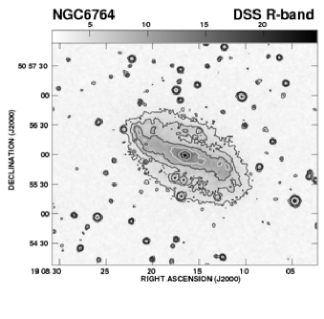
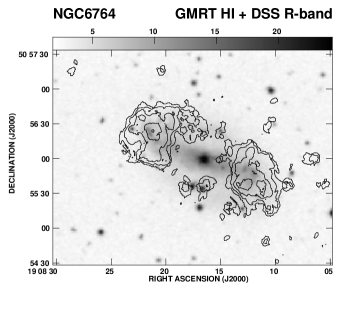
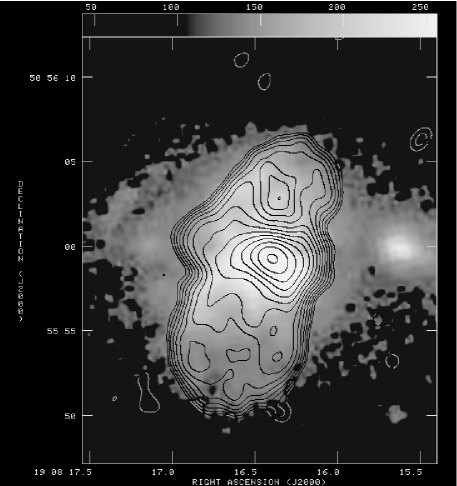
In Fig. 1 we show the optical DSS R-band image of the galaxy (left panel), the NVSS image with an angular resolution of 45 arcsec (middle panel) and the GMRT 598-MHz contour map with an angular resolution of 11 arcsec (right panel). The R-band image shows a strong stellar bar and peaks of emission which are likely to be Hii regions. The H continuum-subtracted image of the galaxy (Zurita, Rozas & Beckman 2000) shows clearly the large number of Hii regions and also the filamentary-like structure extending beyond the circumnuclear region, defined here to be within 0.5 kpc from the radio nucleus. At radio frequencies, the NVSS image appears somewhat extended with a deconvolved angular size of 1514 arcsec2 along a PA of 36∘, but well-within the optical extent of the galaxy. The GMRT 598-MHz image shows the emission to be dominated by the central radio source, with possible weak emission from the bar. The spectral index of the central radio source (Fig. 2) which contains the bubbles of radio emission described below has been estimated from our measurements to be 0.740.02 (S ) between between 598 and 8460 MHz. This shows the source to be clearly dominated by non-thermal emission.


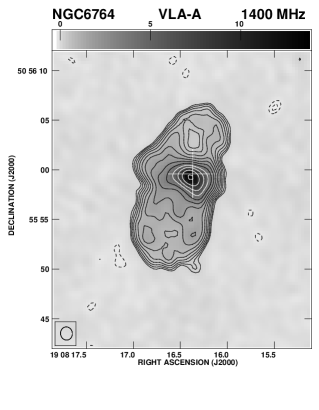
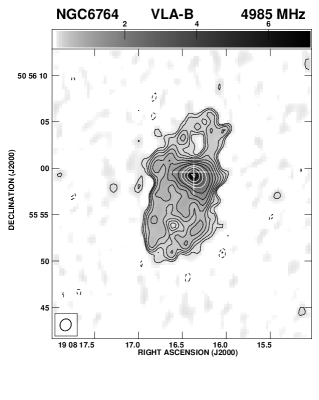
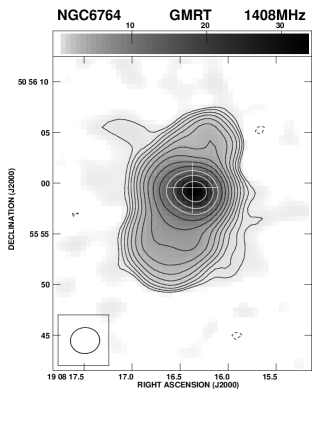
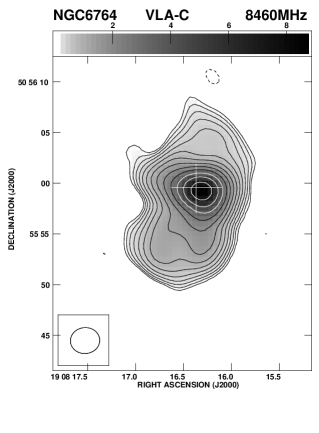
Published radio images of the central region of the galaxy (Wilson & Willis 1980; Ulvestad, Wilson & Sramek 1981; Condon et al. 1982; Baum et al. 1993) have shown a ‘bright resolved peak at the location of the optical nucleus and diffuse emission on both sides of the nucleus’ (cf. Baum et al. 1993). Our images of the extended emission with higher sensitivity using the VLA A-array at 1400 MHz and VLA B-array at 4985 MHz clearly show a bubble-like structure with a drop in brightness towards the centre of each bubble, located on opposite sides of the nucleus (Fig. 3: left and middle panels). These images have been made with angular resolutions of 1.3 and 1.2 arcsec respectively. The extents of the bubbles are 7 and 9 arcsec (1.1 and 1.5 kpc respectively) on the northern and southern sides respectively, while the flux densities at 1400 MHz are 42 mJy and 62 mJy respectively. In addition to the asymmetry in the extents of the bubbles along the minor axis of the galaxy, the radio emission in the circumnuclear region which is roughly orthogonal to this axis is also asymmetric relative to the radio peak or the position of the optical nucleus, which is marked with a sign. The emission on the eastern side extends for 5 arcsec (0.8 kpc) from the radio peak compared with 2.5 arcsec (0.4 kpc) on the western side. At a somewhat lower resolution of 2.7 arcsec, our GMRT image at 1408 MHz and the VLA archival image at 8460 MHz with the same resolution (Fig. 4: left and middle panels) show the bubbles to have similar asymmetric morphologies.
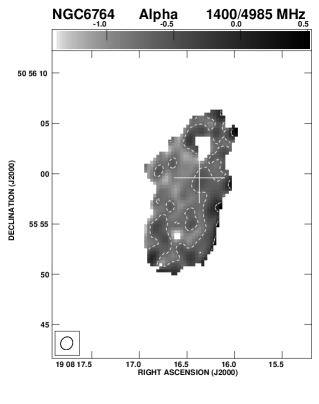
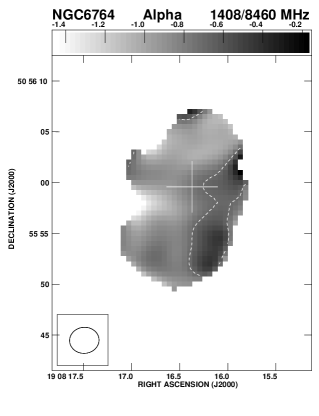
A spectral index image between 1400 and 4985 MHz (Fig. 3: right panel) made by smoothing the 4985-MHz image to the resolution of the 1400-MHz image and using only those pixels which are over 3 times the rms noise, shows that the mean spectral index is 0.72. The western side appears to have a somewhat flatter spectral index, with a mean value of 0.56, compared with 0.77 for the rest of the source. The spectral index image between 1408 and 8460 MHz (Fig. 4: right panel) shows a mean spectral index of 0.85. This spectral index map also shows a similar trend of a flatter spectral index on the western side. The lateral or east-west asymmetry which is seen in the circumnuclear region is also apparent in parts of the bubbles, as seen in the VLA A-array image shown in Fig. 3. If this structural asymmetry, where the western side appears closer to the peak or the axes of the bubbles, and spectral asymmetry are related, it could be due to an asymmetric distribution of thermal gas. This gas could be probed by high-resolution X-ray observations. Although the ROSAT HRI image (Schinnerer et al. 2000) shows extended X-ray emission in addition to the nuclear source, the resolution is inadequate. High-resolution X-ray observations with Chandra are required to study the detailed distribution of this gas.
Adopting the spectral index of 0.74 as the mean value over the region of emission, and assuming the synchrotron emission to have lower and higher cut-offs at 107 and 1010 Hz, respectively, a proton-to-electron energy ratio of unity, a filling factor of unity and an oblate spheroidal distribution for the emitting region (17′′ 9′′ 9′′), we estimate the minimum energy density and equipartition magnetic field to be 6.5 10-12 erg cm-3 and 8.4 G, respectively. The radiative lifetime of an electron radiating in this field at 1.4 GHz is 2.5107 yr. These values are similar to estimates for nearby galaxies (e.g. Condon 1992). The proton-to-electron ratio is not well determined for external galaxies. For a value of 50 from studies of cosmic rays in our own Galaxy (e.g Webber 1991), the equipartition magnetic field would increase by a factor of 2.5.
3.2 The circumnuclear region
The full-resolution VLA-A array images of the circumnuclear region, which is taken to be within 0.5 kpc from the radio nucleus, are presented in Fig. 5. These images at 4860 and 8460 MHz with angular resolutions of 0.35 and 0.19 arcsec respectively reveal the structure to be somewhat complex. In the lower-resolution 4860-MHz image, the emission on the western side of the peak is more prominent and is triangular shaped, extending for about 3 arcsec ( 0.5 kpc) towards the south and 2 arcsec (0.3 kpc) towards the west. The emission on the eastern side is more diffuse, faint and shorter in extent and contributes only 3.7 mJy of the total flux density of 17 mJy visible in the image.
The higher-resolution 8460-MHz image reveals two extensions from the radio peak, one along a PA of 90∘ and extending for 1 arcsec (0.16 kpc) and the other which is more prominent and slightly longer extending for 1.2 arcsec (0.2 kpc) along a PA of 135∘. Given Bridle & Perley’s (1984) definition of a radio jet, the south-western feature could be classified as a possible jet which connects the radio nucleus with more diffuse emission which is oriented along a PA of 180∘ and smoothly joins on to the ridge of emission on the western side of the southern bubble (Figs. 5). However, this feature could also be a resolved structure at the base of the bubble. The extensions to the east and west could also form the base of the bubbles seen in Fig. 3.
3.2.1 The nuclear source
The position of the radio peak determined from the VLA-A array 8460-MHz image is RA: 19h 08m 16.s428, Dec 50∘ 55′ 59.′′47 in J2000 co-ordinates (see Table 1). This is 0.04 arcsec from the peak in the VLA-A array 4860-MHz image (Fig. 5), but is 0.55 arcsec from the position of the optical nucleus (RA 19 08 16.370; Dec: +50 55 59.58 in J2000 co-ordinates with an uncertainty of 0.22 arcsec) determined by Clements (1981). This difference between the radio and optical peaks may be due to higher extinction close to the nucleus of this galaxy. Similar differences have been seen in other galaxies as well, such as in NGC1482 (Hota & Saikia 2005). Although the radio peak is likely to be associated with the AGN, it is undetected in our VLA-A array 14940-MHz image, the 3 upper limit being 0.7 mJy. This is only marginally lower than the flux density of 0.8 mJy/beam at 8460 MHz, suggesting that the spectrum could still be flat. A more sensitive VLA-A array 14940-MHz image is required to detect the possible nuclear source at higher frequencies and determine its spectrum.
| Telescope | Freq. | Beam size | rms | Spk | Stot. | ||
|---|---|---|---|---|---|---|---|
| MHz | maj. | min. | PA | mJy | mJy | mJy | |
| ′′ | ′′ | ∘ | /b | /b | |||
| GMRT | 598 | 12.4 | 9.4 | 33 | 0.39 | 136 | 183 |
| NVSS | 1400 | 45.0 | 45.0 | 0 | 0.50 | 102 | 113 |
| VLA-A | 1400 | 1.33 | 1.19 | 7 | 0.05 | 14 | 103 |
| GMRT | 1408 | 2.89 | 2.56 | 85 | 0.14 | 33 | 109 |
| VLA-A | 4860 | 0.37 | 0.33 | 17 | 0.023 | 1.6 | 17 |
| VLA-A | 8460 | 0.21 | 0.18 | 16 | 0.016 | 0.8 | 5.9 |
| VLA-A | 14965 | 0.13 | 0.11 | 43 | 0.221 | 0.7 | 0.7 |
| VLA-B | 4985 | 1.31 | 1.18 | 28 | 0.054 | 7.1 | 43 |
| VLA-C | 8460 | 2.89 | 2.56 | 85 | 0.039 | 8.7 | 25 |
| VLA-B | 8460 | 1.53 | 1.29 | 68 | 0.069 | 5.2 | 20 |
| VLA-C | 14939 | 2.32 | 1.06 | 82 | 0.166 | 4.1 | 14 |

 .
.
4 Hi observations
Hi observations of NGC6764 have been reported earlier with an angular resolution of 54 arcsec (8.8 kpc) using the VLA-D array (Wilcots, Turnbull & Brinks 2001). We observed this source with the GMRT with higher resolution to (i) identify any kinematic effects of the AGN and starburst activity on the circumnuclear Hi gas via Hi 21-cm absorption lines towards the central continuum source, (ii) study the distribution of Hi gas relative to the Hii regions, and (iii) further investigate the nature of the observed depression in Hi column density towards the centre of the galaxy. Wilcots et al. noted this depression but with the relatively coarse resolution of their observations were unable to test the proposition that this might be due to absorption against the central continuum source. The results of our observations, which have an rms noise of 0.6 mJy beam-1 per channel in the full-resolution images, are described below.
4.1 Hi emission
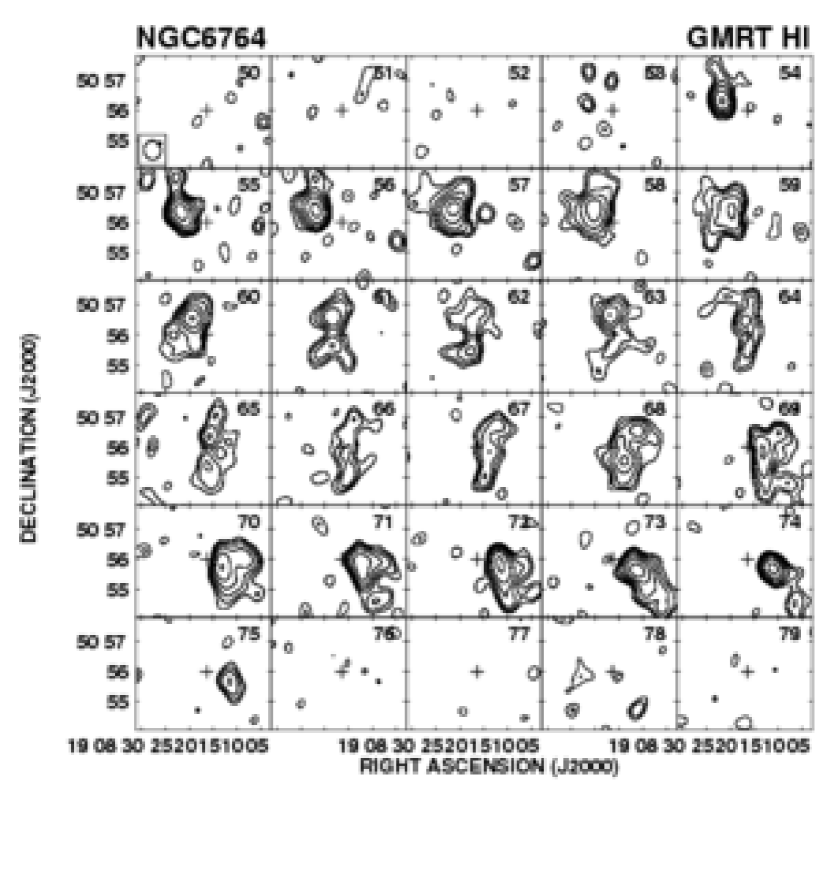
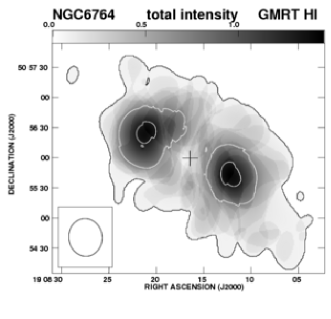
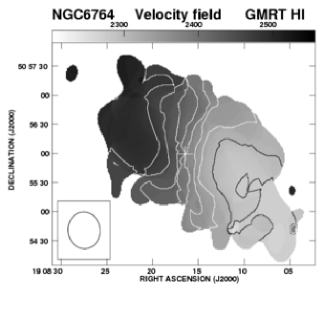
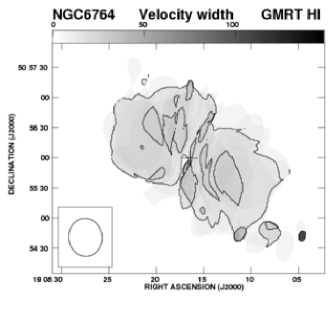
In Fig. 6, we show the global profile obtained by tapering the data to 4 k and making channel maps which have an rms noise of 1 mJy/beam and an angular resolution of 35 arcsec (Fig. 7). In the channel maps, we confirm the extensions to the north (channel=55; 2515 km s-1) and south (channel=74; 2258 km s-1) noted by Wilcots et al., which are clearly seen in our data. The total Hi mass calculated from the global profile over the velocity range 2225 to 2562 km s-1 is 3.6 109 M⊙. The total Hi mass detected by Wilcots et al. (2001) is (5.91)109 M⊙ (revised for a distance of 34 Mpc), which implies that in our higher-resolution images we have resolved out some of the diffuse extended Hi-gas of the galaxy. Moment maps were generated by blanking each channel of this data cube at the 5 level. The Hi column density image and the velocity field are shown in Fig. 8. The velocity field is similar to that published by Wilcots et al. (2001). The iso-velocity contours show evidence of non-circular motions due to the existence of a bar in NGC6764. We also see the velocity field being slightly distorted on the north-eastern and the south-western edges of the disk, as seen by Wilcots et al. (2001). The Moment-2 map shows the velocity width of the gas being slightly higher in the inner region than that in the outer region (Fig. 8).
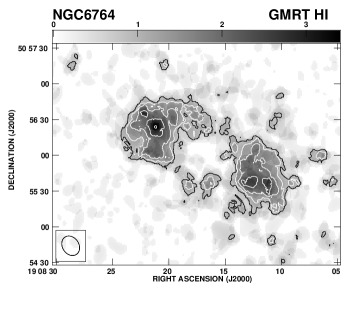
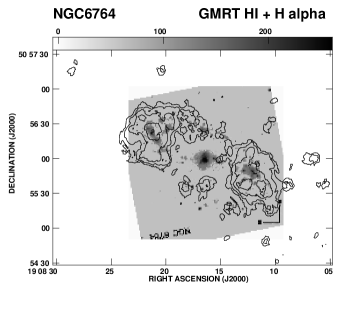
To study the Hi properties with higher resolution, we generated moment maps by tapering the data to 10 k and blanking each channel of this data cube at the 5 level. The total Hi column density image with an angular resolution of 15 arcsec shows the structure of the two well-resolved blobs of emission which are located on opposite sides of the circumnuclear region (Fig. 9: left panel). A superposition of the Hi column density image on the DSS R-band image of the optical galaxy (Fig. 9: middle panel) shows that the Hi line-emitting gas is located in the outer regions of the galaxy, and there appears to be no significant Hi emission towards the centre of the galaxy which harbours the young starburst and the AGN. This is unlikely to be due to absorption against the central continuum source, which extends for only 15 arcsec, similar to the resolution of these images, and contributes almost the entire continuum flux density seen in the NVSS image. The depression in the Hi column density in the central region extends over 50 arcsec.
A comparison of the Hi column-density image with the H image of the galaxy (Zurita et al. 2000) shows that the most prominent region in H is the central starburst source which has no significant Hi gas. Although close to the circumnuclear region this could be due to ionisation by the central starburst and AGN, the depletion of Hi at larger distances could be due to an ISM phase transition from atomic to molecular hydrogen. As mentioned earlier, there is a concentration of molecular gas extending over 2.3 kpc along the bar of the galaxy (Eckart et al. 1991, 1996; Kohno et al. 2001; Leon et al. 2003).
The next most prominent regions of H emission are at the ends of the bar, with weaker emission along the bar and spiral arms. The peaks of Hi emission in the south-western blob appear displaced from the H peaks while in the northern lobe they appear to be roughly coincident at this resolution (Fig. 9; right panel).
4.2 Hi absorption
In Fig. 10, we present the Hi absorption profile towards the peak of the central continuum source (Fig. 4; left panel) with an angular resolution of 2.7 arcsec and an rms noise of 0.6 mJy beam-1. No absorption is observed towards any other part of the radio source. The peak absorption occurs at a heliocentric velocity of 2426 km s-1, which is consistent with the heliocentric systemic velocity 2416 km s-1. In addition there is a weak blue-shifted component at a heliocentric velocity of 2300 km s-1, which corresponds to a blue shift of 120 km s-1 relative to the systemic velocity. Although this feature is very weak (2) and requires confirmation from more sensitive observations, it is likely to be real since it is seen in both the Stokes RR and LL data sets and it extends over a few channels. It is interesting to note that mm-wavelength observations of CO have shown molecular gas in emission towards the circumnuclear region which is blue shifted by 140 km s-1 relative to the systemic velocity (Leon et al. 2003).
The peak optical depth, calculated using the background peak continuum flux density of 33 mJy from the area of 9 arcsec2 against the peak is 0.06. The total optical depth, calculated with data points over the full width at zero intensity (21842548 km s-1) is 0.5. Assuming a spin temperature of 100 K this corresponds to a total NHi 1.23 1021 cm-2. The total mass of the absorbing Hi clouds is 2.35 106M⊙. The blue-shifted component spread over 21842346 km s-1 has an optical depth of 0.13 which corresponds to an NHi 3.1 1020 cm-2. Although the blue shift could be due to non-circular motions due to the barred potential, such shifts may also be caused by gas clouds driven outwards by the circumnuclear starburst or AGN. In the latter scenario, the outflowing (120 km s-1) Hi cloud, which has an estimated mass of 5.9105M⊙, assuming the cloud to have an area of 9 arcsec2, has a kinetic energy of 8.51052ergs.
5 Discussion
| Galaxy | Morph. | AGN | Dist. | Size | Size | Sb+n(1.4) | L1.4 (1020) | log(L) | Refs. |
|---|---|---|---|---|---|---|---|---|---|
| name | class | type | Mpc | ′′ | kpc | mJy | W/Hz | ||
| (1) | (2) | (3) | (4) | (5) | (6) | (7) | (8) | (9) | (10) |
| NGC1068 | SAb | Sy1,Sy2 | 16.0 | 14 | 1.0 | 4221 | 1296 | 10.98 | 1,2 |
| NGC2782 | SABa | Sy1,SB | 36.0 | 14 | 2.4 | 107 | 166 | 10.44 | 3,4 |
| NGC2992 | SA,pec | Sy1,Sy2 | 32.5 | 8 | 1.2 | 168 | 213 | 10.26 | 5,6 |
| NGC3079 | SBc | Sy2,L | 15.7 | 45 | 3.4 | 409 | 121 | 10.53 | 7,8 |
| NGC3367 | SBc | Sy,L | 42.7 | 75 | 15.3 | 51 | 112 | 10.49 | 9,10 |
| NGC4051 | SABbc | Sy1.5 | 9.9 | 10 | 0.4 | 20 | 2.3 | 9.47 | 11,12 |
| M51 | SAbc,pec | Hii,Sy2.5,L | 8.4 | 15 | 0.6 | 45 | 3.8 | 10.38 | 13,14 |
| NGC5548 | SA0/a | Sy1.5 | 72.3 | 10 | 3.4 | 23 | 147 | 9.98 | 12,15 |
| NGC6764 | SBbc | Sy2,L | 34.0 | 16 | 2.6 | 106 | 147 | 10.31 | 16,17 |
| Circinus | SAb | Sy2 | 6.1 | 270 | 8.1 | - | - | 10.45 | 18,19 |
1 Cecil, Bland & Tully 1990; 2 Pogge 1988; 3 Jogee, Kenney & Smith 1998; 4 Yoshida, Taniguchi & Murayama 1999; 5 Chapman et al. 2000; 6 Veilleux, Shopbell & Miller 2001; 7 Cecil et al. 2001; 8 Irwin & Saikia 2003; 9 García-Barreto, Franco & Rudnick 2002; 10 García-Barreto et al. 2005; 11 Christopoulou et al. 1997; 12 Baum et al. 1993; 13 Cecil 1988; 14 Ford et al. 1985; 15 Wilson et al. 1989; 16 This paper; 17 Zurita, Rozas & Beckman 2000; 18 Elmouttie et al. 1998a; 19 Elmouttie et al. 1998b.

5.1 Radio bubbles
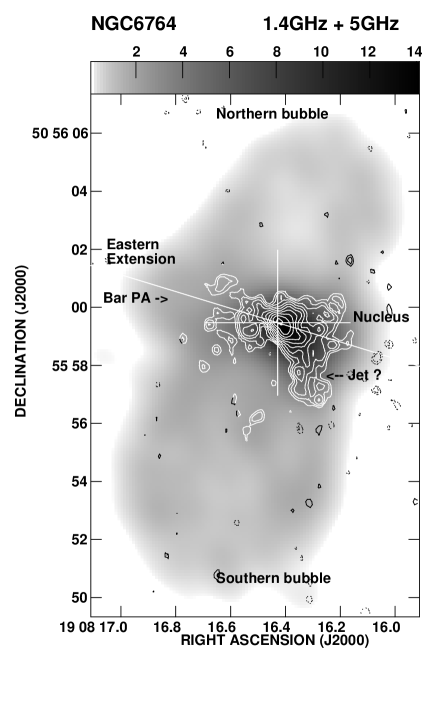
At radio continuum wavelengths, the most striking features are the bubbles of non-thermal plasma with a size of 1.1 and 1.5 kpc on the northern and southern sides respectively of the circumnuclear region, and oriented roughly orthogonal to the stellar bar and the major axis of the galaxy (Fig. 11). There also appears to be an extension on the eastern side extending beyond the base of the bubbles. In addition, smaller-scale structure with a size of 0.5 kpc but asymmetric in extent relative to the radio nucleus is seen oriented roughly along the stellar bar. There is also a jet-like structure starting from the nucleus along an initial PA of 135∘ which appears to connect the nucleus to more extended emission towards the south-west. These features are shown in Fig. 11 where the smaller-scale structure is shown superimposed on the larger-scale bubbles.
We first discuss the origin of these structures in this composite galaxy which harbours both a young starburst and an AGN. It is worth noting here that the activity in this galaxy does not appear to be triggered by interaction with any companion galaxy, since there is no evidence of any nearby galaxy within a distance of 160 kpc (Wilcots et al. 2001). However, the Hi observations do show evidence of a weak perturbation but this is unlikely to significantly affect the starburst and AGN activity seen in this galaxy.
In order to understand the nature of these bubbles, we have compiled a representative sample of nearby galaxies with similar structures from the literature. A bubble is defined to be one whose width is larger than approximately half the size of its length. This working definition has been adopted to distinguish it from jets or jet-like features and normal lobes of radio emission formed by these jets whose axial ratios are usually higher than 2 (e.g. Leahy, Muxlow & Stephens 1989). The sample of nearby galaxies with bubbles is listed in Table 4, along with some of their properties. The table is arranged as follows. Column 1: name of the galaxy; column 2: galaxy classification from NED; column 3: classification of the AGN from NED where Sy denotes a Seyfert galaxy, L a LINER galaxy, SB a starburst and Hii a galaxy with prominent Hii regions; column 4: distance to the galaxy in Mpc; columns 5 and 6: total extent of the bubbles in arcsec and kpc respectively. Columns 7 and 8: flux density and radio luminosity at 1.4 GHz of the bubbles and any core or jet emission. These have been estimated from the FIRST images, except for NGC2992 for which we have used the NED image (Ulvestad & Wilson 1989) and NGC6764 for which we have used the results presented in this paper. The flux density of the bubbles and any core or jet emission has been estimated by specifying a polygon around this region. The flux density value for the bubbles in Circinus is not available. Column 9: The FIR luminosity of the galaxies. Except for Circinus, for which we have estimated the value from Elmouttie et al. (1998b), these have been taken from Condon et al. (1990, 1998) and scaled to the distances listed in column 4. Column 10: References for the radio, X-ray and/or H images.
It can be seen that the total extents of the bubbles range from 0.4 to 15 kpc, with a median value of 2.5 kpc, similar to that of NGC6764. While some bubbles lie within the scale-height of the interstellar medium (ISM) of the parent galaxy, others extend beyond it. In these radio bubbles, the ionised gas seen in optical emission lines such as H or [Oii] tend to be spatially related to the radio emission. The radio luminosity of the bubbles and any core or jet emission ranges from 2.31020 to 1.31023 W Hz-1 with a median value of 1.41022 W Hz-1, while the infrared luminosity of the galaxies ranges from 9.47 to 10.98 in units of log(LFIR/L⊙) with a median value of 10.3. Although the galaxies are luminous at infrared wavelengths, their luminosity is well below the threshold for defining these as ultra-luminous infrared galaxies.
In Table 4, it is striking that all the sources with non-thermal bubbles of radio emission have an AGN associated with it. It is worth comparing this with archetypal starburst galaxies such as M82 and NGC253, whose infrared luminosities of 10.38 and 10.26 in units of log(LFIR/L⊙) respectively, are comparable with the sources in the sample of galaxies with bubbles. These two galaxies are dominated by the circumnuclear starburst with no clear evidence of an AGN, although there have been attempts to identify one (Wills et al. 1999; Mohan et al. 2002). High-resolution radio images of the nuclear regions of these two galaxies reveal a large number of compact radio components (Muxlow et al. 1994; McDonald et al. 2002 and references therein; Collison et al. 1994; Ulvestad & Antonucci 1997 and references therein) which are a mixture of Hii regions and supernova remnants, while lower-resolution observations reveal a more extended halo of emission (Seaquist & Odegard 1991; Reuter et al. 1992; Carilli et al. 1992). Although outflows along the minor axes are visible in both these two galaxies in X-rays and H (Strickland et al. 2004), there are no bubbles of non-thermal plasma similar to those seen in our sample of galaxies. The archetypal starburst galaxy in the southern hemisphere, NGC1808, which is also dominated by a starburst with no unambiguous identification of an AGN (Forbes et al. 1992; Jiménez-Bailón et al. 2005), has extended non-thermal emission with no clear bubbles of radio emission (e.g. Dahlem et al. 1990). The small-scale radio structure is dominated by a number of compact components (Saikia et al. 1990; Collison et al. 1994). Also, in a recent study of the superwind galaxy NGC1482, which has a remarkable hourglass-shaped optical emission-line outflow as well as bipolar soft X-ray bubbles of emission (Veilleux & Rupke 2002; Strickland et al. 2004), there is no non-thermal radio emission or bubbles associated with the superwind although radio emission is seen associated with the disk of the galaxy (Hota & Saikia 2005). Its infrared luminosity of log LFIR=10.66 is similar to the sources with bubbles listed in Table 4. Although the high-resolution radio observations of the nuclear region of NGC1482 show a peak of emission with a steep radio spectrum, and more diffuse emission with secondary peaks, it is not clear if this feature could be associated with an AGN (Hota & Saikia 2005). It is relevant to note here that, from optical spectroscopic observations, Kewley et al. (2000) have classified it to be a starburst galaxy without an AGN. Considering these aspects, it is tempting to speculate that the formation of bubbles is closely linked to the existence of an AGN. It is interesting to note that Colbert et al. (1996) have highlighted similar differences in the radio structures between Seyfert and starburst galaxies.
Thus although the AGN possibly gives rise to the bubbles of non-thermal radio emission, these would interact with the external environment in the host galaxy. A galactic wind generated by a starburst (cf. Veilleux et al. 2005) along with effects of buoyancy (Gull & Northover 1973; Stone, Wilson & Ward 1988) could lead to the bubbles of plasma being oriented along the minor axis of the galaxy. In this case, the radio jet close to the nucleus could be misaligned with the minor axis, as seen in NGC6764 as well as in the well-studied galaxy NGC3079 (cf. Irwin & Seaquist 1988; Kondratko et al. 2005). Using the formalism of Stone et al. (1988), we estimate the time scale for the bubbles to reach the observed distances due to buoyancy to be 35 Myr. This is likely to be an upper limit because of the presence of an AGN as well as galactic wind. The extended X-ray emission from a region similar to that of the radio bubbles (Schinnerer et al. 2000) and the velocity structure in the H gas (Rubin et al. 1975) suggests the presence of a galactic wind in this starburst galaxy. Estimating an outflow velocity of 80 km s-1 for the ionised gas observed by Rubin et al., the dynamical time scale for the H gas to reach distances of 1.5 kpc is 20 Myr. For comparison, the circumnuclear star formation history suggests two starbursts with ages of 35 Myr and between 15 and less than 50 Myr (Schinnerer et al. 2000), suggesting that both episodes of star formation could have affected the detailed structure of the bubbles.
5.2 Kinematic effects on the ISM

Interaction of radio jets and bubbles, as well as the galactic wind with the ambient medium could affect the kinematic properties of the ISM. However, in the case of NGC6764 the radio features are likely to play a relatively smaller role. The total minimum energy in the radio features is only 4.81054 ergs, which corresponds to a pressure of 2.210-12 dynes cm-2, similar to values for the ISM in the Milky Way. The total energy in the radio features of NGC6764 are significantly smaller than typical values for the total energy in the outflows. Although the total energy in the various components in the outflow in NGC6764 is not known, the kinetic energy in the outflow of only the warm ionised and the neutral gas components in typical galaxies with galactic winds are 1053 to 1056 and 1056 to 1060 ergs respectively (Veilleux et al. 2005).
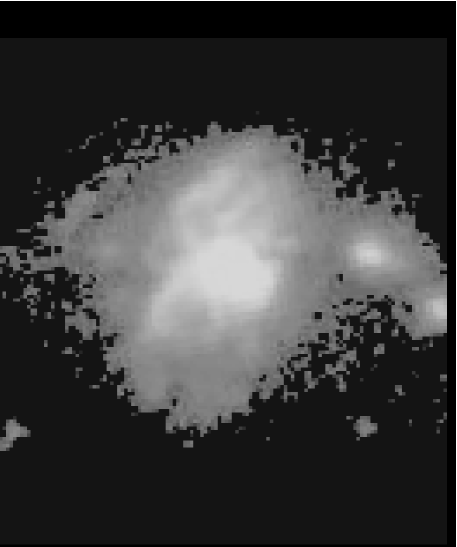
A continuum-subtracted H image of the central region of the galaxy (Zurita et al. 2000) shows a number of filamentary structures, reminescent of those seen in galaxies with galactic winds. We have determined the positional information of this H image by comparing the pixel positions of three stars which are visible in the H image with their positions determined from the DSS image. A superposition of the radio continuum image at 1400 MHz with an angular resolution of 1.2 arcsec (0.2 kpc) on the H image (Fig. 12) shows some correlation of the radio emission with the H features, which are possibly driven outwards by a galactic wind.
Spectroscopic observations of NGC6764 by Rubin, Thonnard & Ford (1975) showed that along the axis of the bubbles, the ionised gas appears red-shifted on the northern side and blue-shifted on the southern side by up to 80 km s-1 relative to the systemic velocity of the galaxy (Fig. 13). These motions are likely to be caused by a bi-polar outflow due to the circumnuclear starburst.
In addition to the ionised gas component, the outflow due to the circumnuclear starburst could also affect the molecular and atomic gas components in the galaxy. For example, interaction of the bubbles with the molecular gas can give rise to CO gas compression and also affect their kinematic properties. Such effects have been seen in detailed studies of individual starburst galaxies. For example, in the starburst galaxy NGC253, Sakamoto et al. (2006) find that the circumnuclear molecular disk harbouring the starburst is highly disturbed on small scales by individual young clusters and supernovae and globally by the well-known superwind. In the map of NGC6764 published by Eckart et al. (1991), the line ratio CO(2-1)/CO(1-0) shows higher values of 0.9 along the orientation of the bubbles but smaller values of 0.5 near the arms. Such higher values of the line ratio are expected when CO gas is compressed. Leon et al. (2003) find evidence of CO gas which is blue shifted by 140 km s-1 and have a very high line ratio of 2 for CO(2-1)/CO(1-0). As discussed earlier (Section 4.2) our Hi absorption spectrum shows a possible feature at a blue-shifted velocity of 120 km s-1, which is similar to that of the molecular gas observed in CO. A similar blue-shifted feature was also noted in the superwind galaxy NGC1482 by Hota & Saikia (2005), which was also interpreted to be due to the circumnuclear starburst.
Hydrodynamical simulations of starburst-driven winds show that the cool gas could expand laterally in the disc of the galaxy, be carried vertically outwards by the tenuous superwind or be entrained in the interface between the hot, superwind fluid and the cool, dense ISM (e.g. Heckman et al. 1990; Heckman et al. 2000). The kinematic and physical properties of the different components discussed above are broadly consistent with the results of these simulations of winds.
6 Summary and concluding remarks
We have presented radio continuum and Hi observations of NGC6764, which has a young starburst as well as a Seyfert nucleus. The results are briefly summarised here.
-
1.
The low-resolution GMRT image at 598 MHz with an angular resolution of 11 arcsec (1.8 kpc) shows that almost all the radio emission from the galaxy comes from the central region of the source, with very little emission from the disk of the galaxy. The VLA A-array image at 1400 MHz with an angular resolution of 1.3 arcsec accounts for more than 90 per cent of the flux density visible in the NVSS image. This central source has a non-thermal spectrum with a spectral index of 0.740.02 between 600 MHz and 8 GHz.
-
2.
With an intermediate resolution of 1.3 arcsec (0.2 kpc), the central source is resolved into two bubbles of non-thermal radio emission which are shell-like with a depression in the centre. The ridges of emission appear to overlap with H filaments seen in a continuum-subtracted H image of the galaxy. The bubbles are oriented along the minor axis of the galaxy with a total extent of 2.6 kpc. The western edge of the bubbles tends to have a flatter spectral index than the rest of the bubbles.
-
3.
The image at 4860 MHz with a resolution of 0.35 arcsec (0.05 kpc) shows emission along the major axis of the galaxy as well as extensions which appear to connect to the ridges of emission in the bubbles.
-
4.
Our highest-resolution image (0.19 arcsec; 0.03 kpc) reveals a compact source, which is possibly associated with the nucleus of the galaxy, and is slightly offset (0.55 arcsec) from the position of the optical nucleus determined by Clements (1981). In addition there is a possible radio jet along a PA of 135∘ which appears to connect to more extended emission towards the south.
-
5.
A compilation of a representative sample of ten galaxies with non-thermal bubbles shows that these are all associated with an AGN. However, the detailed radio and optical structures, as well as the distribution of atomic and molecular gas, could be affected by a galactic wind due to a starburst in addition to any AGN activity. Prominent starburst galaxies such as M82, NGC253, NGC1482 and NGC1808 have similar infrared luminosity, but do not exhibit such bubbles of radio emission, suggesting that these are not usually caused by the circumnuclear starburst.
-
6.
The H i observations, which are of higher resolution than those reported earlier by Wilcots et al. (2001), show that the two main peaks of emission are roughly coincident with the ends of the bar. There is a depletion of Hi towards the central region. Although this is likely to be due to the circumnuclear starburst and AGN close to the nucleus, at larger distances it could be due to phase transition in the ISM from atomic to molecular hydrogen.
-
7.
The peak absorption feature in the Hi-absorption profile has an optical depth of 0.06 and a heliocentric velocity of 2426 km s-1, consistent with the systemic velocity of the galaxy. The H i mass estimated from the absorption profile is 2.4106 M⊙. There is a suggestion of a weak absorption feature at a blue-shifted velocity of 120 km s-1, which requires confirmation from more sensitive observations. A feature with a similar blue-shifted velocity has also been reported from observations of CO in emission, suggesting that the circumnuclear starburst and nuclear activity may have affected the kinematics of the atomic and molecular gas components of the ISM in the host galaxy, in addition to the ionised gas seen in H and [Nii].
Acknowledgments
We thank an anonymous referee for his detailed report which has helped improve the
paper significantly, and Neeraj Gupta, Nirupam Roy
and Dave Strickland for their comments
on the manuscript. AH thanks the Kanwal Rekhi Career Development Scholarship
for partial financial support.
The GMRT is a national facility operated by the National Centre for Radio
Astrophysics of the Tata Institute of Fundamental Research. VLA is a operated
by Associated Universities, Inc. under contract with the National Science
Foundation. This research has made use of the NASA/IPAC extragalactic database
(NED) which is operated by the Jet Propulsion Laboratory, Caltech, under
contract with the National Aeronautics and Space Administration.
References
- [] Armus L., Heckman T.M., Miley G.K., 1988, ApJ, 326L, 45
- [] Baars J.W.M., Genzel R., Pauliny-Toth I.I.K, Witzel A., 1977, A&A, 61, 99
- [] Baum S.A., O‘Dea C.P., Dallacassa D., de Bruyn A.G., Pedlar A., 1993. ApJ, 419, 553
- [] Bridle A. H., Perley R. A., 1984, ARA&A, 22, 319
- [] Carilli C.L., Holdaway M.A., Ho P.T.P., de Pree C.G., 1992, ApJ, 399L, 59
- [] Cecil G., 1988, ApJ, 329, 38
- [] Cecil G., Bland J., Tully R.B., 1990, ApJ, 355, 70
- [] Cecil G., Bland-Hawthorn J., Veilleux S., Filippenko A.V., 2001, ApJ, 555, 338
- [] Chapman S.C., Morris S. L., Alonso-Herrero A., Falcke H., 2000, MNRAS, 314, 263
- [] Christopoulou P. E., Holloway A. J., Steffen W., Mundell C. G., Thean A. H. C., Goudis C. D., Meaburn J., Pedlar A., 1997, MNRAS, 284, 385
- [] Cid Fernandes R., Heckman T., Schmitt H., Delgado R. M. G., Storchi-Bergmann T., 2001, ApJ, 558, 81
- [] Clements E.D., 1981, MNRAS, 197, 829
- [] Colbert E.J.M., Baum, S.A., Gallimore J.F., O’Dea C.P., Christensen J.A., 1996, ApJ, 467, 551
- [] Collison P.M., Saikia D.J., Pedlar A., Axon D.J., Unger S.W., 1994, MNRAS, 268, 203
- [] Condon J.J., 1992, ARA&A, 30, 575
- [] Condon J.J., Condon M. A., Gisler G., Puschell J. J., 1982, ApJ, 252, 102
- [] Condon J.J., Helou G., Sanders D.B., Soifer B.T., 1990, ApJS, 73, 359
- [] Condon J.J., Helou G., Sanders D. B., Soifer B. T., 1996, ApJS, 103, 81
- [] Condon J.J., Yin Q.F., Thuan T.X., Boller Th., 1998, AJ, 116, 2682
- [] Conti P.S., 1991, ApJ, 377, 115
- [] Dahlem M., Aalto S., Klein U., Booth R., Mebold U., Wielebinski R., Lesch H., 1990, A&A, 240, 237
- [] Eckart A., Cameron M., Jackson J. M., Genzel R., Harris A. I., Wild W., Zinnecker H., 1991, ApJ, 372, 67
- [] Eckart A., Cameron M., Boller Th., Krabbe A., Blietz M., Nakai N., Wagner S. J., Sternberg A., 1996, ApJ, 472, 588
- [] Elmouttie M., Koribalski B., Gordon S., Taylor K., Houghton S., Lavezzi T., Haynes R., Jones K., 1998a, MNRAS, 297, 49
- [] Elmouttie M., Haynes R. F., Jones K. L., Sadler E. M., Ehle M., 1998b, MNRAS, 297, 1202
- [] Forbes D.A., Boisson C., Ward M.J., 1992, MNRAS, 259, 293
- [] Ford H. C., Crane P. C., Jacoby G. H., Lawrie D. G., van der Hulst J. M., 1985, ApJ, 293, 132
- [] Gallimore J.F., Axon D.J., O’Dea C.P., Baum S.A., Pedlar A., 2006, AJ, in press (astro-ph/0604219)
- [] García-Barreto J.A., Franco J., Rudnick L., 2002, AJ, 123, 1913
- [] García-Barreto J. A., Scoville N. Z., Koda J., Sheth K., 2005, AJ, 129, 125
- [] Gull S.F., Northover K.J.E., 1973, Nature, 244, 80
- [] Heckman T.M., Armus L., Miley G.K., 1990, ApJS, 74, 833
- [] Heckman T.M., Lehnert M.D., Strickland D.K., Armus L., 2000, ApJS, 129, 493
- [] Hota A., Saikia D.J., 2005, MNRAS, 356, 998
- [] Irwin J.A., Saikia D.J., 2003, MNRAS, 346, 977
- [] Irwin J.A., Seaquist E.R., 1988, ApJ, 335, 658
- [] Jiménez-Bailón E., Santos-Lleó M., Dahlem M., Ehle M., Mas-Hesse J.M., Guainazzi M., Heckman T.M., Weaver K.A., 2005, A&A, 442, 861
- [] Jogee S., Kenney J. D. P., Smith B.J., 1998, ApJ, 494, L185
- [] Kewley L.J., Heisler C.A., Dopita M.A., Sutherland R., Norris R.P., Reynolds J., Lumsden S., 2000, ApJ, 530, 704
- [] Kinney A. L., Schmitt H. R., Clarke C. J., Pringle J. E., Ulvestad J. S., Antonucci R. R. J., 2000, ApJ, 537, 152
- [] Kohno K., Matsushita S., Vila-Vilaró B., Okumura S. K., Shibatsuka T., Okiura M., Ishizuki S., Kawabe R., 2001, in The Central Kiloparsec of Starbursts and AGN: The La Palma Connection, eds Knapen J.H., Beckman J.E., Shlosman I., Mahoney T.J., ASP Conf. Proc., 249, 672
- [] Kondratko P.T., Greenhill L.J., Moran J.M., 2005, ApJ, 618, 618
- [] Leahy J.P., Muxlow T.W.B., Stephens P.W., 1989, MNRAS, 239, 401
- [] Leon S., Eckart A., Laine S., Schinnerer E., 2003, in Active Galactic Nuclei: from Central Engine to Host Galaxy, eds S. Collin, F. Combes and I. Shlosman., ASP Conf. Proc., 290, 395
- [] McDonald A.R., Muxlow T.W.B., Wills K.A., Pedlar A., Beswick R.J., 2002, MNRAS, 334, 912
- [] Mohan N.R., Anantharamaiah K.R., Goss W.M., 2002, ApJ, 574, 701
- [] Muxlow T.W.B., Pedlar A., Wilkinson P.N., Axon D.J., Sanders E.M., de Bruyn A.G., 1994, MNRAS, 266, 455
- [] Osterbrock D. E., Cohen R. D., 1982, ApJ, 261, 64
- [] Pogge R.W., 1988, ApJ, 328, 519
- [] Reuter H.-P., Klein U., Lesch H., Wielebinski R., Kronberg P.P., 1992, A&A, 256, 10
- [] Rubin V. C., Thonnard N., Ford W. K., Jr., 1975, ApJ, 199, 31
- [] Saikia D.J., Unger S.W., Pedlar A., Yates G.J., Axon D.J., Wolstencroft R.D., Taylor K., Gyldenkerne K., 1990, MNRAS, 245, 397
- [] Sakamoto K., et al., 2006, ApJ, 636, 685
- [] Schinnerer E., Eckart A., Boller Th., 2000, ApJ, 545, 205
- [] Seaquist E. R., Odegard N., 1991, ApJ, 369, 320
- [] Spergel D.N. et al., 2003, ApJS, 148, 175
- [] Stone J.L. Jr., Wilson A.S., Ward M.J., 1988, ApJ, 330, 105
- [] Strickland D.K., Heckman T.M., Colbert E.J.M., Hoopes C.G., Weaver K.A., 2004, ApJS, 151, 193
- [] Ulvestad J.S., Antonucci R.R.J., 1997, ApJ, 488, 621
- [] Ulvestad J.S., Wilson A.S., 1989, ApJ, 343, 659
- [] Ulvestad J.S., Wilson A.S., 1984, ApJ, 285, 439
- [] Ulvestad J.S., Wilson A.S., Sramek R.A., 1981, ApJ, 247, 419
- [] Veilleux S., 2001, in Starburst Galaxies: Near and Far, eds Tacconi L., Lutz D., Springer-Verlag, Heidelberg, p. 88
- [] Veilleux S., Rupke D.S., 2002, ApJ, 565, L63
- [] Veilleux S., Shopbell P. L., Miller S. T., 2001, AJ, 121, 198
- [] Veilleux S., Cecil G., Bland-Hawthorn J., 2005, ARA&A, 43, 769
- [] Webber W.R., 1991, in The interpretation of modern synthesis observations of spiral galaxies, eds Duric N., Crane P.C., ASP Conf. Series, 18, 37
- [] Wilcots E.M., Turnbull M.C., Brinks E., 2001, ApJ, 560, 110
- [] Wills K.A., Pedlar A., Muxlow T.W.B., Stevens I.R., 1999, MNRAS, 305, 680
- [] Wilson A.S., Willis A. G, 1980, ApJ, 240, 429
- [] Wilson A.S., Wu Xuening, Heckman T. M., Baldwin J. A., Balick B., 1989, ApJ, 339, 729
- [] Yoshida M. Taniguchi Y., Murayama T., 1999, AJ, 117, 1158
- [] Zurita A., Rozas M., Beckman J. E., 2000, A&A, 363, 9